DIE VERBLÜFFEND EINFACHE MATHEMATIK DES KLIMASCHUTZES THE AMAZINGLY SIMPLE MATHEMATICS OF CLIMATE PROTECTION - Mesa Parts
←
→
Page content transcription
If your browser does not render page correctly, please read the page content below

DIE VERBLÜFFEND EINFACHE MATHEMATIK DES
                  KLIMASCHUTZES

  THE AMAZINGLY SIMPLE MATHEMATICS OF CLIMATE
                  PROTECTION

Prof. Dr.-Ing. Thomas Willner
Verfahrenstechnik / Chemical Engineering
Hamburg University of Applied Sciences (HAW Hamburg)
Mail: thomas.willner@haw-hamburg.de
Twitter: @thomas_willner

Hydrogen Mission Webinar 10 June 2020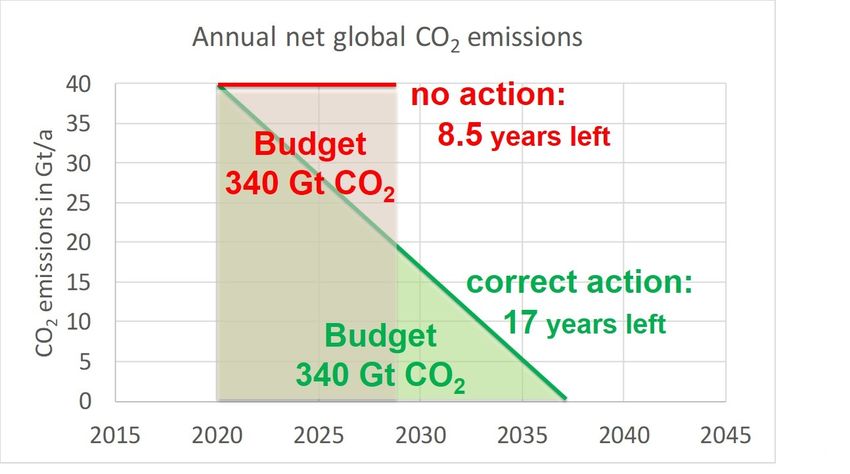
THE AMAZINGLY SIMPLE MATHEMATICS OF CLIMATE
                  PROTECTION

                 Objectification of the discussion
                 on climate protection measures

Prof. Dr.-Ing. Thomas Willner
Verfahrenstechnik / Chemical Engineering
Hamburg University of Applied Sciences (HAW Hamburg)
Mail: thomas.willner@haw-hamburg.de
Twitter: @thomas_willner

                                                       1

Hydrogen Mission Webinar 10 June 2020
MATHEMATICS OF CLIMATE PROTECTION
Boundary conditions and data basis
Target: 1.5 degree target
Basis: IPCC Special Report
on Global Warming of 1.5°C,
October 2018
But, according to risk analysis:
No ticking time bombs:
> no CCS (Carbon Capture and Storage)
. with pressurized CO2 storage
> no global renaissance of nuclear power
2
Faculty of Life Sciences, Department of Process Engineering
Prof. Dr.-Ing. Thomas Willner
LINKING THE MATHEMATICS OF CLIMATE PROTECTION
WITH CLIMATE PROTECTION MEASURES
Application example:
Scientific analysis of climate protection measures in the
transport sector
Method:
technology neutral analysis
the climate performance counts
the mathematics evaluates the measures
3
Faculty of Life Sciences, Department of Process Engineering
Prof. Dr.-Ing. Thomas Willner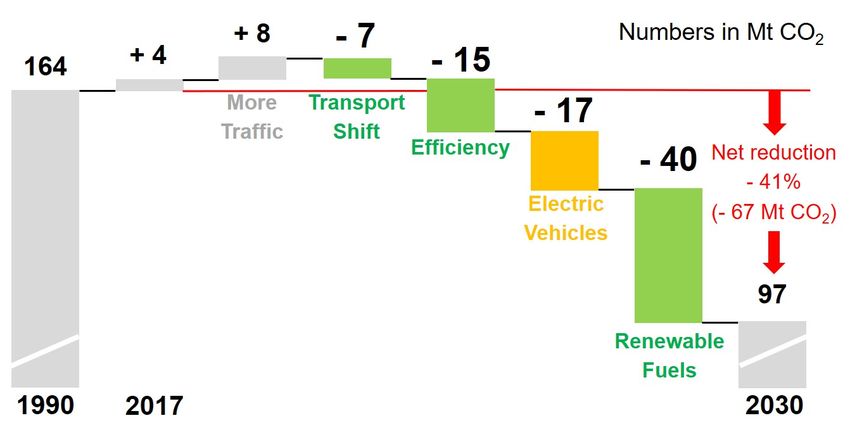
MATHEMATICS OF CLIMATE PROTECTION

CO2 emission budget (1.5-degree target) from Jan. 2020:                340 Gt CO2
Current level of CO2 emissions:                                 40 Gt CO2 per year

                                                                               4

  Faculty of Life Sciences, Department of Process Engineering
  Prof. Dr.-Ing. Thomas Willner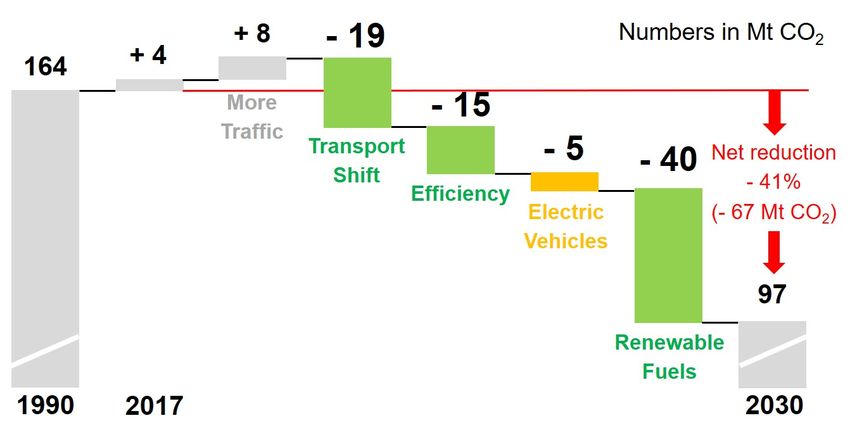
MATHEMATICS OF CLIMATE PROTECTION

CO2 emission budget (1.5-degree target) from Jan. 2020:                            340 Gt CO2
Current level of CO2 emissions:                                             40 Gt CO2 per year

                                                                no action

                                                                                           5

  Faculty of Life Sciences, Department of Process Engineering
  Prof. Dr.-Ing. Thomas Willner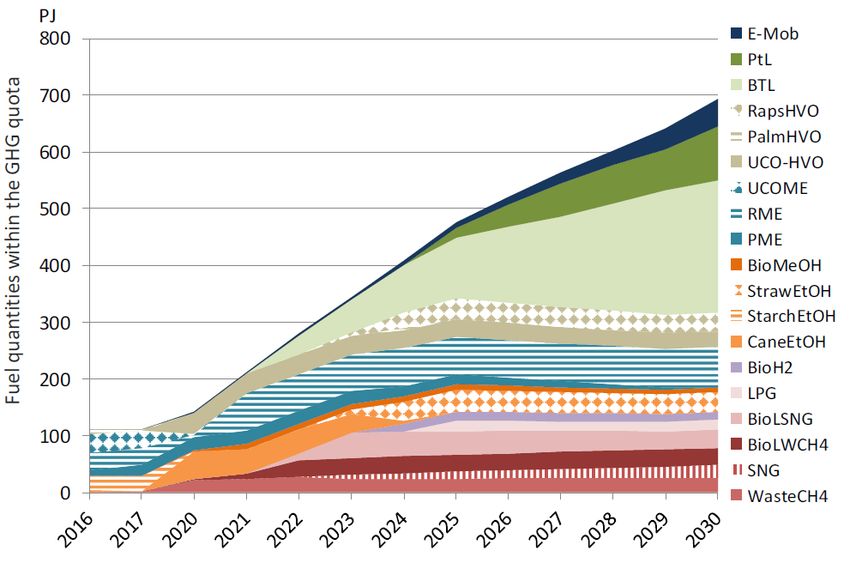
MATHEMATICS OF CLIMATE PROTECTION

CO2 emission budget (1.5-degree target) from Jan. 2020:                            340 Gt CO2
Current level of CO2 emissions:                                             40 Gt CO2 per year

                                                                no action

                                                                4 years delay action

                                                                                           6

  Faculty of Life Sciences, Department of Process Engineering
  Prof. Dr.-Ing. Thomas Willner
MATHEMATICS OF CLIMATE PROTECTION
CO2 emission budget (1.5-degree target) from Jan. 2020: 340 Gt CO2
Current level of CO2 emissions: 40 Gt CO2 per year
no action
4 years delay action
correct action
7
Faculty of Life Sciences, Department of Process Engineering
Prof. Dr.-Ing. Thomas WillnerMATHEMATICS OF CLIMATE PROTECTION
Conclusions for the requirements for climate protection
measures:
No delay: Immediate GHG reducing effect
No GHG export: GHG reduction in one sector (or country)
must not lead to GHG increases in other sectors (or countries)
Fast roll-out: It must be possible to implement the measure
quickly worldwide
8
Faculty of Life Sciences, Department of Process Engineering
Prof. Dr.-Ing. Thomas WillnerCLIMATE PROTECTION MEASURES FOR TRANSPORT
German Climate Protection Program (CPP) 2030:
Reference 1990: 164 Mt/a CO2
transport sector without international aviation and shipping
Target 2030: 95 to 98 Mt/a CO2
Net reduction = about -41%
9
Faculty of Life Sciences, Department of Process Engineering
Prof. Dr.-Ing. Thomas WillnerCLIMATE PROTECTION MEASURES FOR TRANSPORT
German Climate Protection Program (CPP) 2030:
No technology neutrality:
Strong focus on electric mobility
13,000 €/BEV German tax revenue losses = 130 billion €/10 Mio. BEV)
Source: MWV 2020
10
Faculty of Life Sciences, Department of Process Engineering
Prof. Dr.-Ing. Thomas WillnerCLIMATE PROTECTION MEASURES FOR TRANSPORT Measures to meet the targets of the German Climate Protection Program 2030 4 groups of measures (aligned with BDI, but gases shifted to group 4): 1. Transport shift: from road and air to rail and water* 2. Efficiency: improvement in all propulsion systems 3. Electric vehicles: esp. battery electric vehicles (BEV) 4. Renewable fuels: liquids and gases incl. hydrogen * including cycling Source: BDI 2019 11 Faculty of Life Sciences, Department of Process Engineering Prof. Dr.-Ing. Thomas Willner
CLIMATE PROTECTION MEASURES FOR TRANSPORT
Measures to meet the targets of the German Climate Protection Program 2030
Group 1: Transport shift:
Heavy road transport (>3.5 t) (ISI): about 40 Mt/a CO2
CO2 savings potential (BDI): > 20 Mt/a CO2
Assumed CO2 savings 2030 (BDI): 7 Mt/a CO2
Sources: Fraunhofer ISI 2018, BDI 2019
12
Faculty of Life Sciences, Department of Process Engineering
Prof. Dr.-Ing. Thomas WillnerCLIMATE PROTECTION MEASURES FOR TRANSPORT
Measures to meet the targets of the German Climate Protection Program 2030
Group 2: Efficiency:
Assumed CO2 savings 2030 (BDI): 15 Mt/a CO2
(Rebound effects not considered)
Source: BDI 2019
13
Faculty of Life Sciences, Department of Process Engineering
Prof. Dr.-Ing. Thomas WillnerCLIMATE PROTECTION MEASURES FOR TRANSPORT
Measures to meet the targets of the German Climate Protection Program 2030
Group 3: Electric vehicles (BEVs only):
Assumed number of BEVs 2030 (aligned with BDI): 7 Mio.
CO2 savings potential (own calc.): 2.44 t CO2 per car
Sectoral approach (BEVs and Ren. Fuels counted with zero emission)
Resulting CO2 savings 2030: 17 Mt/a CO2
Source: BDI 2019, own calculation
Electric vehicles = BEVs = Battery Electric Vehicles (Hybrides considered in the group 4 „Renewable Fuels“)
Electrification of road freight transport should be part of group 1 „Transport shift“ 14
Faculty of Life Sciences, Department of Process Engineering
Prof. Dr.-Ing. Thomas WillnerCLIMATE PROTECTION MEASURES FOR TRANSPORT
Measures to meet the targets of the German Climate Protection Program 2030
Group 4: Renewable fuels (liquids and gases):
Renewable fuels (DBFZ):
650 PJ (2030) =
540 PJ more than 2017
Emission factor (UBA):
73.7 t CO2/TJ
(sectoral approach)
Resulting CO2 savings
2030: 40 Mt/a CO2
15
Source: DBFZ 2019; UBA 2016
Faculty of Life Sciences, Department of Process Engineering
Prof. Dr.-Ing. Thomas WillnerCLIMATE PROTECTION MEASURES FOR TRANSPORT
Measures to meet the targets of the German Climate Protection Program 2030
Sectoral approach (BEVs and Ren. Fuels counted with zero emission)
Electric
Vehicles
High GHG export to other sectors
Low GHG export to other sectors
(Liquids
Sources: UBA 2019, BDI 2019, own calculations
and Gases)
16
Electric Vehicles = BEVs = Battery Electric Vehicles (Hybrides considered in pillar „ Renewable Fuels“)
Faculty of Life Sciences, Department of Process Engineering
Prof. Dr.-Ing. Thomas WillnerCLIMATE PROTECTION MEASURES FOR TRANSPORT
Real CO2 emission reduction performance of BEVs
The real CO2 emissions of BEVs are much higher
than zero due to:
CO2 emissions for the battery production and
CO2 emissions for the power mix production
17
Faculty of Life Sciences, Department of Process Engineering
Prof. Dr.-Ing. Thomas WillnerCLIMATE PROTECTION MEASURES FOR TRANSPORT
Real CO2 emission reduction performance of BEVs
Joanneum Research (JR) study
Golf type car: Comparison of diesel car and BEV
Diesel fuel: 2019 to 2030: B7 (7 vol% biodiesel)
Power: 2019: 580 g CO2eq/kWh (BAnz AT 30.10.18)
2030: 435 g CO2eq/kWh
Result: BEV needs 219,000 km to undercut the diesel
car in CO2 emissions 18
Source: JR 2019; Bund 2018
Faculty of Life Sciences, Department of Process Engineering
Prof. Dr.-Ing. Thomas WillnerCLIMATE PROTECTION MEASURES FOR TRANSPORT
Real CO2 emission reduction performance of BEVs
Fraunhofer ISE study
Hyundai SUV type car (generic):
Comparison of diesel car and BEV
Diesel fuel: 2019 to 2030: fossil
Power: 2020 to 2030: Ø 421 g CO2eq/kWh
Result: BEV needs 160,000 km to undercut the diesel
car in CO2 emissions 19
Source: Fraunhofer ISE 2019
Faculty of Life Sciences, Department of Process Engineering
Prof. Dr.-Ing. Thomas WillnerCLIMATE PROTECTION MEASURES FOR TRANSPORT
Real CO2 emission reduction performance of BEVs
Own calculation
Small cars: Comparison (basis ADAC test data) of
Opel Corsa diesel car (4 l/100 km WLTP = 126 g CO2eq/km) and
Renault Zoe BEV (20.3 kWh/100 km = Ø 103 g CO2eq/km)
Diesel fuel: 2019 to 2030: B7 with 6% CO2 reduction
Power: 2019 to 2030: Ø 508 g CO2eq/kWh (=JR)
Result: BEV needs about 210,000 km to undercut the
diesel car in CO2 emissions
Sources: JR 2019; ADAC 2020; Bund 2018 20
Faculty of Life Sciences, Department of Process Engineering
Prof. Dr.-Ing. Thomas WillnerCLIMATE PROTECTION MEASURES FOR TRANSPORT
Real CO2 emission reduction performance of BEVs
210,000 km driving until a BEV undercuts a status quo
diesel car (B7 diesel) in CO2 emissions:
What does this mean on the time line?
Ø mileage of a German gasoline car (BMVI): 10,900 km/a
Assumption for a BEV: 10,000 km/a
Result: A BEV needs 21 years to undercut a status quo
. diesel fuel car in CO2 emissions
. = 21 years “no action” = 21 years “delay”
Source: BMVI 2018 21
Faculty of Life Sciences, Department of Process Engineering
Prof. Dr.-Ing. Thomas WillnerCLIMATE PROTECTION MEASURES FOR TRANSPORT
Real CO2 emission reduction performance of BEVs
Electric mobility only
no action
correct action with
all options including
renewable fuels
22
Faculty of Life Sciences, Department of Process Engineering
Prof. Dr.-Ing. Thomas WillnerCLIMATE PROTECTION MEASURES FOR TRANSPORT
Real CO2 emission reduction performance of BEVs
What is the CO2 savings of BEVs just based on the
power mix without considering the battery production?
Opel Corsa diesel car: 4 l/100 km = fossil 134 g CO2eq/km
Renault Zoe BEV: 20.3 kWh/100 km:
2019: 580 g CO2eq/kWh: 118 g CO2eq/km = 12 % savings
2019-2030: 508 g “ : 103 g CO2eq/km = 23 % savings
2030: 435 g CO2eq/kWh: 88 g CO2eq/km = 34 % savings
2030: 400 g CO2eq/kWh: 81 g CO2eq/km = 39 % savings
Sources: Bund 2018; BLE 2019; JR 2019; own calculation 23
Faculty of Life Sciences, Department of Process Engineering
Prof. Dr.-Ing. Thomas WillnerCLIMATE PROTECTION MEASURES FOR TRANSPORT
Real CO2 emission reduction performance of BEVs
What is the CO2 savings of BEVs just based on the
power mix without considering the battery production?
Result: CO2 savings of BEVs against fossil diesel fuel in the
range of 12% for 2019 or optimistically 39% for 2030
according to the power mix only is very poor.
For comparison:
REDII for biofuels: min. 65% savings
Ø real average German biofuels: 83.8% (2018)
real German waste based biofuels: >90% (2018)
Sources: REDII; BLE 2019; own calculation 24
Faculty of Life Sciences, Department of Process Engineering
Prof. Dr.-Ing. Thomas WillnerCLIMATE PROTECTION MEASURES FOR TRANSPORT
Real CO2 emission reduction performance of BEVs
Overall Result:
Both the time delay and the GHG exports to the sector
industry or to other countries (battery production) and to
the sector energy (power mix) is by far to high.
BEVs can no longer be considered a climate
protection measure for Germany or comparable boundary
conditions, because it contradicts the mathematics of
climate protection.
BEVs should no longer be supported from climate
protection funds but rather, for example, from urban
planning funds or others. 25
Faculty of Life Sciences, Department of Process Engineering
Prof. Dr.-Ing. Thomas WillnerCLIMATE PROTECTION MEASURES FOR TRANSPORT
Real CO2 emission reduction performance of BEVs
Recommendations for policy makers:
Electric mobility should meet the same strict
sustainability criteria as renewable fuels already do
today!
.
This must include for example:
Real CO2 emissions including well-to-wheel (WTW)
Ecological and social issues of the lithium
production in countries such as Bolivia, Chile or Argentina
Social issues of the copper mining for cobalt
production in countries such as Congo 26
Faculty of Life Sciences, Department of Process Engineering
Prof. Dr.-Ing. Thomas WillnerCLIMATE PROTECTION MEASURES FOR TRANSPORT
Preferred scenario for the German Climate Protection Program 2030
Sectoral approach (BEVs and Ren. Fuels counted with zero emission)
Electric
Vehicles
2 Mio.
High GHG export to other sectors
Low GHG export to other sectors
(Liquids
and Gases)
Sources: UBA 2019, BDI 2019, own calculations
27
Electric Vehicles = BEVs = Battery Electric Vehicles (Hybrides considered in pillar „ Renewable Fuels“)
Faculty of Life Sciences, Department of Process Engineering
Prof. Dr.-Ing. Thomas WillnerCLIMATE PROTECTION MEASURES FOR TRANSPORT
The real CO2 emission reduction performance counts
Recommendations for policy makers:
The best performing measures, such as
transport shift and renewable fuels
should be promoted the most.
The German BImSchV should be revised. The
standard DIN EN 15940 for paraffinic fuels must be
adopted.
The European fleet regulation system needs urgent
correction: Renewable fuels must be counted towards
the fleet limits. (Currently electric vehicles are counted with
zero emission, but renewable fuels do not count at all.)
28
Faculty of Life Sciences, Department of Process Engineering
Prof. Dr.-Ing. Thomas WillnerCLIMATE PROTECTION MEASURES FOR TRANSPORT
FAQs
A company or a private person generates extra renewable energy only
for the refuelling of the own BEVs (stand-alone solution SAS).
Do these BEVs physically count as 100% renewable?
country
SAS
Answer: No, for the country counts the power mix. 29
Faculty of Life Sciences, Department of Process Engineering
Prof. Dr.-Ing. Thomas WillnerCLIMATE PROTECTION MEASURES FOR TRANSPORT
FAQs
The efficiency of BEVs is very high.
Does this count?
Answer: 1. The power production must be considered:
Today Future 100% renewable
Large capacity storage
Power prod.: 48% 70% with efficiency 25% to 30%
Grid: 90% 90%
Charge/Discharge: 80% 80%
Engine/Propulsion: 90% 90%
Heating/Cooling: 80% 80%
Overall efficiency: 25% 36% 30
Faculty of Life Sciences, Department of Process Engineering
Prof. Dr.-Ing. Thomas WillnerCLIMATE PROTECTION MEASURES FOR TRANSPORT
FAQs
The efficiency of BEVs is very high.
Does this count?
Answer: 2. Renewable energy import must be considered:
Germany is an energy importing country (70% today)
It will remain an energy importing country
Renewable energy should be imported from countries with an
oversupply of renewable energy in the form of hydrogen and e-fuels.
If these imports are in the country, it is more efficient to use them
directly in FCs or CEs than to convert them into electricity for BEVs.
FC = Fuel Cell; CE = Combustion Engine; BEV = Battery Electric Vehicle 31
Faculty of Life Sciences, Department of Process Engineering
Prof. Dr.-Ing. Thomas WillnerCLIMATE PROTECTION MEASURES FOR TRANSPORT
FAQs
Currently we have biodiesel, bioethanol and biogas as renewable
fuels in the market. What other options will be available?
Answer: BtX, WtX, PtX and hybrids
B = biomass including residues and waste
W = non-biogenic waste
P = power (PtX = e-fuels)
X = fuels and chemicals (liquids and gases)
Hydrogen will play an important role
DECHEMA Position Paper “Advanced alternative liquid fuels”
https://dechema.de/dechema_media/Downloads/Positionspapiere/2018_alternativeBrennstoffe_en.pdf
32
Faculty of Life Sciences, Department of Process Engineering
Prof. Dr.-Ing. Thomas WillnerCLIMATE PROTECTION MEASURES FOR TRANSPORT
FAQs
Currently we have biodiesel, bioethanol and biogas as renewable
fuels in the market. When will other options be available?
Answer: See studies
on ramp-up curves
e.g. DBFZ study 2020
33
Source: DBFZ 2019; DBFZ 2020
Faculty of Life Sciences, Department of Process Engineering
Prof. Dr.-Ing. Thomas WillnerCLIMATE PROTECTION MEASURES FOR TRANSPORT
FAQs
Currently the fuel price at the station is in the range of 1.20 €/Liter.
What will renewable fuels cost?
Exemplary answers:
E-fuels (imported): Siemens: Price is currently at a level of 2 €/ltr.,
expected to go down to 1 €/ltr. within the next 5 years
Waste based fuels:
o BtL (via Syngas): Price level 1 €/ltr.
o HVO: Price level 1 €/ltr.
o Plastic conversion: Price well below 1 €/ltr.
General tendency: Decreasing alternative fuel prices 34
Faculty of Life Sciences, Department of Process Engineering
Prof. Dr.-Ing. Thomas WillnerCLIMATE PROTECTION MEASURES FOR TRANSPORT
FAQs
Currently we produce renewable fuels mainly from agricultural crops.
Do renewable fuels require monocultures on this basis?
Answer: No,
technologies are flexible
Examples:
Biodiesel can be produced
from any kind of vegetable or
animal oil or fat or used
cooking oil or …
Biogas can be produced
from corn or flower meadows
or food waste … 35
Faculty of Life Sciences, Department of Process Engineering
Prof. Dr.-Ing. Thomas WillnerCLIMATE PROTECTION MEASURES FOR TRANSPORT
FAQs
Currently we consume about 4.3 billion oil per year.
Is there sufficient potential for renewable fuels?
Yes: Global situation:
Biomass growth and dying: 100 Gt/a C
Fossil carbon emission: 10 Gt/a C
Fossil carbon emission for transport: 2 Gt/a C
2% of the biomass carbon on the dying side would cover the total fuel demand.
But we do not need this, because there is
additional potential for waste based fuels and e-fuels
Source: IPCC 36
Faculty of Life Sciences, Department of Process Engineering
Prof. Dr.-Ing. Thomas WillnerCLIMATE PROTECTION MEASURES FOR TRANSPORT
FAQs
Currently we consume about 4.3 billion oil per year.
Is there sufficient potential for renewable fuels?
Yes: Germany, considering the import potential from EU:
Potential for biofuels: 630 to 959 PJ/a
(CO2 savings: 46 to 71 Mt/a)
without cropped biomass
plus non-biogenic waste fuels
plus e-fuels (imported)
Sources:
S2Biom Report Nov. 2016 D8.2 Vision for 1 billion dry tonnes lignocellulosic biomass as a contribution to biobased economy by 2030 in Europe
EU Commission Sub Group on Advanced Biofuels (SGAB) Final Report March 2017
Willner: NPM-AG2_FG3 Workshop 29 April 2019 37
Faculty of Life Sciences, Department of Process Engineering
Prof. Dr.-Ing. Thomas WillnerCONCLUSION
We not only need biodiversity,
we also need technology diversity.
No technical monocultures.
“All-Electric” would be a monoculture.
38
Faculty of Life Sciences, Department of Process Engineering
Prof. Dr.-Ing. Thomas WillnerREQUEST
Engineers to the front!
Let`s start!
39
Faculty of Life Sciences, Department of Process Engineering
Prof. Dr.-Ing. Thomas WillnerSOURCES 1
• ADAC (2018): Allgemeiner Deutscher Automobil-Club (ADAC): „Generation
Elektro 2.0“. ADAC motorwelt 11/2018 pp 18-24.
• ADAC (2019a): Allgemeiner Deutscher Automobil-Club (ADAC): „Durchwachsene
Bilanz“. ADAC motorwelt 11/2019 pp 24-28.
• ADAC (2019b): Allgemeiner Deutscher Automobil-Club (ADAC): „Elektroautos
brauchen die Energiewende: Die Klimabilanz“. ADAC 25.10.2019. Viewed on
03 Jan. 2020 from https://www.adac.de/verkehr/tanken-kraftstoff-
antrieb/alternative-antriebe/klimabilanz/
• ADAC (2020): Allgemeiner Deutscher Automobil-Club (ADAC): „Diesel: Die
sparsamsten Modelle aller Klassen“. Viewed on 13 Jan. 2020 from
https://www.adac.de/rund-ums-fahrzeug/auto-kaufen-verkaufen/autokosten/die-
sparsamsten-diesel-aller-klassen/
• BDI (2019): „Analyse Klimapfade Verkehr 2030“. Study of BCG (Boston
Consulting Group) and Prognos for the BDI (Bundesverband der Deutschen
Industrie). Presented by BDI in Febr. 2019 in Berlin. Viewed on 03 Jan. 2020 from
https://bdi.eu/publikation/news/analyse-der-klimapfade-verkehr-2030/
40
Faculty of Life Sciences, Department of Process Engineering
Prof. Dr.-Ing. Thomas WillnerSOURCES 2
• BImSchG (2014): Bundes-Immissionsschutzgesetz (BImSchG): Zwölftes Gesetz
zur Änderung des Bundes-Immissionsschutzgesetzes vom 20. Nov. 2014.
• BImSchV (2019): Bundes-Immissionsschutzverordnung (BImSchV): „Verordnung
zur Umsetzung der Richtlinie 2014/94/EU und weiterer
immissionsschutzrechtlicher Rechtsakte der Europäischen Union (10. BImSchV)“.
Bundesgesetzblatt Jahrgang 2019 Teil I Nr. 50, Bonn, 19. Dez. 2019, 2739-2756.
• BLE (2019): Bundesanstalt für Landwirtschaft und Ernährung (Federal Office for
Agriculture and Food): „Evaluation and Progress Report 2018“. Bonn 2019.
• BMVI (2018): Bundesministerium für Verkehr und digitale Infrastruktur (BMVI):
„Verkehr in Zahlen 2018/2019“. Kraftfahrt-Bundesamt, Flensburg 2018.
• Bonaldo, F. (2019): „Beschlusslage Klimaschutzgesetz: Das Maßnahmenkonzept
der Bundesregierung für die Verpflichtungsperiode 2021 bis 2030“. Presented by
F. Bonaldo at the 6th BBE/UFOP seminar „Nachhaltigkeit von Biokraftstoffen und
erneuerbarem Strom“ on 14 Nov. 2019 in Berlin.
• Buchspies, B.; Kaltschmitt, M. (2018): „A consequential assessment of changes in
greenhouse gas emissions due to the introduction of wheat straw ethanol in the
context of European legislation“. In: Applied Energy 211, pp 368-381.
41
Faculty of Life Sciences, Department of Process Engineering
Prof. Dr.-Ing. Thomas WillnerSOURCES 3
• Bund (2018): „Umweltbundesamt: Bekanntmachung nach § 5 Absatz 3 der
Verordnung zur Festlegung weiterer Bestimmungen zur Treibhausgasminderung
bei Kraftstoffen“. Bundesanzeiger 30 Oct. 2018.
• Bund (2019a): Bundesregierung Deutschland (Klimakabinett): „Eckpunkte für das
Klimaschutzprogramm“. Key issues paper published on 20 Sept. 2019.
• Bund (2019b): Deutscher Bundestag: „Klimaschutzprogramm 2030 der
Bundesregierung zur Umsetzung des Klimaschutzplans 2050“. Printed matter
number 19/13900 of 11 Oct. 2019.
• Bund (2020): Bundesregierung Deutschland: „Kaufprämie für Elektroautos
erhöht“. Viewed on 18 Febr. 2020 from https://www.bundesregierung.de/breg-
de/themen/energiewende/kaufpraemie-fuer-elektroautos-erhoeht-369482
• DBFZ (2019): „Untersuchungen zur Ausgestaltung der Biokraftstoffgesetzgebung“.
Study of the DBFZ (Deutsches Biomasseforschungszentrum). Presented by F.
Müller-Langer at the International Congress „Fuels of the Future“ on 21 Jan. 2019
in Berlin.
• DBFZ (2020): Meisel et al.: Future Renewable Fuel Mixes in Transport in
Germany under REDII and Climate Protection Targets. Energies 2020, 13, 1712;
doi:10.3390/en13071712 42
Faculty of Life Sciences, Department of Process Engineering
Prof. Dr.-Ing. Thomas WillnerSOURCES 4
• ETR (2019): Economic Trends Research (ETR): “Steuern und
regulierungsbedingte Belastungen von Energie und Fahrzeugen für den mobilen
Individualverkehr: Ein Up-date nach dem Klimaschutzplan 2030“. Study on behalf
of the MWV (Mineralölwirtschaftsverband Deutschland), Hamburg, Nov. 2019
• EU (2017): „Study on the review of the list of Critical Raw Materials: Critical Raw
Materials Factsheets“. European Commission, Brussels, June 2017.
• EU (2018): Directive (EU) 2018/2001 of the European Parliament and of the
Council of 11 December 2018 on the promotion of the use of energy from
renewable sources (recast).
• EU (2019): Regulation (EU) 2019/631 of the European Parliament and of the
Council of 17 April 2019 setting CO2 emission performance standards for new
passenger cars and for new light commercial vehicles, and repealing Regulations
(EC) No 443/2009 and (EU) No 510/2011 (recast)
• Focus (2019): „Es wäre ein Desaster für Volkswagen: China erwägt teilweise
Abkehr vom Elektroauto“. Focus 13.12.2019. Viewed on 03 Jan. 2020 from
https://www.focus.de/finanzen/boerse/waere-ein-desaster-fuer-volkswagen-china-
erwaegt-teilweise-abkehr-vom-elektroauto_id_11446352.html
43
Faculty of Life Sciences, Department of Process Engineering
Prof. Dr.-Ing. Thomas WillnerSOURCES 5
• Fraunhofer-ISE (2019): Fraunhofer Institute for Solar Energy Systems ISE:
„Treibhausgas-Emissionen für Batterie- und Brennstoffzellenfahrzeuge mit
Reichweiten über 300 km“. Study on behalf of H2 Mobility. Viewed on 03 Jan.
2020 from
https://www.ise.fraunhofer.de/content/dam/ise/de/documents/news/2019/ISE_Erge
bnisse_Studie_Treibhausgasemissionen.pdf
• Fraunhofer-ISI (2018): „Alternative Antriebe und Kraftstoffe im
Straßengüterverkehr – Handlungsempfehlungen für Deutschland“.
• Handelsblatt (2020): “Autoindustrie Umstellung auf E-Mobilität gefährdet 410 000
Arbeitsplätze“. Handelsblatt 13.01.2020. Viewed on 25 Jan. 2020 from
https://www.handelsblatt.com/politik/deutschland/autoindustrie-umstellung-auf-e-
mobilitaet-gefaehrdet-410-000-arbeitsplaetze/25405230.html?ticket=ST-1893331-
EF0dAeWlEbXbLnqMqeJj-ap6
• IPCC (2018): IPCC Special Report on Global Warming of 1.5°C. 8 Oct. 2018.
• IRENA (2016): “Boosting Biofuels – Sustainable Paths to Greater Energy
Security”.
44
Faculty of Life Sciences, Department of Process Engineering
Prof. Dr.-Ing. Thomas WillnerSOURCES 6
• JR (2019): Joanneum Research (JR): „Geschätzte Treibhausgasemissionen und
Primärenergieverbrauch in der Lebenszyklusanalyse von Pkw-basierten
Verkehrssystemen“. Study on behalf of the ÖAMTC (Österreichischer Automobil-,
Motorad- und Touring Club), FiA (Fédération Internationale de l‘Automobile) and
ADAC (Allgemeiner Deutscher Automobil-Club), Graz, Sept. 2019.
• Manager-Magazin (2019a): “Bosch kündigt Stellenabbau an”. Manager-Magazin
06.08.2019. Viewed on 03 Jan. 2020 from https://www.manager-
magazin.de/unternehmen/autoindustrie/volkmar-denner-bosch-chef-kuendigt-
stellenabbau-an-a-1280626.html
• Manager-Magazin (2019b): “Bosch streicht 1600 Stellen”. Manager-Magazin
23.10.2019. Viewed on 03 Jan. 2020 from https://www.manager-
magazin.de/unternehmen/autoindustrie/robert-bosch-gmbh-stellenabbau-betrifft-
1600-arbeitsplaetze-a-1292853.html
• MWV (2018): Mineralölwirtschaftsverband (MWV): “Annual Report 2018”.
• MWV (2020): Mineralölwirtschaftsverband (MWV): “Market Entry Conditions of
PtX Fuels – Recent Developments”. Presented by C. Küchen at the International
Congress „Fuels of the Future“ on 21 Jan. 2020 in Berlin.
45
Faculty of Life Sciences, Department of Process Engineering
Prof. Dr.-Ing. Thomas WillnerSOURCES 7
• NPM (2019): Reports of the German national platform future of mobility (NPM).
Viewed on 12 Dec. 2019 from https://www.plattform-zukunft-mobilitaet.de/
• ProcessNet (2018): “Advanced alternative liquid fuels: For climate protection in
the global raw materials change”. Position paper of the working group “Alternative
Liquid and Gaseous Fuels” of the ProcessNet, a joint initiative of DECHEMA
and VDI-GVC. Viewed on 03 Jan. 2020 from
https://dechema.de/dechema_media/Downloads/Positionspapiere/2018_alternativ
eBrennstoffe_en-p-20005513.pdf
• Prognos et al. (2018): Prognos, Fraunhofer-Institut für Umwelt-, Sicherheits- und
Energietechnik (UMSICHT) and Deutsches Biomasseforschungszentrum (DBFZ):
„Status und Perspektiven flüssiger Energieträger in der Energiewende“. A study
on behalf of Institut für Wärme und Oeltechnik (IWO), Mittelständische
Energiewirtschaft Deutschland (MEW), Mineralölwirtschaftsverband (MWV) und
UNITI Bundesverband mittelständischer Mineralölunternehmen.
• S2Biom (2016): “Vision for one billion dry tonnes lignocellulosic biomass as a
contribution to biobased economy by 2030 in Europe”. Report D8.2, Nov. 2016.
46
Faculty of Life Sciences, Department of Process Engineering
Prof. Dr.-Ing. Thomas WillnerSOURCES 8
• Santarius, T. (2014): “Der Rebound-Effekt: Ein blinder Fleck der sozial-
ökologischen Gesellschaftstransformation”. GAIA 23/2, pp 109-117.
• SGAB (2017): EU Commission Sub Group on Advanced Biofuels (SGAB): “Final
Report”. March 2017.
• Spiegel (2019): “Umweltverband befürchtet Verlust von 360.000 Arbeitsplätzen in
der Autoindustrie”. Der Spiegel, 01.11.2019. Viewed on 03 Jan. 2020 from
https://www.spiegel.de/wirtschaft/soziales/bund-befuerchtet-verlust-von-360-000-
jobs-in-der-autoindustrie-a-1294431.html
• Stern (2018): “Hungrige neue Welt – Die Digitalisierung ist überall. Um die Flut an
Daten zu bewältigen, werden gigantische Mengen Strom gebraucht”. Stern, 31
Oct. 2018, pp 71-74.
• UBA (2016): “CO2-Emissionsfaktoren für fossile Brennstoffe”. Umweltbundesamt
(UBA) publication June 2016.
• UBA (2019): “National Trend Tables for the German Atmospheric Emission
Reporting 1990 – 2017”. Final version of the Umweltbundesamt (UBA) for the
reporting period 2019.
47
Faculty of Life Sciences, Department of Process Engineering
Prof. Dr.-Ing. Thomas WillnerSOURCES 9
• UFOP (2020): Union zur Förderung von Oel- und Proteinpflanzen (UFOP): „UFOP
Report on Global Market Supply 2019/2020“
• Willner, T. (2019): „The Key Role of Liquid Alternative Fuels for Climate Protection:
Time is Running Out”. In: Bioenergy No 7, 2019, pp 475–495.
48
Faculty of Life Sciences, Department of Process Engineering
Prof. Dr.-Ing. Thomas WillnerYou can also read