ISSUE: South Island, May 2020 - Rural Fire Research
←
→
Page content transcription
If your browser does not render page correctly, please read the page content below
New Zealand Seasonal Fire Danger Outlook 2019/20
ISSUE: South Island, May 2020
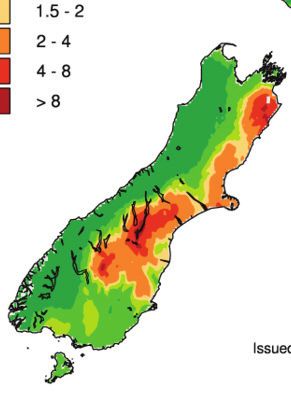
Current fire danger situation & outlook: Canterbury (Banks Peninsula and Ashburton). Meanwhile, NIWA’s Drought
Index reveals that the very dry conditions previously experienced last
As we move from autumn into winter, the fire season typically winds down, month have dramatically declined across the South Island, with only small
the days are noticeably shorter, and it’s generally becoming cooler and “dry” pockets currently existing in Nelson, Marlborough and Canterbury.
damper. Much needed rainfall is helping ease fire dangers across the
country. In general, monthly fire dangers and fire climate severity has One of the major climate drivers for New Zealand is the El Niño–Southern
reduced to Low or Moderate levels across much of the South Island (Figures Oscillation (ENSO). The current weather pattern for New Zealand is
1, 5 & 9). However, High to Extreme conditions still exist in Marlborough, consistent with neutral ENSO conditions. International models indicate that
Kaikoura, coastal Canterbury, inland pockets of South Canterbury and neutral levels will continue over the next three months (76% chance during
Central Otago. This is reflected in the current daily fuel moisture codes and May - July 2020). Typically, we experience cooler and wetter weather near
fire behaviour indices for the first week of May (BUI, DC, DMC and FFMC). the end of autumn and into winter. During the next three months (May
These codes indicate the ease of ignition, the amount of fuel available for - July), it is anticipated that New Zealand will experience fluctuations of
combustion and how difficult and prolonged mop-up could be. Many eastern settled and unsettled weather. Higher than normal air pressure is expected
locations still have dry medium to heavy fuels for this time of the year. over the North and lower than normal pressure over the South Island,
Exceptional locations include Nelson and Marlborough, coastal pockets in contributing to more westerly quarter winds over the country. Temperatures
north and south Canterbury, central and coastal Otago. are likely to be above average or near average in the north and east of both
islands. Rainfall is likely to be near normal or below normal in the north and
Fuel dryness across the South Island peaked either in January or February east of both islands.
before declining over the months of March and April. Continued cool wet
weather means that we are now in the tail end of the fire season. Most The month of May is anticipated to be cool and wet. Normal or above
South Island DC and BUI values are either on track with or above the normal rainfall amounts are expected across the country. May will be cooler
historical trends for this time of the year. Rainfall has continued to affect the than average, largely driven by short sharp cold snaps as fronts move
medium-sized fuels (DMCs) and reduce BUI values further. BUIs are mostly across the country from the Tasman Sea and Southern Ocean.
below 50 points (one exception being Upper Clarence in Marlborough
(120)). Several weather stations in the Nelson, Marlborough, Canterbury We are now at the tail end of the 2019/20 fire season. In general, fire
(North and South) and Otago regions still have significantly high DC values danger and fire climate severity peaked in January/February for the South
(ranging between 400 - 800 points). Graphs tracking individual station Island. The wildfire behaviour potential for May will continue to decline as
trends are available on the Scion website. regions experience much needed rainfall and cooler temperatures. The
South Island is currently tracking similar to the 2014/15 neutral fire season
Soils are either dry or showing signs of dryness in eastern areas, including (Figures 6, 8 & 9). In general, the risk of wildfire outbreaks will be low for
coastal pockets in Nelson, Marlborough, Canterbury, and inland pockets the month of May. However, some eastern regions may still experience
of South Canterbury and Central Otago (Figure 3). Soil moisture levels Very High to Extreme daily values during May. Based on the current soil
are near or at water surplus along the West Coast, inland Marlborough, moisture status and elevated FWI codes and indices, specific areas to
and Kaikoura. This is somewhat reflected in the soil moisture anomaly watch are: Marlborough, Kaikoura, North and South Canterbury, and
map (Figure 4), where drier than normal soils are found in Nelson and Central Otago.
Low
Moderate
High
Very high
Extreme
May 2019 May 2015
April 2020
Figure 1. Monthly average Severity Rating for: current (left), last year (middle), & 2014/15 Neutral year following another Neutral year (right).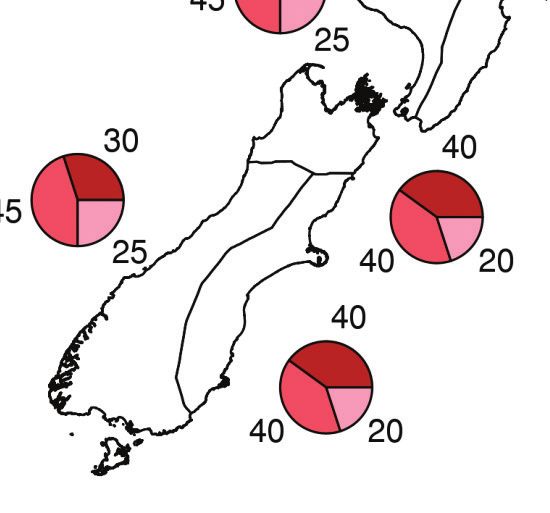
EXPECTED CLIMATE OUTLOOK:                                                    or above average in the north and along the east coast; near average
                                                                             temperatures are most likely on the West Coast. Cold snaps and
The ENSO (El Niño–Southern Oscillation) and Indian Ocean Dipole              frosts can be expected. Rainfall is expected to be near normal or
(IOD) both remain at neutral levels in the tropical Pacific. International   below normal in the north and east; near normal rainfall is likely along
climate models predict that neutral ENSO conditions are likely to            the West Coast. Soil moisture and river flows are likely to be near
persist into late winter/early spring. There are hints that La Niña          normal in the west of the South Island; for the east, soil moisture
conditions could develop in the tropical Pacific by early spring, but        levels and river flows are equally likely to be near normal or below
the persistence of this pattern is less clear; currently five of the eight   normal.
climate models suggest neutral conditions will remain. It should be
noted that ENSO forecasts at this time of the year (autumn) tend to
have lower accuracy and should therefore be used with caution.               Regional breakdown (Figure 2):
                                                                             Temperatures are most likely to be:
During neutral ENSO conditions in spring or autumn, New Zealand              •  near average (40% chance) or above average (40%) for Tasman,
typically experiences periods of settled weather followed by more               Nelson, Marlborough, Buller, coastal Canterbury and eastern
active systems (stormy weather). It’s difficult to forecast weather             Otago;
without strong climate drivers (in neutral conditions), however New          •  near average (45%) for the West Coast, Alps and foothills, inland
Zealand’s weather during neutral phases is largely driven by the                Otago and Southland.
Tasman Sea and Southern Ocean. Warm Sea Surface Temperatures
(SSTs) experienced in the months of March and April have begun to            Rainfall totals are most likely to be:
ease off. These SSTs have up to now helped modify air masses and             • near normal (40% chance) or below normal (35%) for Tasman,
reduced the sting of the cold air coming up from the south.                     Nelson, Marlborough, and Buller;
We are now outside the typical tropical cyclone season, which runs           • near normal (45%) for the West Coast, Alps and foothills, inland
from 1 November to 30 April. On the odd occasion, cyclone activity              Otago and Southland;
can still happen outside this period. Currently, MetService forecasts        • near normal (35%) or below normal (40%) for coastal Canterbury
have not observed weather indicators for cyclone activity in the South          and east Otago
Pacific tropics. In general, 1 out of 10 tropical cyclones forming in
the Pacific affect New Zealand’s weather as an ex-tropical cyclone           Soil moisture levels are most likely to be:
(most commonly in February or March). So far 2 tropical cyclones             •   near normal (40% chance) or below normal (35%) for Tasman,
have passed near New Zealand during February and March of                        Nelson, Marlborough and Buller;
2020, delivering strong winds and heavy rain to parts of the country         •   near normal (40%) for the West Coast, Alps and foothills, inland
(Tropical Cyclones Uesi and Gretel).                                             Otago and Southland;
                                                                             •   near normal (45%) or below normal (40%) for coastal Canterbury
                                                                                 and east Otago.

This month: May 2020
We typically start to notice cooler changeable weather in autumn.
Temperatures naturally trend downwards from mid-March to                     Last month: April 2019
September. Looking ahead, May will continue to experience                    Looking back, April experienced changeable weather. New Zealand
changeable weather, as high pressure brings spells of dry settled            experienced extended periods of warm settled weather interspersed
weather across the country, followed by lows and showery conditions.         with cool wet weather. Kaikoura and Christchurch experienced
It is anticipated that drought conditions will ease for those areas          temperatures of 25ºC which is exceptional for late April. Some
still experiencing dry soils. A wet start to early May is predicted,         locations saw more rainfall in April compared to the last three months.
with normal to above normal rainfall overall for most locations. The         Rainfall was still less than 50% than normal across northern and
exception is the east coast of the South Island, which is expected to        eastern locations for both Islands. April also saw unusually dry soils
have normal rainfall amounts. Nelson/Marlborough are likely to see           for this time of the year, with drought remaining across the northeast
useful rainfall amounts over May.                                            of the South Island. In contrast, April was wet for Fiordland and
                                                                             Westland.
Expect an unusually cold start to May, then temperatures gradually
returning closer to average for the month. Sharp cold snaps are
possible during the month of May as fronts move onto the country
from the Tasman Sea and Southern Ocean. There is a strong signal
for some decent snow events for the South Island alpine areas during
May.                                                                         Soil moisture (Figure 3 & 4)
                                                                             Moderate to heavy rainfall continues to increase soil moisture levels
                                                                             across much of the South Island and has helped ease soil moisture
Further ahead:                                                               deficits (Figure 3). Soil moisture levels are close to or at field
                                                                             capacity along the West Coast, inland Marlborough/Kaikoura, and
Over the next three months (May – July 2020), the prevailing wind            Stewart Island. However, dry conditions remain for the Marlborough,
flow across the country is anticipated to be westerly-quarter (from          Canterbury and Otago regions.
southwest to northwest). Temperatures are likely to be near average

 Figure 2. Outlook for May to July 2020: air temperature (left), rainfall (middle), available soil moisture (right). Source: NIWA.

page: 2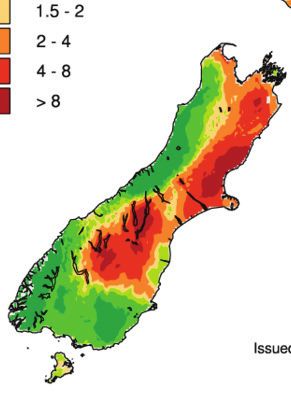
This is somewhat reflected in the soil moisture anomaly map (Figure         beyond, and cause fluctuations in the prevailing trade winds and in
4), The driest soils in the South Island compared to normal for this        the strength of the subtropical high-pressure belt.
time of the year are in Nelson, parts of Banks Peninsula, central           Neutral conditions encourage far more variability in weather patterns
Canterbury and Clutha. Meanwhile, the wettest soils for this time of        for New Zealand, whereas El Niño or La Niña tend to have more
the year are found in northern Canterbury and Kaikoura.                     predictable patterns. Neutral weather patterns can lead to some
                                                                            extreme conditions – with snow following record-breaking warm
According to NIWA’s Drought Index (NZDI), meteorological drought            temperatures, and an increased number of fires one week followed by
or dry conditions are no longer found widespread across the                 gale force winds and floods the next.
South Island. Small pockets of dry soils persist in parts of Nelson,
Marlborough, Christchurch and Central Otago.                                Although ENSO events have an important influence on New
                                                                            Zealand’s climate, they account for less than 25% of the year to
                                                                            year variance in seasonal rainfall and temperature. Under Neutral
                                                                            conditions, other climate factors play stronger roles in influencing
Grass growth & curing:                                                      New Zealand’s weather. For the next three months, the warmer than
During the autumn months, grasslands will transition from a straw           normal coastal water temperatures will be a key driver of our weather.
colouration back to green (low curing values). For some parts of the
country undergoing bouts of rainfall, it’s not uncommon to see green
grass growth under dry vegetation. This can help reduce or halt a
fire’s spread (depending on the amount). Cold snaps and snow can
also increase the chance of frost curing in grasslands. Any dead
grass remaining can still contribute to fires either by: (1) racing along
the tops of grasses in places experiencing a dense/continuous cover
of dry grass; or (2) creeping slowly in green grass that contains a
dead thatch layer underneath. The influence of thatch is particularly
important when the current season has curing values around 30%-
50%. In the absence of thatch, grasslands would not necessarily be
able to sustain fire spread. Typical fire behaviour in these grasslands
will produce very small flame heights, be smoky, patchy in its
progression and low intensity.

Depending on where you are in the country, grass curing could be
patchy over a series of paddocks/area, especially during the 40-80%
curing period. Or if you have experienced summer droughts, curing
will have become more continuous in the dry phase of 70-100%
curing. Environmental factors (humidity, temperature and wind) will
determine whether a fire will start easily and/or spread with curing
levels above 80%.

For areas that are still experiencing high curing values, wildfires
burning under these high grass curing conditions can spread very
quickly, produce large to very tall flame heights (2 m+), be very           Figure 3. Soil moisture deficits as of 06/05/2020.
intense and much more difficult to suppress. Some areas would               Source: NIWA.
also have experienced abundant grass growth over the last month,
increasing the fuel loading.                                                Note: Soil moisture deficit means the amount of water needed to bring the
                                                                            soil moisture content back to field capacity, which is the maximum amount
                                                                            of water the soil can hold.
The finer details:
Grassland curing will affect fire behaviour in several ways: it increases
the amount of dead material present and affects fuel moisture content.
The result is an increased chance of fire ignition, fire intensity and
rates of spread. The moisture content of fine grass fuels (as well as
pine litter and other fine fuels) also dramatically affects the ignition
potential and ability of a wildfire to spread. High amounts of moisture
increase the heat and thermal conductivity of fuel, so that more heat
is required for the fuel to reach its ignition temperature. As grasses
cure, and become drier, less heat is required to ignite and sustain a
fire.

In partially cured grasslands, enough dead fuel needs to be present
to ignite and sustain fire spread. Surrounding green grass with higher
fuel moisture contents will require substantial heat input to burn off
excess moisture and ignite. If there is not enough heat to ignite the
greener sections of the grass, fire spread will either be very patchy
or not spread at all. Burning under these conditions will produce very
small flame heights, be low intensity and easily suppressible.

It is often necessary to part the current season’s grass to examine
how much thatch is underneath. Even if a paddock has been
harvested or grazed, there is often a couple centimetres of dead
grass remaining.

                                                                            Figure 4. Soil moisture anomaly as of 06/05/2020.
What does neutral ENSO mean for NZ?                                         Source: NIWA.
New Zealand’s climate is influenced by two key natural cycles: the          Note: Soil moisture anomaly means the difference between the historical
El Niño-Southern Oscillation (ENSO) and the Interdecadal Pacific            normal soil moisture deficit (or surplus) for a given time of year and actual
Oscillation (IPO). Both these operate over the Pacific Ocean and            soil moisture deficits.

                                                                                                                                                  page: 3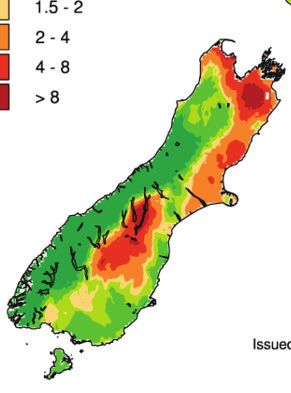
FWI values
     Low
Moderate
     High
Very high
 Extreme

                     April 2020                                   May 2019                                       May 2015

BUI values
    Low
Moderate
    High
Very high
 Extreme

                    April 2020                                    May 2019                                       May 2015

ISI values
     Low
Moderate
    High
Very high
 Extreme

                    April 2020                                    May 2019                                       May 2015

 Figure 5. Current Monthly Average for the:   Figure 6. Average Monthly values of: Fire Weather Index (top), Buildup Index (middle) and
 Fire Weather Index (top), Buildup Index      Initial Spread Index (below); and during the 2018/19 (left) & 2014/15 Neutral years following
 (middle) and Initial Spread Index (below).   a previous Neutral year (right).

      page: 4
DC values
     Low
Moderate
    High
Very high
 Extreme

                    April
                    April 2019
                          2020                                   May 2019                                     May 2015

DMC values
     Low
Moderate
    High
Very high
 Extreme

                   April 2020                                    May 2019                                    May 2015

FFMC values
     Low
Moderate
    High
Very high
 Extreme

                   April 2020                                    May 2019                                     May 2015

Figure 7. Current monthly average for the:   Figure 8. Average monthly values of: Drought Code (top), Duff Moisture Code (middle) and
Drought Code (top), Duff Moisture Code       Fine Fuel Moisture Code (below); and during the 2018/19 (left) & 2014/15 Neutral years
(middle) and the Fine Fuel Moisture Code     following a previous Neutral year (right).
(below).
                                                                                                                          page: 5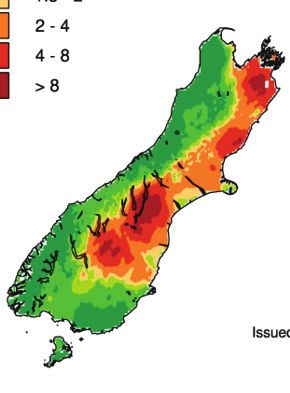
Forest Fire Danger
     Low
Moderate
     High
Very high
 Extreme

                      April 2020                                May 2019                                      May 2015

Grass Fire Danger
    Low
Moderate
    High
Very high
 Extreme

                     April 2020                                  May 2019                                     May 2015

Scrub Fire Danger
     Low
Moderate
    High
Very high
 Extreme

                     April 2020                                  May 2019                                     May 2015

Figure 9. Current Monthly Average for the:   Figure 10. Average Monthly values of: Forest Fire Danger (top), Grassland Fire Danger
Forest Fire Danger (top), Grassland Fire     (middle) and Scrub Fire Danger (below); and during the 2018/19 (left) & 2014/15 Neutral
Danger (middle) and Scrub Fire Danger        years following a previous Neutral year (right).
(below)
      page: 6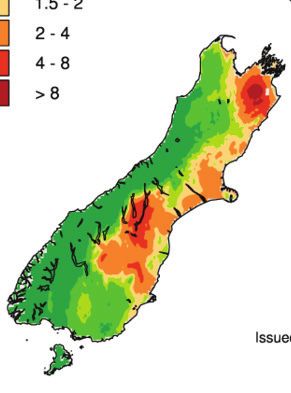
September              October             November              December                January              February                 March                  April                  May

          2013 - 2014
          2014 - 2015
          2018- 2019
                                                                                                                                                                                                          Low

                                                                                                                                                                                                      Moderate

                                                                                                                                                                                                          High
                                                                                                                                                                                                      Very high
                                                                                                                                                                                                       Extreme

          2019 - 2020
                Figure 11. New Zealand Fire Season Severity (monthly)

page: 7
                The years of 2013/14, 2014/15, 2016/17, 2017/18, and 2018/19 were Neutral years followed by a Neutral phase, and are ideal comparisons for what New Zealand might experience over the next few months.
                DSR values of less than one equate to low fire behaviour potential, 1-3 moderate fire potential, 3-7 high to very high fire potential, and above 7 extreme fire behaviour potential.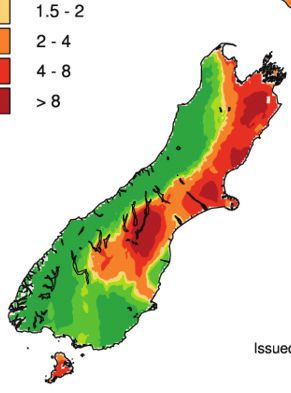
Note:
 The purpose of these monthly outlooks is to provide a heads up on              Tracking trends
 the progression of fire danger as we transition from spring to summer          Comparisons of fire dangers for individual indicator stations for different
 and, later, into autumn. It aims to forewarn fire agencies of current          regions are not shown in this outlook due to the low fire danger and
 and potential fire danger conditions that can be used as a prompt for          severity across the country. As fire dangers increase, more detailed
 local and regional discussions on fire potential (which depends on fuel        regional outlooks will recommence highlighting where Buildup Index
 conditions (i.e. grass curing), risks of ignitions, recent fire history and    (BUI), Drought Code (DC) and Cumulative Daily Severity Rating (CDSR)
 fire management resources available in an area, as well as climate             values sit in comparison with previous fire seasons.
 and fire weather). Continue your pre-planning (if you haven’t done
 so already), by discussing where conditions are at, where they are             For fire managers who are interested in tracking fire season trends for
 heading, and how this can drive awareness about what this might                all your weather stations, the graphs are available monthly on the Scion
 mean for fire risk in your patch and for your neighbours.                      Rural Fire Research website. If tracking is required on a more frequent
                                                                                basis (as opposed to the monthly analysis done here), please contact
                                                                                Scion for the data.

Background info on FWI codes and indicies:
Fine Fuel Moisture Code (FFMC)                    Duff Moisture Code (DMC) A rating of the            Drought Code (DC) A rating of the average
An indicator of the relevant ease of              average moisture content of loosely                 moisture content of deep, compact,
ignition and flammability of fine fuels.          compacted organic soil layers (duff/                organic soil layers, and a useful indicator
                                                  humus) of moderate depth, and                       of seasonal drought effects on forest
0 - 74         Difficult                          medium-sized woody material                         fuels and amount of smouldering in deep
                                                                                                      duff layers and large logs.
75 - 84        Moderately easy                      0 - 10         Little mopup needs
85 - 88        Easy                                                                                     0 - 100       Little mopup needs
                                                    11 - 20        Moderate
89 - 91        Very easy                                                                                101 - 175     Moderate
                                                    21 - 30        Difficult
92 +           Extreme easy                                                                             176 - 250     Difficult
                                                    31 - 40        Difficult & extended
                                                                                                        251 - 300     Difficult & extended
                                                    41 +           Difficult & extensive
                                                                                                        301 +         Difficult & extensive

Buildup Index (BUI)                                Initial Spread Index (ISI) Combines the              Fire Weather Index (FWI)
Combines the DMC and DC, and                       effect of wind speed and the FFMC,
represents the total amount of                                                                          Combines the ISI and BUI to indicate
                                                   providing a numerical rating of                      the potential head fire intensity of a
fuel available for combustion.                     potential fire spread rate.                          spreading fire (on level terrain).
 0 - 15        Easy control                         0-3             Slow rate of spread
                                                                                                          0-5           Low fire intensity
 16 - 30       Not difficult                        4-7             Moderate fast
                                                                                                          6 - 12        Moderate
 31 - 45       Difficult                            8 - 12          Fast
                                                                                                          13 - 20       High
 46 - 59       Very difficult                       13 - 15         Very fast
                                                                                                          21 - 29       Very High
 60 +          Extremely difficult                  16 +            Extremely fast
                                                                                                          30 +          Extreme

Daily Severity Rating (DSR) A numerical rating of the daily fire weather severity at a particular station, based on the FWI. It
indicates the increasing amount of work and difficulty of controlling a fire as fire intensity increases. The DSR can be
averaged over any period to provide monthly or seasonal severity ratings.

Monthly Severity Rating (MSR) is the average of the DSR values over the month. DSR and MSR captures the effects of
both wind and fuel dryness on potential fire intensity, and therefore control difficulty and the amount of work required to
suppress a fire. It allows for comparison of the severity of fire weather from one year to another.
  0-1      Low fire behaviour potential
  1-3      Moderate fire potential
  3-7      High to very high fire potential
  7+       Extreme fire behaviour potential

 Acknowledgements:
 Fire Danger interpretation was from information gathered from the  Front Cover Image:
 Average Monthly Maps for: Severity Rating, FWI, BUI, ISI, DC, DMC, 2020 Research Burns (V Clifford, Scion).
 FFMC. These maps were obtained from the Fire and Emergency
 New Zealand’s Fire Weather System powered by Eco Connect.
                                                                    If you are keen to submit a weather and fire related photo
 Information on the Expected Climate Outlook was gathered from:     that will appear on the front page, please email:
 •    MetService, Rural Monthly outlooks:                           •    a high resolution image(s)
      www.metservice.com/rural/monthly-outlook                      •    with details on the location and the photographer’s
 •    NIWA, Seasonal Climate outlook:                                    name and organisation
      www.niwa.co.nz/climate/sco                                    •    to: Veronica.Clifford@scionresearch.com
 •    Australian Bureau of Meteorology Climate outlooks
      http://www.bom.gov.au/climate/ahead/?ref=ftr

  page: 8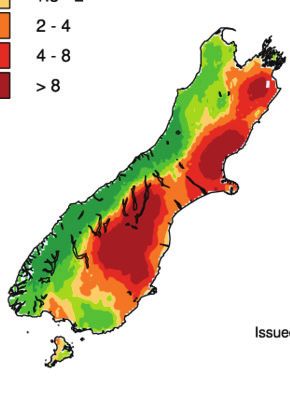
You can also read