VISA EUROPE'S LONDON 2012 OLYMPIC AND PARALYMPIC GAMES EXPENDITURE AND ECONOMIC IMPACT REPORT - REALISING A GOLDEN OPPORTUNITY
←
→
Page content transcription
If your browser does not render page correctly, please read the page content below

REALISING A GOLDEN OPPORTUNITY:
VISA EUROPE’S LONDON 2012
OLYMPIC AND PARALYMPIC
GAMES EXPENDITURE AND
ECONOMIC IMPACT REPORT
National and Regional Economic Impacts
June 2012
CONTENTS

1:   INTRODUCTION, SUMMARY AND CONCLUSIONS    Page 1

2:   METHODOLOGY                              Page 6

3:   THE IMPACT OF THE GAMES IN 2012          Page 8

4:   THE POTENTIAL LEGACY IMPACTS POST-2012   Page 14
1
1: INTRODUCTION, SUMMARY
    AND CONCLUSIONS
EXECUTIVE SUMMARY
1.1	Visa’s 26 year history as a global sponsor of the Olympic Games as well as its intelligence on
     consumer spending patterns at other major sporting events make it uniquely placed to examine
     the scale and magnitude of expected spending during this summer’s London 2012 Olympic and
     Paralympic Games.

1.2	This report builds on the previous expenditure and economic impact report published by Visa Europe
     in June 2011, using updated spending figures and also examining the regional impacts of The Games
     outside of London.

1.3	The London 2012 Olympic and Paralympic Games will have a significant positive economic impact
     on the UK, both in the immediate and medium term. In the seven-week period from the start of
     the Olympic Games to the end of the Paralympic Games, the UK will benefit from an immediate
     spending injection of £804 million. This will result in a £1.2 billion increase in economic activity
     over the period. This represents a 7% increase on equivalent figures from the 2011 report, reflecting
     both the use of 2011 prices and reflecting underlying trends in the scale and pattern of overseas
     visitor expenditure that is evident from examination of 2010 and 2011 data.

1.4	The report also considers the longer term economic impacts of the London 2012 Games and finds
     that the UK as a whole can expect to benefit from a total economic stimulus worth £4.12 billion
     from 2013-15.

IMMEDIATE ECONOMIC IMPACTS DURING
LONDON 2012
1.5	The main source of additional spending will be the expected large-scale net increase in overseas
     visitor spending in the UK over the period of The Games. Over the seven-week period, international
     visitors are expected to spend a total of £749 million in the UK, representing an approximately 18%
     increase on the baseline level of spend that would be expected if The Games were not taking place in
     2012.

Table 1-1: Financial and Economic Impacts during London 2012 (7-week period)

Increase in consumer spending (domestic and international)                    £804 million

Increase in economic output (UK)                                              £1,210 million

Source: SQW

                                                                                                             2
1.6 In terms of domestic consumer spending, a net £54 million increase in UK consumption
expenditure is expected. This increase is expected to be largely driven by the public’s enthusiasm
and appetite for The Games, evidenced by high demand for tickets and high levels of interest in
pre-Games events such as the Olympic Torch Relay. Many UK residents are expected to switch
from traditional patterns of consumer spending by getting into the Olympic spirit by stocking up on
supplies and entertaining at home.
1.7 While a substantial proportion of this increased spending is expected to take place in London, there’s
good news for the rest of the UK too, with areas across the UK benefiting from increased expenditure
which will in turn result in significant economic impacts across the regions. In total, the rest of the UK
will benefit from £694 million increase in economic activity over the seven-week Games period.
Table 1-2: Expected 2012 Increases in Expenditure and Economic Activity across Regions
Region 7-week spend (£ millions) Economic activity (£ millions)
East Midlands 17.3 38.0
East of England 29.9 106.3
London 546.4 516.0
North East 7.4 19.7
North West 7.5 58.1
South East 87.8 174.2
South West 36.5 93.3
West Midlands 16.6 45.0
Yorkshire/Humber 12.7 43.0
Scotland 22.0 80.9
Wales 13.1 21.8
Northern Ireland 6.3 13.8
UK 803.6 1,210.2
3IMPACTS BY SECTOR
1.8 Overall, the principal winners from the increase in spending in sector terms are expected to be:
• High Street retailers: £210 million
• the Hotels sector: £138 million
• Supermarkets: £88 million
• the Entertainment, food and drink industries: £46 million
• the Travel sector (airlines, car hire, etc.): £46m
EXPECTED POST-GAMES IMPACTS:
2013-2015
1.9 As well as the immediate impacts during The Games period itself, the report also considers the
legacy impacts: the potential for The Games to generate additional international visitor spending and
associated economic activity in 2013 and beyond.
1.10 Medium term impacts (over the period 2013-2015) are expected to show benefits distributed across
the country as the profile of the UK as a whole is enhanced in the eyes of foreign visitors:
Table 1-3: Medium Term Impacts resulting from London 2012 (2013-2015)
Average increase in spending per year £914 million
Total increase in spend: 2013-2015 £2,741 million
Average increase in economic output per year £1,374 million
Total economic stimulus 2013-2015 £4,122 million
Source: SQW
1.11 The overall increase in economic output delivered by The Games by 2015 – including the period of
The Games itself – is expected to be a £5.33 billion increase compared to the hypothetical scenario
where the event did not take place.
41.12 The expected annual legacy impacts across UK regions, by 2015, in terms of net additional spending
and additional economic activity are expected to be as follows:
Table 1-4: Games Legacy: expected net increase in visitor spending and economic activity, in 2015,
by region/nation (£m)
Region Visitor spending (£ millions) Economic activity (£ millions)
East Midlands 39.5 89.4
East of England 59.2 125.0
London 286.0 303.7
North East 24.7 46.4
North West 78.9 136.7
South East 152.9 204.8
South West 64.1 109.8
West Midlands 59.2 105.9
Yorkshire/Humber 54.2 101.1
Scotland 78.9 116.7
Wales 24.7 51.2
Northern Ireland 24.7 32.5
UK 946.9 1,423.1
Source: SQW
52: METHODOLOGY
PURPOSE OF THE REPORT
2.1 The purpose of this report is to assess the magnitude of international visitor and domestic spending
and the likely economic effects of the increase in expenditure that is expected to occur during and
following the London 2012 Olympic and Paralympic Games.
2.2 The analysis considers the expected economic impacts in the following ways:
• for the UK as a whole, during the seven-week period over which the Olympic and Paralympic
Games will be held
• the same analysis, disaggregated across the 12 standard UK regions/nations
• the legacy impacts for the three-year period 2013-2015 following The Games, both for the UK as a
whole and disaggregated across the 12 standard UK regions/nations.
2.3 The analysis assesses the impacts in terms of both expected increases in consumer expenditure
and the additional value of broader economic activity (i.e. economic output) that this is expected to
stimulate.
2.4 The report builds on an SQW report prepared in 2011 which focused on assessing the economic
impacts of the London 2012 Games period and the 2013-2015 legacy, but from a national perspective
only. This report both updates and extends that work to consider in addition the regional impacts as
well. The report has been updated to include the most recent full year consumer spending data from
Visa Europe.
SOURCES OF DATA
2.5 Visa Europe provided SQW with domestic and visitor expenditure data for other sporting ‘mega-
events’ that have been held globally over the recent past, including the Beijing 2008 Olympics
Games, the Vancouver 2010 Olympic Games and the 2010 FIFA World Cup™ in South Africa.
2.6 This was used to develop assumptions regarding the potential scale of gross expenditure change
during and after The Games. The data was also used to estimate the shares of expenditure gains that
would likely be experienced as a result of The Games across the various sectors of the economy. In
addition, the data was utilised to assess the potential for displacement in domestic spending as a
result of ‘expenditure switching’ by domestic consumers in favour of Games-linked spending at the
expense of other types of discretionary spending.
2.7 To provide a baseline assessment of likely underlying domestic and international visitor expenditure in
the UK in 2012, Visa also provided a detailed breakdown of card-based expenditure for the equivalent
7-week period in 2010 and 2011. This data was then grossed up to provide estimates of all sources of
domestic and visitor consumption expenditure (that is, covering all means of payment) using market
share information supplied by Visa.
2.8 Assumptions regarding the value of output multipliers are based on SQW’s extensive work in
assessing tourism activity across the UK for both public and private sector clients. The specific values
used in the model are set out in an Appendix to this report [page 20].
2.9 Output multipliers are used in this study to assess the potential impacts of the London 2012 Olympic
and Paralympic Games on the UK economy. The rationale is that a major stimulus to an economy
such as that brought about by a large influx of consumer spending will have significant downstream
impacts on industries that supply goods and services to businesses serving the needs of international
visitors and domestic consumers.
62.10 Assumptions regarding the regional breakdown of visitor expenditure were sourced from a series of
studies and analysis undertaken by the Office for National Statistics that have considered the regional
and sub-regional value of international and domestic tourism and the patterns of visitor spending in
the UK.1
2.11 All financial values in this report are in 2011 prices.
1
ONS: The Economic Importance of Tourism: May 2011
ONS: The Sub-regional Value of Tourism in the UK, October 2011
ONS: The Supply Side of Tourism Report, 2009: February 2012
7 Economic and Labour Market Review: The Economic Impact of Tourism Across Regions and Nations of the UK, May 20103: THE IMPACT OF THE
GAMES IN 2012
3.1 This chapter of the report assesses the expected economic effects of Games-related spending by
international visitors and domestic consumers during the period of The Games in the summer
of 2012.
3.2 The Olympic Games open on 27th July 2012, although some events – such as football – commence
on 25th July. The Games close on 12th August 2012. The Paralympic Games start on 29th August
2012 and conclude on 9th September 2012.
3.3 To cover the whole period of the two sets of Games we have considered the potential changes in
Games-related expenditure over a seven-week period from late July to mid-September 2012. To
assess the impacts of the Olympic Games only, we also assessed potential changes over a shorter
3-week period from late July to mid-August.
3.4 To establish a baseline we were supplied with detailed expenditure data from Visa Europe covering
the equivalent period of weeks in the UK in both 2010 and 2011. The Visa data was broken down
across 20 expenditure categories, ranging from airline tickets to utility bills. These categories were
then in some cases amalgamated to provide a consolidated list of 15 expenditure categories that form
the basis of the analysis in this report.
3.5 We were also supplied with confidential market share data to allow the data for spending on Visa
cards to be converted into estimates for all consumer spending (Visa and non-Visa) over the same
period. For example, in the UK, £1 in every £3 is spent by consumers is on a Visa card.
3.6 We were also supplied with Visa Inc. expenditure data covering domestic and international visitor
expenditure both before and during other sporting ‘mega-events’ that have taken place elsewhere
over the period since 20062. These events included:
• the Torino 2006 Winter Olympic Games
• the Beijing 2008 Olympic Games
• the Vancouver 2010 Winter Olympic Games
• the 2010 FIFA World Cup in South AfricaTM
3.7 This data was used to establish a reference case covering the likely scale and pattern of domestic
consumer and international visitor expenditure in London compared to a hypothetical situation where
The Games were not taking place. This provided us with a baseline position – termed the reference
case – against which potential future changes in scale and pattern of expenditure brought about by
The Games can be measured.
THE REFERENCE CASE
3.8 The reference case provides a hypothetical estimate of the levels of domestic consumer and
international visitor spending in Britain that would be expected during the period of The Games if The
Games were not being held. It therefore provides a baseline against which the predicted Games-
related changes can be measured.
3.9 The reference case was developed by converting Visa’s UK expenditure data for the equivalent period
of summer 2011 into spend estimates over The Games period from late July to mid-September 20123.
2
The ‘before’ data was for the equivalent period in the year prior to the event being held. This allowed an appropriate
comparison of ‘before and during domestic and international visitor spend for that event so that the overall increase in
spending as a result of the event could be estimated. 83.10 The estimated value for average weekly overall domestic consumer spending over the relevant period
in summer 2012 was just over £3.8 billion4. Average weekly spending by international visitors was
estimated at just over £150 million per week over the same period.
EXPENDITURE DURING THE OLYMPIC AND
PARALYMPIC GAMES
3.11 The modelling of the anticipated changes in Games-related expenditure was informed by analysis of
observed changes in expenditure patterns at a number of major recent sporting events, including the
2010 FIFA World CupTM and the most recent Olympic and Paralympic Games and Winter Games.
3.12 This was based on detailed expenditure data provided by Visa Inc. for the weeks when these events
were being held, together with appropriate benchmark information from equivalent periods prior to
those events taking place.
3.13 The numbers in the table below represent the net additional uplift in UK consumption expenditure that
is expected to occur during the period of The Games, both for a 7-week and a 3-week period. The net
increase compares two scenarios: a ‘with Games’ scenario compared to the situation that is expected
under a ‘without Games’ reference case.
Table 3-1: Expected Net increase in Expenditure, 2012
Type/origin of spend (£ millions)
Seven week period (late July to mid-September)
Domestic consumers 54.3
International visitors 749.3
Total 803.6
Three week period (late July to mid –August)
Domestic consumers 6.8
International visitors 655.3
Total 662.1
Source: SQW
3
The data from Visa included expenditure on consumer debit, credit, pre-paid and commercial cards.
4
All of the figures in this chapter are expressed in 2011 prices.
9Seven-week period
3.14 The net uplift over the seven-week period is expected to be £804 million. This comprises an increase
in expenditure from international visitors of £749 million, and a net increase of £54 million from
domestic UK consumers.
3.15 All of this estimated increase in expenditure is above and beyond the reference case (that is, the
hypothetical situation in 2012 if The Games were not being held). Moreover, the reference case
takes account of the normal summer increase in tourism-related visits and expenditure in London, as
observed by examining Visa data for 2010 and 2011. The expected £804 million increase in spending,
therefore, is wholly additional to what would occur even if The Games were not being held.
3.16 The size of the expected overall net increase in spending from UK consumers (£54m) is to an extent
muted by displacement. This reflects the recognised practice of ‘expenditure switching’, whereby
increased spending on Games-related activities by domestic consumers is likely to be compensated
for by reduced amounts of spending on non-Games related leisure and entertainment activities during
The Games period. For example, cinema visits by domestic consumers may decline while The Games
provides several weeks of at home entertainment. Patterns of expenditure switching observed in
spending patterns on Visa cards by domestic consumers in Canada and South Africa during the most
recent Winter Olympics and FIFA World CupTM events respectively assisted in the development of
assumptions regarding likely spend switching by UK consumers during the London 2012 Games.
3.17 The results of the model also include an allowance for diversion and displacement effects, reflecting
an assumption that there is expected to be an increase in overseas tourism by UK residents during
the period of The Games that would not have occurred had The Games not been held in the UK in
2012.
3.18 There are potentially several aspects to diversion and displacement by UK residents:
• domestic tourists and day trip visitors who might otherwise have visited London may be deterred
by the fear of congestion and higher prices
• in a similar way, business trips to London by domestic travellers may be deferred
• expenditure switching, as domestic spectators and at-home viewers re-allocate their disposable
incomes towards Games-related purchases and away from other types of discretionary spend
including alternatives forms of leisure
3.19 Moreover, this latter type of expenditure switching behaviour benefits some categories of spending –
notably supermarkets – but potentially disadvantages others, such as DIY retailing.
Three-week period
3.20 Over the three-week period the net increase is expected to be £662 million, including an uplift of £655
million in international visitor spending. The reason for the smaller expected increase in net domestic
spending compared to the seven-week period is that the shorter period of assessment excludes the
‘lagged spending’ effect. That is, some spending on non-leisure items is expected to be deferred
during the period of the Olympic Games (in order to fund Games-linked leisure spend) and is
expected to recover during the four-week period following the conclusion of the Olympic Games. The
three-week period, on the other hand, does not provide sufficient time for this spending to recover.
10Regional impacts on consumer expenditure
3.21 The estimation of regional impacts of Games-related changes in domestic and international
expenditure – both gross and net (i.e. taking into account displacement) – were developed using
ONS data on the baseline contribution of domestic and international tourism to the UK economy
and its constituent regional parts. For example, the baseline contribution of tourism spending ranges
from just over 5% for the East Midlands up to 8.9% for the South West: for London the equivalent
proportion is 8.2%.
3.22 We also reviewed evidence from previous Games on the potential for increases in visitor spending
outside of the host city and its immediate hinterland to other regional areas in host countries. Finally,
we reviewed evidence on expenditure switching by domestic consumers from host countries hosting
mega events such as Olympics and FIFA World CupsTM.
3.23 The table below presents the results of the detailed regional breakdown of the expected increases
in international visitor and domestic consumer expenditure over the three-week and the seven-week
periods respectively.
Table 3-2: Regional breakdown of expected consumption expenditure increases (£m)
Region 7-week spend Contribution to 3-week Contribution to
(£ millions) Total (%)millions) spend Total (%)
East Midlands 17.3 2.2% 11.6 1.8%
East of England 29.9 3.7% 21.9 3.4%
London 546.4 68.0% 481.7 74.1%
North East 7.4 0.9% 4.4 0.7%
North West 7.5 0.9% 6.1 0.9%
South East 87.8 10.9% 63.6 9.8%
South West 36.5 4.5% 26.2 4.0%
West Midlands 16.6 2.1% 11.3 1.7%
Yorkshire/Humber 12.7 1.6% 8.0 1.2%
Scotland 22.0 2.7% 15.1 2.3%
Wales 13.1 1.6% 8.3 1.3%
Northern Ireland 6.3 0.8% 4.0 0.6%
UK 803.6 100.0% 650.2 100.0%
Source: SQW
3.24 It can be seen from the table that London can be expected to experience of greatest share of the
anticipated net increase in consumer expenditure. Over the three-week period London can be
expected to capture 74% of net additional aggregated visitor and domestic spend: this is expected
to amount to £482 million over the three-weeks. Over the longer seven-week period, net additional
spending for London is expected to grow to £546 million, although this represents a smaller
proportion (68%) of the anticipated overall increase in spending.
113.25 Also for the seven-week period, the regions such as the South East (£88m) and South West (£36m)
are also expected to experience significant net increases in consumer spending.
3.26 It is notable that no UK region is expected to experience a net decrease in consumer spending over
either the three-week or the seven-week periods, even when the potential for displacement impacts
are factored in, as they are in the results that are set out above.
OUTPUT IMPACTS
3.27 The next step was to assess what impact the expected changes in expenditure over the period of The
Games would have in terms on aggregate demand in the economy. This involved deploying output
multipliers to estimate the strength and direction of indirect and induced effects across all sectors
of the economy. The specific assumptions used in this report are set out in a table appendix to this
report.
3.28 Over the seven-week period the expected net increase in economic output is expected to be £1,210
million. Over three weeks it is expected to be slightly under £1 billion. The seven-week estimate is
equivalent to around 3.5% of the increase in the overall value of economic output that is expected to
be generated in the UK during 2012. The expected breakdowns by sector are summarised in the table
below.
Table 3-3: Estimated Net Change in Economic Output associated with the London 2012 Games (£m)
Expenditure Categories 3 weeks 7 weeks
Airlines 23.6 28.9
Car hire 18.4 21.3
Cash 287.6 330.4
Entertainment 55.6 71.3
Food and drink 4.1 6.7
Health 4.9 7.1
High street retailers 252.5 323.9
Hotels 181.5 209.9
Insurance 9.9 11.4
Miscellaneous 19.5 27.6
Motoring 2.8 6.9
Petrol 3.0 15.6
Supermarket 130.9 136.3
Travel 10.2 13.0
Total 998.9 1,210.2
Source: SQW
123.29 The results of our analysis of economic output impacts are in line with other recent research and
commentary with respect to the potential impact of the London 2012 Games. For example, the World
Travel & Tourism Council have highlighted The Games are likely to contribute to a £1 billion increase
in tourism GDP in the UK compared to 2011, and a recent report by Moody’s highlighted that the main
beneficiaries are likely to be the hotels, retail and consumer products sectors.
Regional impacts on output
3.30 As well as the regional distribution of net additional consumer expenditure, we have also estimated
the expected net additional increase in economic output that is anticipated, above-and-beyond the
levels that would be expected if The Games were not being held. The table below sets out the results
both for the seven-week period of analysis, but the pattern of distribution is very similar for the three-
week period also.
Table 3-4: Regional breakdown of expected economic output increases (£m)
Expenditure Categories 7-week period Contribution to the total (%)
East Midlands 38.0 3.1%
East of England 106.3 8.8%
London 516.0 42.7%
North East 19.7 1.6%
North West 58.1 4.8%
South East 174.2 14.4%
South West 93.3 7.7%
West Midlands 45.0 3.7%
Yorkshire/Humber 43.0 3.6%
Scotland 80.9 6.7%
Wales 21.8 1.8%
Northern Ireland 13.8 1.1%
UK 1,210.2 100.0%
Source: SQW
3.31 The results of the assessment are that producer output can be expected to increase by £516m in
London as a consequence of The Games being held. This is equivalent to a 43% increase over and
above the level that would be expected if The Games were not being held.
3.32 The increases for the other regions range from 1.1% (Northern Ireland) to 14.4% (South East).
134: THE POTENTIAL LEGACY
IMPACTS POST-2012
4.1 This chapter considers the post-2012 benefits of The Games in generating additional expenditure and
output for the UK and its regions/nations.
4.2 The potential for sustained economic impacts following the conclusion of a major event such as an
Olympic and Paralympic Games has been noted by most of the studies that have considered the
impacts on other hosting cities. The origin of this phenomenon – often termed the ‘legacy’ effect, is
driven by the raised international profile of the host city and country, by concentrated international
media exposure and the benefit of ‘word of mouth’ recommendations from visitors returning to their
country of origin.
4.3 In modelling the potential legacy impacts we have considered the years 2013-2015 only. We consider
that a diminution of the legacy phenomenon (in terms of stable levels of expenditure attributable to
the events of 2012 from 2016 onwards) is plausible, as the memory of the event begins to fade and
other events (such as the 2014 FIFA World CupTM and Rio 2016 Olympic Games) inevitably compete
for media attention and visits from sports fans and other tourists.
EXPECTED INCREASES IN VISITOR
EXPENDITURE
4.4 As with the analysis for the period of the Olympic and Paralympic Games in the previous Chapter,
the starting point is to consider the potential impacts on visitor expenditure. Based on our previous
model, but focusing on net additional increases in overseas visitors’ spending (so ignoring the
spending from UK consumers), our analysis is based on an assumed average increase of 1.8% above
trend in the immediate post-Games year (i.e. in 2013), with decreasing rates of increases over the
following two years (1.6% in 2014 and 1.3% in 2015).
4.5 The results of the modelling are that the net additional increases in annual visitor expenditure over
the period 2013-2015 would rise from around £861 million in 2013 to £947 million in 2015, and would
therefore amount to some £2.74 billion over the three year period.
4.6 These figures are the estimated uplifts compared to situation that would be expected to exist in those
years under the reference case – that is, had the London 2012 Games not taken place. Moreover, as
the reference case also includes normal summer increases in international visitor expenditure, these
estimates are also wholly additional to the usual seasonal increments.
4.7 The expected increase in international visitor expenditure is equivalent to a rise of around 18% in
tourist spending compared to the levels that would be expected to occur had the London 2012
Games not taken place. Again, these estimates are in addition to normal seasonal uplift effects.
4.8 The following table sets out the expected distribution of the anticipated increase in spending across
spending categories. The biggest beneficiaries in sector terms are expected to be High Street
Retailers and Hotels.
14Table 4-1: Games Legacy: Expected Net Increases in Visitor Expenditure 2013-2015 (£m)
Expenditure Categories 2013 2014 2015
Airlines 24.1 26.2 26.5
Car hire 17.7 19.2 19.5
Cash withdrawals 255.1 276.9 280.5
Entertainment 48.8 53.0 53.7
Food and drink 4.7 5.1 5.2
Health 6.7 7.3 7.4
High St Retailers 244.4 265.3 268.7
Hotels 159.2 172.8 175.0
Insurance 10.5 11.4 11.6
Miscellaneous 26.0 28.3 28.6
Motoring 6.7 7.2 7.3
Petrol 14.0 15.2 15.4
Supermarket 32.4 35.2 35.6
Travel 10.9 11.8 11.9
Total 861.1 934.7 946.9
Source: SQW
15Regional impacts
4.9 Compared to the economic impact during The Games period itself, the expenditure impacts over the
following three years are expected to be much more evenly spread across the UK regions
and nations.
4.10 The table below presents the expected distribution by region of net additional visitor expenditure for
the years 2013 through to 2015.
Table 4-2: Games Legacy: net increase in visitor spending 2013-2015, by region/nation (£m)
Region/Nation Visitor spending (£m) Contribution to the Total (%)
East Midlands 114.3 4.2%
East of England 174.5 6.4%
London 828.5 30.2%
North East 71.9 2.6%
North West 213.6 7.8%
South East 442.8 16.1%
South West 185.7 6.8%
West Midlands 168.4 6.1%
Yorkshire/Humber 157.1 5.7%
Scotland 243.6 8.9%
Wales 73.6 2.7%
Northern Ireland 68.7 2.5%
UK 2,742.7 100.0%
Source: SQW
16ECONOMIC OUTPUT
4.11 Next, we converted the forecasts for net additional visitor expenditure into estimates for future
increases in economic output. These estimates are presented below.
Table 4-3: Expected Increases in Economic Output and Incomes, 2013-2015 (£m)
Economic Benefit 2013 2014 2015
Output 1,294 1,405 1,423
4.12 Thus, by 2015 the London 2012 Games are expected to have delivered an annual stimulus worth
£1.42 billion per annum in additional economic output to the UK economy compared to the situation
had The Games not taken place. This expected increase is attributable to additional international
visitor spending generated by the additional profile and reputation of London and the UK as a visitor
destination compared to what would be expected had The Games not taken place.
Regional impacts
4.13 As was the case for visitor expenditure, the expected legacy impacts in terms of economic output
over the three years following The Games are expected to be much more evenly spread across the
UK regions and nations.
4.14 The table below presents the expected distribution of anticipated additional economic output
generated over the 2013-2015 period as a result of London 2012 legacy visitor spending impacts.
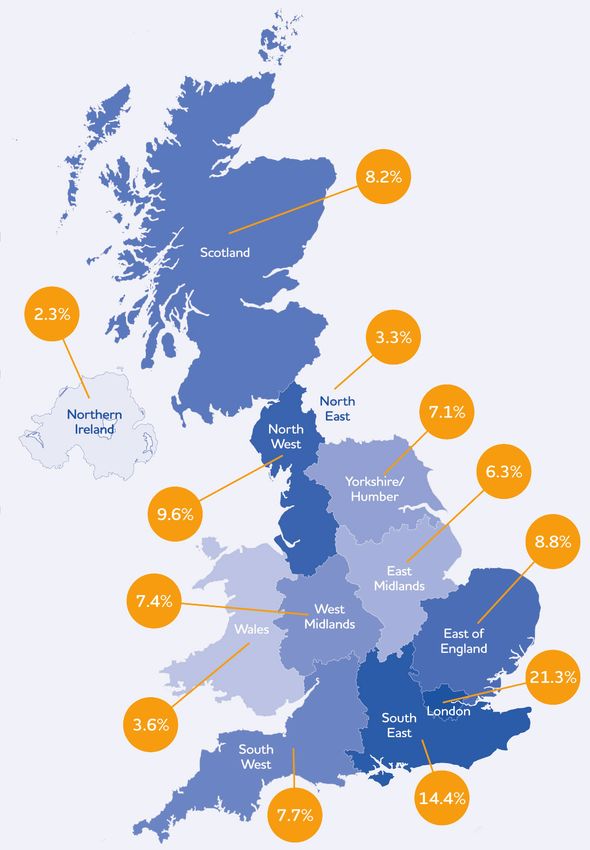
Table 4-4: Games Legacy: net increase in economic output: 2013-2015, by region/nation (£m)
Region/Nation Output (£m) (%)
East Midlands 258.9 6.3%
East of England 362.0 8.8%
London 879.7 21.3%
North East 134.5 3.3%
North West 395.9 9.6%
South East 593.2 14.4%
South West 318.0 7.7%
West Midlands 306.7 7.4%
Yorkshire/Humber 292.8 7.1%
Scotland 338.1 8.2%
Wales 148.3 3.6%
Northern Ireland 94.3 2.3%
UK 4,122.2 100.0%
Source: SQW
174.15 Although London is the largest single regional beneficiary over the 2013-2015 period (£880m, 21.3%),
the shares enjoyed by other regions range from 2.3% (Northern Ireland) to 14.4% (South East).
The total amounts of additional economic output in non-London regions/nations range from £94m
(Northern Ireland) to £593m (South East) over the same period (2013-2015).
4.16 Although London will continue to receive the largest single regional share (21.3%) this is a
significantly lower proportion than is expected to be the case during The Games period itself (i.e.,
74% over the 3-week period, and 68% over the 7-week period). The proportionate increases for the
other regions are greater as a result.
18ABOUT VISA EUROPE
In Europe, there are 445 million Visa debit, credit and commercial cards. In the 12 months ending
September 2011 those cards were used to make purchases and cash withdrawals to the value of €1.7
trillion. 14% of consumer spending at point of sale in Europe is with a Visa card, and almost 80% of that is
on Visa debit cards.
Visa Europe is owned and operated by more than 3,700 European members and was incorporated in July
2004. Visa Europe is independent of global Visa Inc., with an exclusive, irrevocable and perpetual licence in
Europe, while both companies operate to ensure global interoperability. As a dedicated European payment
system Visa Europe is able to respond quickly to the specific market needs of European banks and their
customers - cardholders and retailers - and to meet the European Commission’s objective to create a true
internal market for payments.
Visa enjoys unsurpassed acceptance around the world. In addition, Visa/PLUS is one of the world’s largest
global ATM networks, offering cash access in local currency in over 200 countries.
For more information, visit www.visaeurope.com
19ANNEX A: MULTIPLIER ASSUMPTIONS
Table A-1: Output multipliers used in this report
Output multipliers5
Airlines 1.39
Car hire 1.39
Cash withdrawals 1.49
Entertainment 1.70
Food and drink 1.70
Health 1.24
High St retailing 1.48
Hotels 1.52
Insurance 1.24
Miscellaneous 1.37
Motoring 1.39
Petrol 1.39
Supermarket 1.54
Travel 1.39
5
The values for output multipliers in this table are expressed per £1 of additional consumer spending 20You can also read