Visitor Insights 2018 - SURF COAST SHIRE
←
→
Page content transcription
If your browser does not render page correctly, please read the page content below
SURF COAST SHIRE

Visitor
Insights
2018
                   1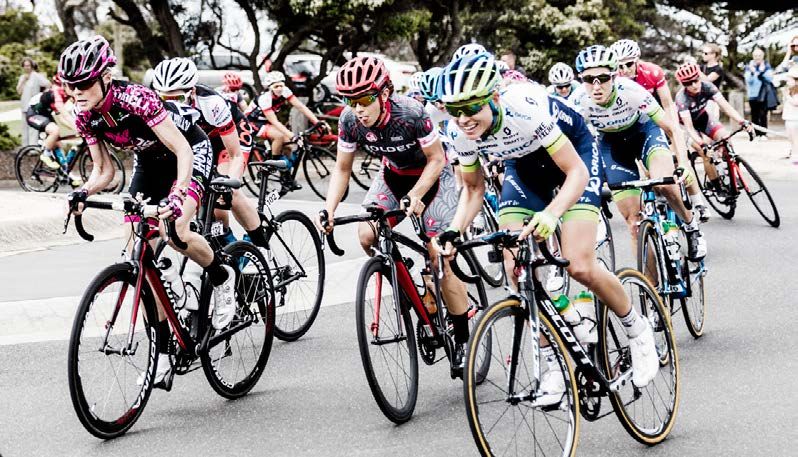
Contents     Purpose of report                       3
             Introduction                            4
             Summary of Visitors to the Surf Coast   5
             Total Travel to the Surf Coast          6
             Regional Competition                     7
             Domestic Day Visitor Profile            8
             Domestic Overnight Visitor Profile      9
             International Visitor Profile           10
             Visitor Information Centres             12
             Sub-Region Profiles                     13
             Events                                  14
             Digital Visitation                      15
             Future Visitation                       16

           Domestic overnight
visitors spend the      most money
per day      in the Surf Coast

                        2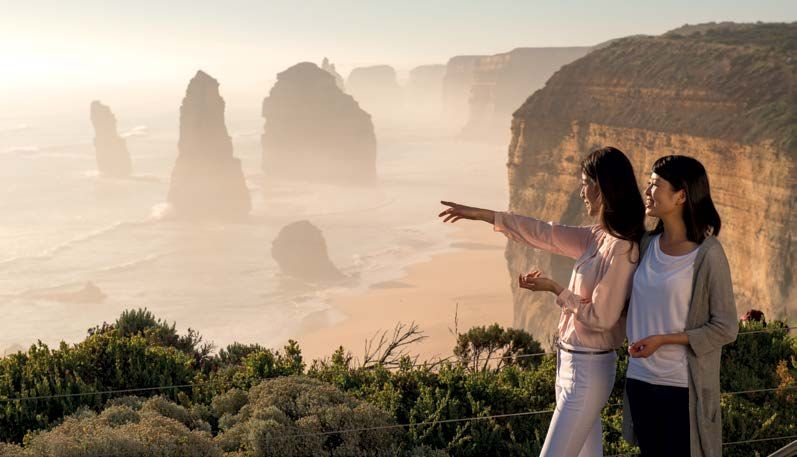
Purpose of report
This Visitor Insights report presents key statistics and information about
tourism visitation to the Surf Coast Shire in 2017

It provides a range of visitation data including visitor       Surf Coast Data Regions
expenditure, numbers, popular activities, profiles
                                                               Statistics presented in this document are based on
and patterns for the shire as well as an overview of
                                                               areas determined as Statistical Area Level 2 (SA2) and
total visitation to the Surf Coast and several key
                                                               Statistical Area Level 3 (SA3), by Australian Statistical
destinations including Torquay, Lorne and Anglesea
                                                               Geography Standards (ASGS). SA2s and SA3s are
and the Surf Coast Hinterland.
                                                               the geographical areas utilised by Tourism Research
Data is provided by Tourism Research Australia,                Australia as well as ABS.
a branch of Austrade. Tourism Research Australia
                                                               The ASGS brings all the regions for which the ABS
is Australia’s leading provider of quality tourism
                                                               publishes statistics to one framework and is used for
intelligence across both international and domestic
                                                               the collection and dissemination of geographically
markets.
                                                               classified statistics. It provides a common framework
This publication can be used to provide information to         of statistical geography and enables the production of
businesses to assist in the development of plans, the          statistics which are comparable.
community, investors and developers on the current
                                                               Specific data sets used include:
tourism capacity in Surf Coast Shire and to identify
opportunities for investment in the municipality.              • Torquay (SA2)
                                                               • Winchelsea (SA2)
                                                               • Lorne – Anglesea (SA2)
                                                               • Western (SA3)

                                                           3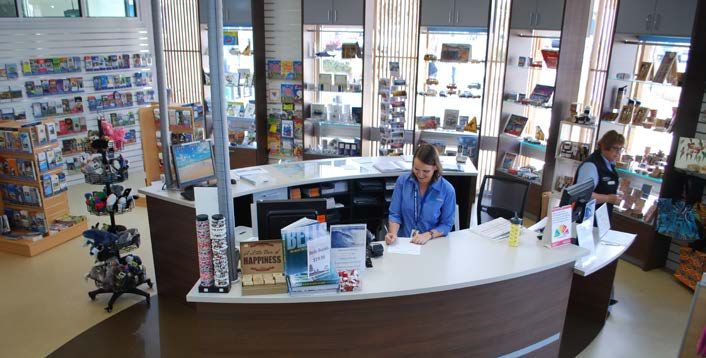
Introduction
Surf Coast Shire: Tourism engine room of the Great Ocean Road

The Surf Coast Shire is located in south-western                 After factoring in all other forms of indirect
Victoria, 1.5 hours from Melbourne’s CBD and                     expenditure, over $683 million were injected by
20 minutes south of Geelong’s CBD. It is a tourism               tourism into the local economy. In terms of value
region renowned for its beaches, natural attractions,            add activity the Tourism sector contributes over
events and outdoor activities.                                   $90 million annually to Surf Coast Shire while
                                                                 accounting for 15.2 per cent of total employment
As a distinctly different economy to that of Geelong
                                                                 (Surf Coast’s largest employment sector).
and surrounding regions, the tourism and surfing
sectors playing a key role. The Surf Coast economy               Strong population growth will see a need to create
supports over 3,000 businesses which drive an                    approximately 3,000 additional jobs by 2031 in a shire
economy estimated to be over $1.3 billion annually.              where some 87 per cent of all businesses employ four
                                                                 or less people. Many of these jobs will come from the
Tourism attracts more than 2.1 million visitors
                                                                 tourism sector.
directly expending over $430 million during 2017.
It is estimated that over $42 million in wages and
salaries is attributed to tourism in Surf Coast each year.

          Tourism attracts               more than
                                2.1 million visitors
                 directly expending over $430m
                                     during 2017

                                                             4
Summary of Visitors
                                                                        to the Surf Coast
                                                                        The Surf Coast region received an estimated 2.1 million total
                                                                        visitors to the year end December 2017. The region received
                                                                        over 2.7 million overnight visitor nights during the same period
                                                                        with a direct expenditure of $433 million. Compared to 2016
                                                                        numbers are down but nights are up.

                                               TOTAL TRAVEL

           2.13m                                 2.7m      $433.8m
          visitors                          visitor nights  spend
                     10%                                          6%                                          2%

                                                     VISITOR TYPE

          Domestic Day                            Domestic Overnight                                International

    1.1 million                 22%              1.9 million                  7%             0.1 million                  15%

                    –                            2.4 million                  2%             0.3 million                  79%

    $95.2 million               22%              $310 million                 2%             $28.6 million                79%

Note: Although the data shows a large decrease in the number of domestic day visitors and a large increase in international
visitor nights, the data indicates to a 95% confidence level that this is not a statistically significant change. Numbers may not
exactly match the total travel figures due to rounding.

                                                                  5
Total Travel to the Surf Coast
Five Year Visitor Trend
       3,000                                                                                                                   $500
                                                                                             $442.43           $433.78
                     $384.37                                        $366.67
       2,500                             $362.79                                                                               $400
       2,000
                                                                                                                               $300

                                                                                                                                       $ Million
’000

       1,500
                                                                                                                               $200
       1,000
                                                                                                                               $100
        500
                  1,678   2,446       1,785      2,170          1,857        2,195        2,375   2,547     2,128    2,699
          0                                                                                                                    $0
                      2013                2014                      2015                      2016              2017

                                                     Visitors           Nights           Spend

                A five year trend of visitation to the Surf Coast Shire shows that:
                        Visitors               Nights              Expenditure
                                  27%                                            10%                           13%

Average daily spend per visitor                                              Visitation by quarter
Visitor type:                                                                Spring and Summer are the most popular seasons to
                                                                             visit the Surf Coast. Most people (38%) visit in between
Day trip		                             $84
                                                                             January to March. October to December is the second
Domestic Overnight                    $127                                   most popular time to visit 27%.
International		                       $111
                                                                             Oct-Dec
Domestic overnight visitors spend the                                        27%                                               Jan-March
most money per day in the Surf Coast.                                                                                               38%
Source: Tourism Research Australia Local Government
area profiles 2016, Surf Coast. Data is based on a four                      July-Sept
year average from 2013-2016.                                                 19%                                               April-June
                                                                                                                                      17%

Type of visitor by %
Most of the visitors to the Surf Coast are day trippers (53%).
However, 71% of the tourism expenditure is from domestic overnight visitors.

               Type of visitor (%):                             Spend per type
                                                                 of visitor (%):
                                       2%                                                   7%

                                      44%
                                                                                           71%

                                      53%
                                                                                                          International
                                                                                          22%
                                                                                                          Domestic Overnight
                                                                                                          Day Trip

                                                                         6
Regional Competition
            Surf Coast market share of the Great Ocean Road
            Tourism on the Surf Coast compared to the Great Ocean Road:

                                                                                           In comparison to the Great Ocean Road,
            Total Expenditure                   65%                         35%
                                                                                           the Surf Coast receives:
                   Total Nights                 62%                        38%             40% of all visitation
                   Total Visitors               60%                        40%
                                                                                           38% of all nights
                                                                                           35% of all expenditure
                                    0%   20%          40%      60%         80%    100%
                                                                                           Only 23% of international overnight visitors
                                            Great Ocean Road         Surf Coast            to the Great Ocean Road stay overnight in
                                                                                           the Surf Coast.

            Victorian Tourism Region Comparison Analysis
            In 2017, the Great Ocean Road region received the seventh highest level of domestic overnight and day trip visitation in
            regional Victoria. If the Surf Coast was a tourism region, it would show a similar level of visitation as Phillip Island (2.3m).
            Domestic Day and Overnight Visits by tourism region:

                                                               #4 Murray
                                                                 5.6m
                                                                                     #1 Melbourne
                                                                                         26.7m

#11 Grampians
2.4m                                                                                                                                   #9 High Country
                                                                                                                                                 3.4m
#3 Goldfields
6.2m                                                                                                                                   #6 Yarra Valley &
                                                                                                                                     Dandenong Ranges
#10 Daylesford &                                                                                                                                  5.3m
Macedon Ranges
2.6m

#8 Geelong &
The Bellarine
5.1m                                                                                                                  #5 Gippsland
                                                                                                                           5.4m         #12 Phillip Island
                                                                                                                                                  2.3m

                #7 Great
                Ocean Road
                5.1m                                                                                       #2 Mornington
                                                                                                               Peninsula
                                                                                                                  6.8m
                                         #13 Surf Coast
                                         2.1m

                                                                             7
Domestic Day Visitor Profile
Surf Coast Day Trip Trend 2013-2017:
Visitors (’000)
1,443.9
1,113.1
1,059.0 1,064.1
901.6 Income
$85,000-$99,999 29%
$100,000-$114,999 25%
2013 2014 2015 2016 2017 Favourite activities
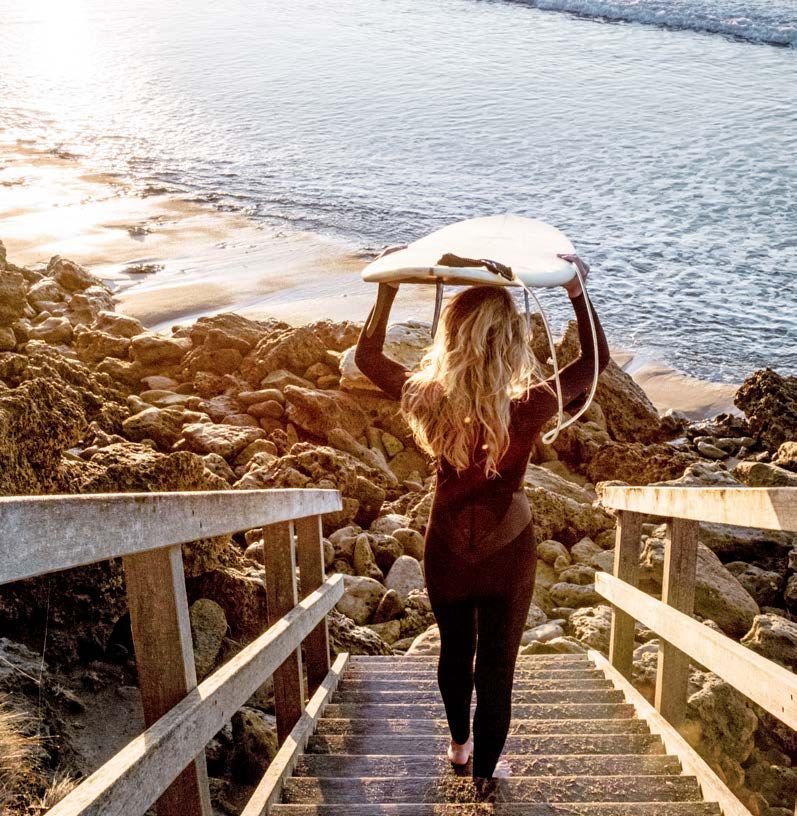
Go to the beach 37%
Eat out at a restaurant and/or café 30%
The Surf Coast received 1.133 million day trip visitors in 2017. While this is down by
Sightseeing/looking around 14%
22% from 2016, the five year trend shows an increase of 26%. Day trip visitors spent Visit friends & relatives 8%
$95.2 million in the Surf Coast last year. This represents 22% of total visitor expenditure. Go shopping for pleasure 6%
Surfing 6%
Reason for trip
Holiday 78%
Who am I? I am a domestic day visitor... Visiting friends & relatives 12%
Business 5%
Other reason 4%
My favourite things to do are Favourite day to visit
I earn around I mainly come to find
going to the beach (37%), Sunday 31%
$100,00 per year that holiday feel (78%).
eating out (30%) and exploring Saturday 30%
and have a budget My friends and family
new places with friends Monday 9%
of $84 to spend draw me back (12%). Thursday 9%
(22%). Sometimes I like to go
for the day. Tuesday 9%
shopping or surfing (6%). Wednesday 7%
I'm most likely to be in Friday 5%
my mid 20s-30s (46%). Favourite month to visit
January 25%
And to have a partner
November 12%
I work full time or (59%). I may have a child March 11%
part time (77%). under five (17%). August 9%
October 8%
December 7%
February 6%
I love to head down to April 5%
the Surf Coast in January September 5%
(25%). March (11%) and May 4%
July 4%
November (12%) are June 3%
pretty good too. I don’t
Age group
like to come in June (3%). 55+ 24%
30-34 18%
20-24 15%
I'm most likely to come from Geelong. 25-29 14%
I may come from the surrounding area 45-49 7%
Most of the time I come on
the weekend (61%). Sometimes (Bellarine, Colac, Ballarat, Werribee, Employment status
Ocean Grove, Colac or from Melbourne Working full time 50%
I like to come around on Monday Working part time 27%
or Thursday (9%). I don’t like (Brunswick, Essendon, St Kilda,
Retired or on a pension 18%
to visit on Friday (5%). Williamstown, South Yarra).
8Domestic Overnight Visitor Profile
The Surf Coast received 945,000 domestic overnight Domestic Overnight Visitor Trend 2013-2017:
visitors in 2017, an increase of 7% on 2016 and 26%
2,319.4 2,402.7 2,440.6
over the last five years. Overnight stays increased by 2,062.8 2,099.8
2% on 2016 and 5% average growth over the last five
887.0 945.0
’000
years. The average length of stay has dropped from 750.3 694.6 753.3
3.1 nights to 2.6 nights in five years. These visitors
spent $309.95m last year and represent 71% of all
2013 2014 2015 2016 2017
expenditure on the Surf Coast.
Nights Visitors
Who am I? I am a domestic overnight visitor...
I most likely to earn I come by car (93%)
My favourite things to do over $130k+ and I and I’m most likely to
are going to the beach, have a budget of $127 stay for 1-2 nights. I am 40 years or
eating out, catching up with per day to spend. older and I work full
friends and exploring the
time or part time.
shops and outdoors.
January is my favourite
time to visit (13%) or any time I prefer private over commercial
up to Easter (43%). October is accommodation. This is usually my
pretty good too. I like to go back holiday house, a friend’s or one in the
home on a Sunday or sometime family. When I choose commercial
around the weekend. accommodation, I like to rent a house,
apartment or 4-5 star hotel (54%).
Although I have kids,
they’re a bit older now
(6-15 years) and when I come for a holiday
I visit to the Surf Coast and to catch up with
they don’t always come. friends and family.
Income Accommodation preference Age group
$55k-$130k 40% Private 52% 55+ 33%
$130k + 44% Commercial 47% 20-24 13%
Note: 21% earn over $200k Commercial accommodation preference 50-54 11%
Purpose of visit Rented house or apartment 40-44 9%
Holiday 69% (not serviced daily) 29% Travel party type
Visiting friends and relatives 23% Luxury hotel or resort (4 or 5 star) 25% Adult couple 31%
Business 7% Standard hotel/motor inn (< 4 star) 14% Friends or relatives travelling
Other reason 1% Caravan park – cabin 13% together (without children) 27%
Top 10 activities Preferred transport to the region Travelling alone 17%
Go to the beach 71% Private vehicle or company car 93% Family group (parents & children) 15%
Eat out at a restaurant or café 61% Length of stay Day of week returned from trip
Visit friends & relatives 34% 2 nights 39% Sunday 40%
Sightseeing 33% 1 night 30% Monday 14%
Go to Pubs, clubs 24% 3 nights 14% Saturday 13%
Bushwalking 22% 4 nights 6% Friday 11%
Visit national parks 17% 5 nights 4% Wednesday 8%
Go shopping for pleasure 16% Tuesday 7%
Employment status
Surfing 12% Thursday 6%
Working full time 46%
Go to markets 9%
Working part time 25%
Retired or on a pension 17%
Studying 7%
9International
Visitor Profile
The Surf Coast received 50,300 visitors in 2017, an increase
of 15% from 2016. Since 2013, there has been 95% growth in
international visitor nights. This finding is statistically significant
at a 95% confidence level. International visitor nights increased
by 79% from 2016 and by 104% over a five year trend. The
average length of stay has increased slightly from 4.9 to 5.1
nights since 2013. These visitors spent $28,648 last year and
represent only 7% of all expenditure on the Surf Coast.
International Visitor Trend 2013-2017:
258.1
Visitors Nights
144.1
126.8
106.9
95.6
39.7 43.7 50.3
25.9 32.6
2013 2014 2015 2016 2017 2013 2014 2015 2016 2017
I come to the
Surf Coast for
a holiday.
Who am I? I am an international visitor...
I have a budget I'm most likely
I'm most likely to stay in
of $111 to spend to come from
commercial accommodation
I rent a car or each day. China, England or
and when I do I'll usually
campervan to Germany.
choose a hotel below
get around the 4 star or a caravan park.
Surf Coast.
There's a 50/50 chance I haven't I'm most likely to be either
been to Australia before. If I have, over 55 or in my late 20s. I mainly
it's only once or twice. I rely on the travel on my own or with my
internet or word of mouth to plan my partner. I travel independently,
itinerary, look for airfares and book not on a package tour.
accommodation. I fly into Melbourne
when I come. Sometimes Sydney.
My favourite things to do
are eating out, going to
The Surf Coast the beach and sightseeing,
is usually my second shopping and going to
or third place I national parks.
stay overnight.
10Purpose of visit Transport Planning the visit Holiday 87% Rental car 43% Internet 61% Visiting friends & relatives 10% Private vehicle or company car 25% Friend or relative living in Australia 33% Business 2% Self-drive motorhome or campervan 9% Previous visit(s) 21% Employment 1% Note: Only 3% of international overnight visitors come Travel book or guide 21% Education
Visitor Information Centres
The Surf Coast Shire operates four Visitor Information Centres
across the Shire at Torquay, Lorne, Anglesea and Winchelsea

Visitor Centre engagements in 2017:

                              Torquay VIC               Lorne VIC                 Anglesea VIC            Winchelsea VIC
 Walk-in enquiries               67,916                  146,389                      15,966                    1,004
 Phone enquiries                  9,242                       8,817                      –                        –

Torquay and Lorne are fully accredited centres with                The Visitor Centres are also at the front line of changing
salaried staff and volunteers assisting in their operation.        visitor trends. There are emerging changes in visitation
Winchelsea and Anglesea are overseen by staff with                 patterns with some visitors indicating January is too
volunteers providing the daily face to face information            congested and are delaying their visit to February.
service. There are on average 70 volunteers assisting              Anecdotally, March is also being promoted in social
staff each week.                                                   media as an alternative month to travel the Great
                                                                   Ocean Road.
Our Visitor Information Centres are critical in engaging
and inspiring visitors (face to face, phone or email) to           While visitors continue to utilise digital media, there is
stay longer in the Shire and experience more of what               an increasing trend for tourists of all ages to visit our
we have to offer or to provide basic information such              centres to ensure they have the correct information
as directions. The one on one direct engagement                    and/or to hear the local independent perspective.
with a ‘local’ is a highly effective way to enhance and
inform the visitor experience. Feedback from visitors is
consistently very positive and provides direct evidence
of Visitor Centre staff and volunteers increasing visitor
stays and expenditure.

              In 2017 the Visitor Centres
       engaged                         249,334 visitors

                                                              12
Sub-Region Profiles
The following section compares the visitor profile for each of the Surf Coast’s sub-regions using specific data sets
for Torquay, Lorne-Anglesea and the Surf Coast Hinterland.
Lorne-Anglesea Hinterland
Lorne-Anglesea receives the most visitors overall The Hinterland receives the fewest number of visitors
and has the highest number of overnight stays: on average and the highest number of day trips:
Share of visitors to the Surf Coast 54% Share of visitors to the Surf Coast 4%
Visitors on average 1.07m Visitors on average 71.3k
• Day visitors 53% • Day visitors 72%
• Night visitors 45% • Night visitors 27%
• International visitors 2% • International visitors 1%
Torquay Data at this scale is less reliable when looked at in a single
year-figure. To improve the reliability of data, a percentage
Torquay receives the second highest number of
of visitation over a five year average is used.
visitors and more day trips:
Share of visitors to the Surf Coast 42%
Visitors on average 829.1k
• Day visitors 61%
• Night visitors 38%
• International visitors 2%
Total % of visitors by Surf Coast's sub-regions:
Geelong
Hinterland
4%
Winchelsea
Gherang Torquay
42%
Torquay
Anglesea Lorne-Anglesea
54%
Lorne
13Events on the
Surf Coast
Events are a cornerstone of the Surf Coast’s visitor economy,
and play a vital role in making our region a great place to live
and work. Each year, we proudly host over 200 events, festivals
and markets which collectively attract more than 240,000
attendees and provide exposure to a global audience of over
40 million.
200+ events, festivals and markets Events drive growth and enhance
quality of life on the Surf Coast
240,000+ attendees They provide the opportunity to:
Global audience of 40 million+ • Expand the economy
• Increase visitor nights
World-class sporting events: • Provide national and international exposure
• Cadel Evans Great Ocean Road Race • Enhance social and economic wellbeing
• Rip Curl Pro Bells Beach • Build vibrant, connected communities
• Influence off-peak visitation
Mass participation events:
• Amy’s Gran Fondo Business Events and Conferences
• Lorne Pier to Pub – did you know?
• Surf Coast Century • The Great Ocean Road has the 2nd highest
conference delegate visitation in regional Victoria
Music, arts and culture:
(over 13,300 in 2016)*
• Aireys Inlet Open Mic Festival
• Conference delegates spend up to three times more
• Falls Music and Arts Festival
than a leisure visitor.
• Lorne’s Festival of Performing Arts
*Source: Tourism Research Australia.
• Surf Coast Arts Trail
Each year the Surf Coast
region hosts 200+
events,
festivals and markets
14Digital Visitation
Many visitors to the Surf Coast and Great Ocean Road
region use the internet to plan and book their trip
Great Ocean Road Regional Tourism maintain the official tourism destination website, visitgreatoceanroad.org.au
and associated Facebook and Instagram accounts. Below is a summary of digital visitation to these accounts in 2017.
The website has reached a total of 1.18 mllion potential visitors in 2017.
This includes visitors to the following destination websites and social media pages:
Visit Great Ocean Road Website:
Faceook:
1,064,872 unique visitors 33,243 likes
Source: 80% search, 12% typing the web address,
6% referral from another website. 2,712,056 reach
Destination Websites:
Instagram:
I am Torquay
Anglesea Adventure 30,738 53,800 followers
Love Lorne* 2,200,000 reach
*Since December 2017.
Visit Great Ocean Road website
most popular pages
The home page was the most popular page with 27% of Source of Digital Visitors:
all digital visitors going to the home page. Attractions, Social
accommodation and itineraries are in high demand. 2%
Lorne was the only town to feature in the top 10 pages.
Referral
Email
Unique % of total 6%
Top 10 page visits 0%
page views page views
Direct
1. Home Page 288,444 27.09
12%
2. Attractions 68,187 6.40
3. Accommodation 46,385 4.36 Organic
Search
4. Getting Here 45,431 4.27 80%
5. 3 Day Itineraries 26,038 2.45
6. Whale Sightings 19,940 1.87
7. Camping 19,485 1.83
3 Day Itineraries
8. 19,157 1.80
(the essentials)
Towns & Villages Over 80% of visitors found the website via a search
9. 18,335 1.72
(Lorne)
engine. 11.9% typed the web address into their
10. Towns & Villages 16,447 1.54 browser (direct).
15Future Visitation
Tourism Research Australia released Tourism Forecasts When we apply the average annual growth rates in
2017 on 2 August 2017. Overall, the outlook for visitors and expenditure to the Surf Coast, we see that
Australia’s tourism industry for the next few years is by 2027:
positive, influenced by an improving outlook for the • the total number of visitors is expected to reach
global economy. 2.8 million; and
This global growth is underpinned by increasing • visitor expenditure will exceed $583 million.
consumer confidence and an upturn of business In the same period, visitation to the Great Ocean
investment in major advanced economies such as the Road will reach 7.02 million visitors and $1.59 billion
US, Japan, the UK and Canada, and by continued strong in expenditure.
growth in emerging Asian economies like China, India
and Indonesia.
China is set to become our largest
The forecast average annual growth from 2016-2027
international market
for visitors to Victoria is summarised below.
In 2018 China is expected to overtake New Zealand to
Forecast Growth to 2027: become the largest source of international visitors. By
2027, the number of Chinese international visitors will
Domestic Day 2.9% exceed New Zealand (2nd largest market) on a 2:1 ratio.
Domestic Visitors 2.4%
Domestic Nights 2.7% By 2027 the total number of visitors will
International Visitors 6.5% reach 2.8 million and visitor expenditure
International Nights 6.2% will exceed $583 million
Forecast Tourism Visitation and Spend for Surf Coast 2017-2027:
3,000 2,724
2,800 $700,000
2,650
2,578
2,508
2,440
2,500 2,375
2,248
2,310
2,374 $600,000
2,187
2,128 $583,061
$565,830
$549,155
$500,000
Expenditure ($’000)
1,853 $533,018
$517,396
2,000 $502,273
Visitors (’000)
1,786 $487,630
1,678 $473,714
$459,714
$446,410
$442,2811
$433,521 $400,000
1,500 $384,246
$362,686 $366,573
$300,000
1,000
$200,000
500 $100,000
0 $0
2013 2014 2015 2016 2017 2018 2019 2020 2021 2022 2023 2024 2025 2026 2027
Total Visitors Total Expenditure
In 2018 China is set to become our
largest market international
FL_13286
16Economic Development Unit
Council's Economic Development and Tourism Unit
provides a range of reports on the economy and
tourism of the Surf Coast Shire including:
• Economic Snapshot
• Surf Industry Mapping
• Visitor Insights
• Economic Impact of Events
Contact the unit for business support and information.
T: 03 5261 0600
E: business@surfcoast.vic.gov.au
www.surfcoast.vic.gov.au
17You can also read