Estimates of the impact of COVID-19 on global poverty - WIDER Working Paper 2020/43 - unu-wider
←
→
Page content transcription
If your browser does not render page correctly, please read the page content below
WIDER Working Paper 2020/43

Estimates of the impact of COVID-19 on global
poverty

Andy Sumner,1 Chris Hoy,2 and Eduardo Ortiz-Juarez3

April 2020
Abstract: In this paper we make estimates of the potential short-term economic impact of
COVID-19 on global monetary poverty through contractions in per capita household income or
consumption. Our estimates are based on three scenarios: low, medium, and high global
contractions of 5, 10, and 20 per cent; we calculate the impact of each of these scenarios on the
poverty headcount using the international poverty lines of US$1.90, US$3.20 and US$5.50 per day.
Our estimates show that COVID poses a real challenge to the UN Sustainable Development Goal
of ending poverty by 2030 because global poverty could increase for the first time since 1990 and,
depending on the poverty line, such increase could represent a reversal of approximately a decade
in the world’s progress in reducing poverty. In some regions the adverse impacts could result in
poverty levels similar to those recorded 30 years ago. Under the most extreme scenario of a 20 per
cent income or consumption contraction, the number of people living in poverty could increase
by 420–580 million, relative to the latest official recorded figures for 2018.

Key words: global poverty; COVID-19; SDGs; crisis impact
JEL classification: I32

1King’sCollege London, 2Australian National University, 3King’s College London. Corresponding author:
andrew.sumner@kcl.ac.uk
Copyright © UNU-WIDER 2020
Information and requests: publications@wider.unu.edu
ISSN 1798-7237 ISBN 978-92-9256-800-9
https://doi.org/10.35188/UNU-WIDER/2020/800-9
Typescript prepared by Lorraine Telfer-Taivainen.
The United Nations University World Institute for Development Economics Research provides economic analysis and policy
advice with the aim of promoting sustainable and equitable development. The Institute began operations in 1985 in Helsinki,
Finland, as the first research and training centre of the United Nations University. Today it is a unique blend of think tank,
research institute, and UN agency—providing a range of services from policy advice to governments as well as freely available
original research.
The Institute is funded through income from an endowment fund with additional contributions to its work programme from
Finland, Sweden, and the United Kingdom as well as earmarked contributions for specific projects from a variety of donors.
Katajanokanlaituri 6 B, 00160 Helsinki, Finland
The views expressed in this paper are those of the author(s), and do not necessarily reflect the views of the Institute or the
United Nations University, nor the programme/project donors.
1      Introduction

In this paper we make estimates of the potential impact of COVID-19 on global monetary poverty
through per capita household income or consumption contraction. 1 We use three scenarios: low,
medium, and high contractions of 5, 10, and 20 per cent, and estimate the impact on the poverty
headcount using the international poverty lines of US$1.90, US$3.20 and US$5.50 per day
(purchasing power parity (PPP) 2011 prices).

Our estimates have important limitations. First, we have a set of contractions of mean income or
consumption per capita applied to each country. We do not know which of our three scenarios
will be closest to the final real-world outcome, nor how consumption changes will differ across
countries. Second, we assume that the effects of economic contractions are distribution neutral,
and hence they omit the differentiated effects through important transmission channels, chiefly
the labour market. Third, there are other transmission channels from the pandemic to poverty
beyond changes in consumption. Fourth, there are important non-monetary poverty impacts, not
only on health indicators but also on education and other dimensions of poverty not captured in
these estimates of consumption losses. Finally, as Gentilini, Almenfi and Orton (2020) note, many
governments in middle-income developing countries have introduced or adapted social protection
and jobs programmes in response to the crisis, most notably cash transfer initiatives, and hence to
some extent the full impacts of the could be mitigated. These recent policy interventions are not
captured in our estimates.

As far as we know, to date, the only estimates of the poverty impact of COVID-19 in developing
countries across the world are those by the International Labour Organization (ILO) and the
International Food Policy Research Institute (IFPRI).

The ILO (2020: 5) estimates are focused on the working population and argue that there will be
between 9 and 35 million new working poor (at the higher World Bank poverty line of US$3.20
per day) in developing countries in 2020. Most will live in middle-income developing countries.
These estimates draw on the computable general equilibrium (CGE) model of McKibbin and
Fernando (2020).

IFPRI estimates, by Vos, Martin and Laborde (2020a, 2020b) make use of the IFPRI’s own global
CGE model. 2 Their estimates are based on about 30 household surveys mainly from Sub-Saharan
Africa and South Asia and show that a global gross domestic product (GDP) slowdown of
1 percentage point would increase poverty (at the lower World Bank poverty line of US$1.90 per
day) by between 14–22 million people. Somewhat counterintuitively, most of these (two-thirds)
are rural dwellers. And the greatest impact will be in sub-Saharan Africa (SSA) where up to half of
the new poor will live.

1
 We refer to income or consumption as some countries have income data and others have consumption data in the
PovcalNet dataset.
2 Specifically, as described in Ivanic and Martin (2018), a combination of two datasets: the first of trade, production,
and consumption for private households, governments and firms, plus parameters describing trade, production, and
consumption behaviour. The second is a sample of 300,000+ households from 31 developing countries with
information on household consumption and agricultural production. With the first dataset and the CGE model they
have, they identify the long-run effects of a number of productivity shocks on national income and prices. Then, they
apply the country-level productivity and price shocks to the 300,000+ household-level models in the second dataset
to simulate the poverty implications of the aforementioned productivity shocks.

                                                           3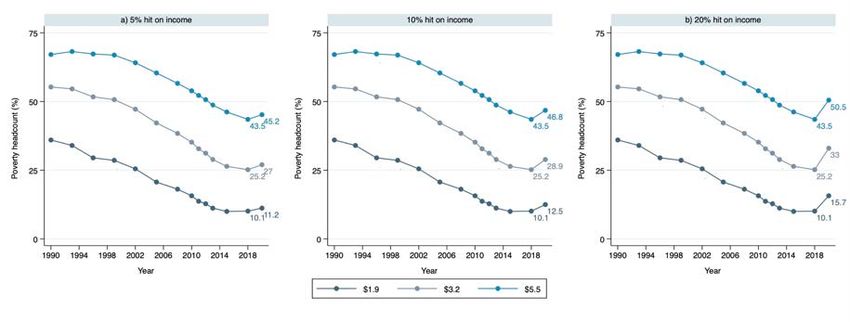
The ILO and IFPRI estimates are both derived from complex CGE models that estimate how
supply and demand shocks, output contractions or changes in trade or production factors feed
through to poverty.

In contrast to ILO and IFPRI estimates we make new estimates in this paper of the impact of
COVID-19 on global poverty in the short-run due to direct consumption shocks.

Our paper is structured as follows. Section 2 discusses our data and assumptions. Section 3
presents findings. Section 4 concludes.

2        Data and assumptions

We make new estimates of the short-run effects of COVID-19 on the global poverty count.

We considered a set of contractions to household per capita consumption and asked what these
could mean for global poverty at the international poverty lines of US$1.90, US$3.20, and US$5.50
per day.

These estimates are based on microdata from the World Bank’s PovcalNet dataset and were
computed through the Stata’s PovcalNet interface (see discussion of Castañeda et al. 2019) at the
global and regional levels using 2018 as the reference year for these aggregates—with the only
exception of South Asia for which the survey coverage is too low and thus the reference year for
this region is 2015 instead. 3

The PovcalNet dataset has the advantage of a higher coverage (than IFPRI and ILO estimates) in
terms of the number of countries. Further, the data includes the whole population of each country
in the dataset. Specifically, the PovcalNet dataset is composed by approximately 1,500 country-
year harmonised household income or consumption survey data covering 138 developing
countries and 26 high-income economies, with all monetary data expressed in PPP exchange rates
from the 2011 International Comparison Program.

Our estimates are made using three scenarios of per capita income or consumption contraction
(depending on the data of the country) as a result of the ongoing COVID-19 pandemic: 5, 10, and
20 per cent contraction. As we do not observe individuals’ income or consumption levels from
PovcalNet’s built-in database, we capture aforesaid contractions by increasing the value of the
poverty line accordingly. That is, for a per capita income or consumption contraction of x per
cent, the poverty line z is adjusted upwardly as z /(1 – x). The three scenarios are performed for
the US$1.9, US$3.2, and US$5.5 per day poverty lines.

3        Short-term impact of COVID-19 on global poverty

Everything else equal, even a relatively small contraction in per capita income or consumption of
5 per cent as a result of the COVID-19 pandemic, could lead to an increase in the incidence of
income-based poverty for the first time since 1990 (Figure 1).

3
    Estimates using 2015 as the reference year for all regions and globally are shown in Tables A3 and A4 in the Annex.

                                                            4
Figure 1: Global poverty headcount ratio, 1990–2018 and projection

Source: authors’ estimates based on PovcalNet.

Under such contraction of 5 per cent and relative to the latest available year (2018), the poverty
headcount rate at US$1.9/day could increase by 1 percentage point, whereas that at US$3.2/day
and US$5.5/day could do so by between 1.5–2 percentage points. In the case of a 10 per cent
income or consumption contraction, the rise in the poverty headcount rates could range between
2–4 percentage points depending on the poverty line, while in the most extreme scenario—that is,
an income contraction of 20 per cent— the increase in poverty could be close to 6 percentage
points for the US$1.9/day poverty line, and between 7 and 8 points for the US$3.2/day and
US$5.5/day poverty lines, respectively (Table 1: panel A).
Table 1: Additional global poverty as a result of per capita income or consumption contractions

Source: authors’ estimates based on PovcalNet.

These potential increases would be equivalent to reversing almost a decade of progress in global
poverty reduction, as the projected headcount rates, ceteris paribus, would return back to the levels
observed in first half of the 2010s. In absolute terms, these changes mean that the number of
people living in poverty in the world could increase, in comparison to the status quo in 2018, by
between 85–135 million under a 5 per cent contraction, by between 180–280 million under a 10

                                                        5
per cent contraction, and, startlingly, between 420–580 million people under a per capita income
or consumption contraction of 20 per cent (Table 1: panel B). 4
The impact of these contractions could occur in all regions of the world, though with some degree
of heterogeneity depending on their level of development. Focusing on a contraction of per capita
income or consumption of 10 per cent , the poverty headcount rates could increase for the first
time since 1990 in East Asia and Pacific (EAP), Latin America and the Caribbean (LAC), and
South Asia (SA), and for the first time since the mid-1990s in Europe and Central Asia (ECA),
Middle East and North Africa (MENA), and SSA. While the increase in the incidence of the
US$1.9/day poverty is relatively low in EAP, ECA, and LAC, that of the US$5.5/day poverty is
more sizeable and would imply a reversal towards the levels observed five years ago across these
regions. A similar reversal could occur in SA, although it could be more pronounced for lower
poverty lines and more moderate for the higher line of US$5.5/day (Figure 2).
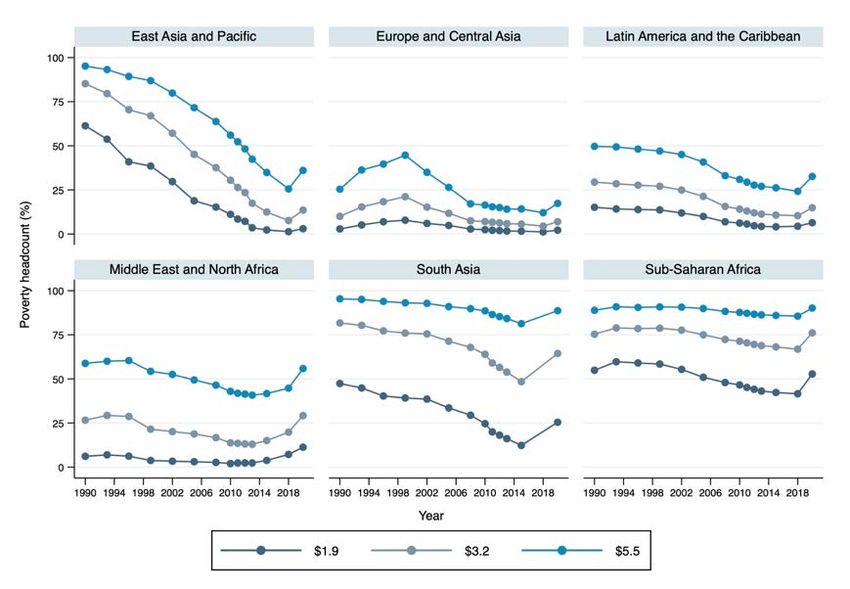
Figure 2: Poverty headcount ratio by regions, 1990–2018 and projection under a 10% per capita income or
consumption contraction
Source: authors’ estimates based on PovcalNet. See Figures A1 and A2 in annex for 5% and 20% contraction.
Especially hard-hit regions in estimates are MENA, SA, and SSA, either because of their relatively
slow progress in reducing poverty over the last years or because of their already high poverty levels.
In MENA, for instance, a 10 per cent contraction could exacerbate the rising trend in poverty
observed since 2013 up to reaching as high as, worryingly, the levels observed in 1990—at least
for both the US$1.9/day and US$3.2/day poverty lines. Similarly, in SSA, a potential 10 per cent
contraction in income or consumption is enough to erase the progress achieved in reducing
4
The poverty headcount rates and absolute numbers of poor under the US$1.90, US$3.20 and US$5.50 per day
(PPP 2011 prices) for the 2018 reference year and the three contraction scenarios, disaggregated by region, are
shown in Tables A1 and A2 in the Annex.
6extreme poverty in recent years. These results are even more dramatic when considering the
scenario of a 20 per cent contraction (Figure A2 in the Annex).
According to our estimates of a 10 per cent contraction and under the US$1.9/day poverty line,
between 80 and 85 per cent of those newly living in poverty would be located in two regions,
namely, SSA and South Asia. When using the US$3.2/day poverty line, still about two thirds of
the new world’s poor would be residing in these two regions, but East Asia and Pacific would
account for around 20 per cent of the total (Figure 3).
Finally, if poverty is measured with the US$5.5/day poverty line, the proportion accounted for by
EAP would dramatically increase, accounting for almost 40 per cent of the total new poor, whereas
the combined share in SSA and South Asia would reach about a third of total. At this value of the
poverty line, both MENA and Latin America could account each for about 10 per cent of the
global increase in poverty, regardless of the magnitude of the economic contraction. Table A2 in
the Annex presents the number of poor people by region under the three contraction scenarios,
relative to the latest observed poverty incidence in 2018.
Figure 3: Distribution of additional number of poor by region and contraction scenario
Source: authors’ estimates based on PovcalNet.
4 Conclusions
In this paper we have sought to make estimates of the potential short-term poverty impact of
COVID-19 in developing countries. While these estimates have important limitations as they are
based on distribution neutral assumptions and crucially omit labour market, social and fiscal policy,
and household-level responses to economic contractions, they are intended as indicative of the
potential increase in poverty as a result of the damaging economic consequences of the pandemic.
We find that:
7• Everything else equal, assuming a 5 per cent contraction in per capita incomes, the world
could witness a potential increase in the number of poor people, relative to the 2018 figures,
of more than 80 million for the US$1.9/day poverty line, of more than 130 million for the
US$3.2/day standard, and of almost 124 million for the higher line of US$5.5/day.
• Under a contraction of 10 per cent , while keeping everything else equal, the increases in
poverty headcount at US$1.90, US$3.20 and US$5.50 is respectively, about 180, 280, and
250 million people, but if the contraction is 20 per cent, then the increases could be about
420, 580, and 520 million people, respectively.
• At the global level, the potential impact of COVID-19 poses a real challenge to the UN
Sustainable Development Goal of ending poverty by 2030 because increases in the relative
and absolute size of the number of poor under the three poverty lines would be the first
recorded since 1990 and they could represent a reversal of approximately a decade of
progress in reducing poverty. In regions such as the Middle East and North Africa and SSA,
the adverse impacts could result in poverty levels similar to those recorded 30 years ago, in
1990.
• The concentration of the potentially new poor under the US$1.9/day and US$3.2/day
poverty lines would occur in the poorest regions of the world, notably in SSA and South
Asia, which could accrue together between two thirds and 80–85 per cent of the total poor.
• For the higher poverty line of US$5.5/day, the majority (about 40 per cent ) of the new poor
could be concentrated in East Asia and Pacific, about a third in both SSA and South Asia
combined, and about 10 per cent each in Middle East and North Africa and Latin America
and the Caribbean.
While these welfare impacts of the COVID-19 pandemic could be overestimated, there is no doubt
that the real outcomes will be dramatic across developing countries. There is also no question,
based on the evidence of previous global crises, that non-monetary indicators such as infant and
maternal mortality, undernutrition and malnourishment, and educational achievement would also
be seriously hit. The severity of the effects will depend on how long the pandemic lasts, and on
how the national governments and the international community reacts.
The policy reactions some national governments have started to exhibit are of paramount
importance to relief those without employment insurance, access to health services, and systems
of care—for example those performing jobs in precarious, informal sectors of the economy across
developing countries. Under these circumstances, the current pandemic calls for international
efforts to assist those countries that do not have the fiscal space to face this global problem, not
only in terms of addressing the ongoing challenge imposed by COVID-19 on their health systems'
capacity, but also to protect those for whom their income generating possibilities are on-hold.
References
Castañeda Aguilar, R.A., C. Lakner, E.B. Prydz, J. Soler Lopez, R. Wu, and Q. Zhao (2019).
‘Estimating Global Poverty in Stata. The povcalnet command’. Global Poverty Monitoring
Technical Note 9. World Bank: Washington DC.
Gentilini, U., M. Almenfi, and I. Orton (2020). ‘Social Protection and Jobs Responses to
COVID-19: A Real-Time Review of Country Measures’. Downloaded at
8http://www.ugogentilini.net/wp-content/uploads/2020/03/global-review-of-social-
protection-responses-to-COVID-19-2.pdf
ILO (2020) ‘COVID-19 and the world of work: impact and policy responses’. Downloaded at
https://www.ilo.org/wcmsp5/groups/public/---dgreports/---
dcomm/documents/briefingnote/wcms_738753.pdf
Ivanic, M. and W. Martin (2018) Sectoral Productivity Growth and Poverty Reduction: National
and Global Impacts, World Development 109: 429-439.
McKibbin, W., and R. Fernando (2020). ‘The Global Macroeconomic Impacts of COVID-19:
Seven Scenarios. Downloaded at: https://www.brookings.edu/wp-
content/uploads/2020/03/20200302_COVID19.pdf
Vos, R., W. Martin, and D. Laborde (2020a). ‘As COVID-19 spreads, no major concern for
global food security yet’. Downloaded at: https://www.ifpri.org/blog/covid-19-spreads-no-
major-concern-global-food-security-yet
Vos, R., W. Martin, and D. Laborde (2020b). ‘How much will global poverty increase because of
COVID-19?’. Downloaded at: https://www.ifpri.org/blog/how-much-will-global-poverty-
increase-because-covid-19
9Annex
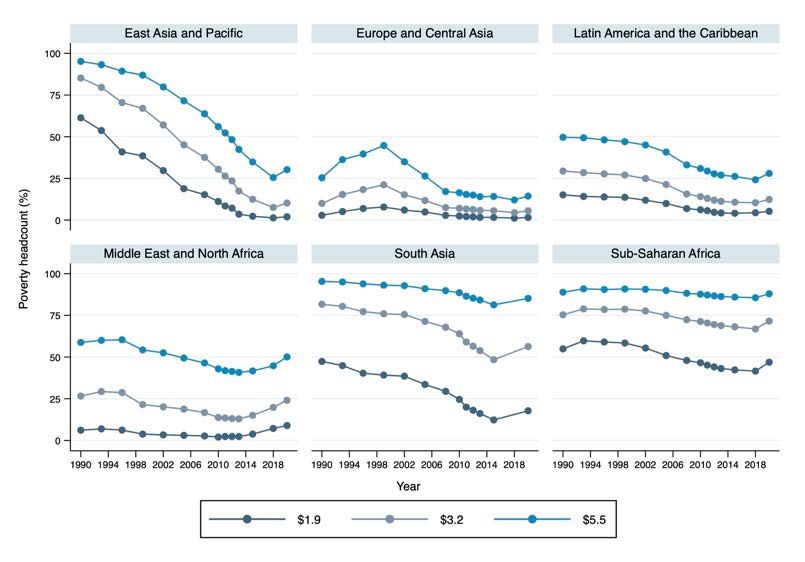
Figure A1: Poverty headcount ratios by region, 1990–2018 and projection under a 5% contraction in per capita
income or consumption
Source: authors’ estimates based on PovcalNet.
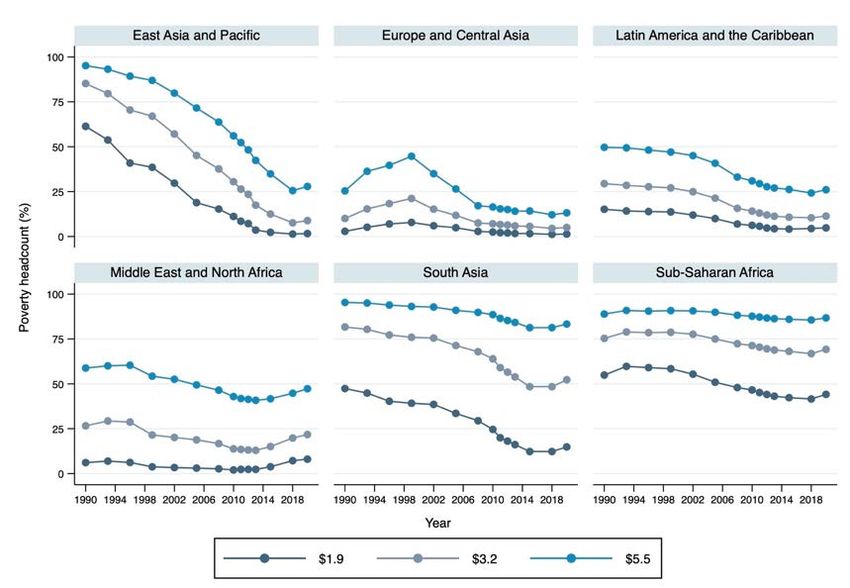
Figure A2: Poverty headcount ratio by region, 1990–2018 and projection under a 20% contraction in per capita
income or consumption
Source: authors’ estimates based on PovcalNet.
10Table A1: Incidence of poverty by region, 2018 and estimates under scenarios of contraction in per capita
incomes or consumption (% of the population and millions of people)
Source: authors’ estimates based on PovcalNet.
Note: the estimates under 5%, 10%, or 20% contraction of income or consumption are calculated relative to the
reference year. The reference year for South Asia is 2015, while it is 2018 for the rest.
11Table A2: Additional global poverty as a result of per capita income or consumption contractions, by regions and
using 2018 as reference year
Source: authors’ estimates based on PovcalNet.
Note: the estimates under a 5%, 10%, or 20% per cent contraction of income or consumption are calculated
relative to the reference year. The reference year for South Asia is 2015, while it is 2018 for the rest.
12Table A3: Incidence of poverty by region, 2015 and estimates under scenarios of contraction in per capita
incomes or consumption (% of the population and millions of people)
Source: authors’ estimates based on PovcalNet.
Note: the estimates under 5%, 10%, or 20% contraction of income or consumption are calculated relative to the
reference year 2015.
13Table A4: Additional global poverty as a result of per capita income or consumption contractions, by regions and
using 2015 as reference year
Source: authors’ estimates based on PovcalNet.
Note: the estimates under 5%, 10%, or 20% contraction of income or consumption are calculated relative to the
reference year 2015.
14You can also read