Global Iron Ore Outlook for DR grade iron ore: issues and challenges for the industry - International Iron Metallics Association
←
→
Page content transcription
If your browser does not render page correctly, please read the page content below
Global Iron Ore
      Outlook for DR grade iron ore: issues and challenges for the industry

                          Chris Barrington
                           Chief Adviser
          International Iron Metallics Association (IIMA)

Sponsored by
Disclaimer

       This presentation is intended for information purposes only and is
       not intended as commercial material in any respect. The material is
       not intended as an offer or solicitation for the purposes of any
       financial instrument, is not intended to provide an investment
       recommendation and should not be relied upon for such.             The
       material is derived from published sources, together with personal
       research. No responsibility or liability is accepted by the author or
       International Iron Metallics Association or any of its members for any
       such information or opinions or for any errors, omissions, mis‐
       statements, negligence or otherwise for any further communication,
       written or otherwise.

March 18th 2021                    GLOBAL IRON ORE 2021                     2
Presentation overview Setting the scene Outlook for DR grade pellet supply‐demand out to 2030 DRI and the pathway to carbon‐neutral steelmaking Supply‐side challenges for the steel & iron ore industries March 18th 2021 GLOBAL IRON ORE 2021 3
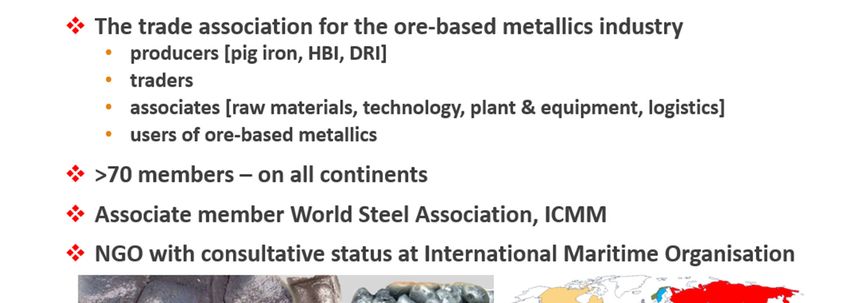
What is IIMA?

March 18th 2021   GLOBAL IRON ORE 2021   4
DR pellet premium development ‐ US$/t
                                                                                   (Fastmarkets data)

                      $250                                                                                                                                                            $80
                                          Basis 62% Fe fines index                                                        Basis 65% Fe fines index

                                                                                                                                                                                      $70
                      $200
                                                                                                                                                                                      $60

                                                                                                                                                                                      $50
                      $150

 Setting                                                                                                                                                                              $40

the scene             $100
                               68   68
                                           65
                                                  62                                                                                                                                  $30

                                                                                                                                                                     46.3 46.3 46.3
                                                         41     39     39     39                                                                                                      $20
                       $50                                                           31     31     30    30    31    31      31
                                                                                                                                   27
                                                                                                                                          24     24     24     24
                                                                                                                                                                                      $10

                        $0                                                                                                                                                            $0
                             May‐19      Jul‐19        Sep‐19        Nov‐19        Jan‐20        Mar‐20 May‐20            Jul‐20        Sep‐20        Nov‐20        Jan‐21   Mar‐21
                                                   DR grade pellet premium (right axis)                 62% Average (left axis)           65% Average (left axis)

    March 18th 2021                                                    GLOBAL IRON ORE 2021                                                                                   5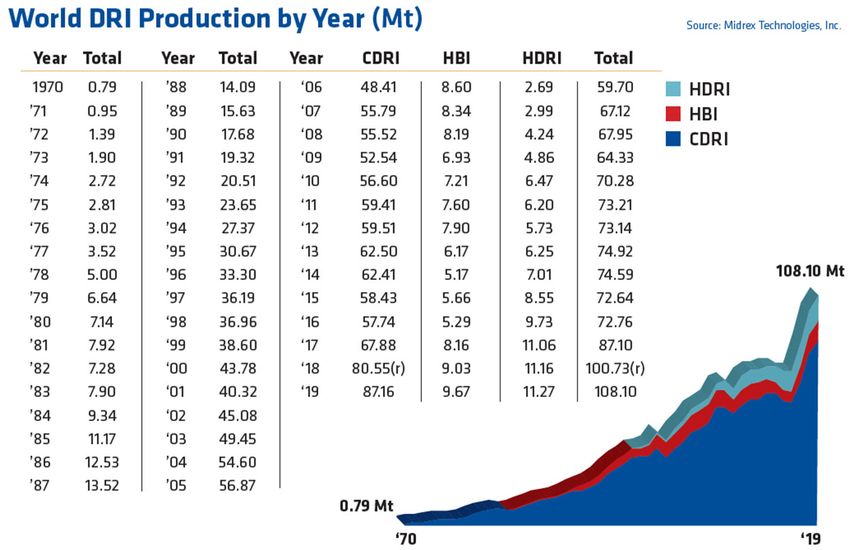
worldsteel DRI production data '000 tonnes
                                           Canada, Mexico, Argentina, Venezuela, Egypt, Libya, South Africa, Iran, Qatar, Saudi Arabia, UAE, India
                                                                       (≡ approximately 85% of global production)
                              100,000                                                                                                                      ‐5.9%
                                90,000

                                80,000

                                70,000

                                60,000

                                50,000

                                40,000

                                30,000

                                20,000

                                10,000

                                    ‐
                                         Jan     Feb        Mar        Apr        May         Jun        Jul       Aug         Sep        Oct        Nov    Dec
                                                                                 2019        2020        2021

March 18th 2021   GLOBAL IRON ORE 2021                                                                                                          6
DRI production in plants using merchant iron ore (mt)
                   55
                                                                                                                        50.6
                                                                                                             49.5
                                                                                                      47.4
                                                                                               45.1
                   45
                                                                                    41.3                     13.8       14.8
                                                                                                      11.8
                                                                            37.5               9.8
                                                                     35.4           6.3
                   35                                    33.3               2.8
                                             31.7                     1.4
Argentina                             30.0                0.6
Trinidad                29.4                  0.3
USA                            26.8
Germany
South Africa
                   25
Algeria
Libya
Egypt                                                                34.0   34.7    35.0       35.3   35.6   35.7       35.8
                                             31.4        32.7
Saudi Arabia       15   29.4          30.0
Qatar                          26.8
Bahrain
UAE
Oman
Malaysia            5

                        2019   2020   2021   2022        2023        2024   2025   2026        2027   2028   2029       2030
                   ‐5
                                                 Existing/Contracted        Uncontracted/New

 March 18th 2021                              GLOBAL IRON ORE 2021                                                  7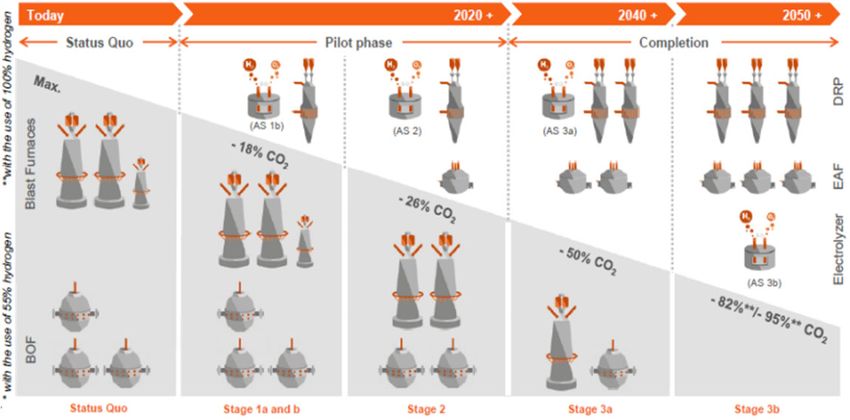
DRI production from new projects
                                               (based on merchant iron ore)
Project                  2022   2023    2024   2025       2026           2027      2028   2029   2030   Location

HBIS Group               0.3    0.6      0.6   0.6         0.6               0.6   0.6    0.6    0.6                 China

Salzgitter                               0.8   1.6          2                2.0   2.0    2.0    2.0               Germany

TKS                                            0.6         1.2               1.2   1.2    1.2    1.2               Germany

Liberty/PW/SHS                                             1.0               2.0   2.0    2.0    2.0                 France

IOC/PW/SHS                                                 0.5               1.0   1.0    1.0    1.0                Canada

MENA 1                                                     1.0               2.0   2.0    2.0    2.0              North Africa

MENA 2                                                                       1.0   2.0    2.0    2.0              North Africa

EU                                                                                 1.0    2.0    2.0    Austria, Italy, Romania, Germany

Asia                                                                                      1.0    2.0             ASEAN, China

Total                    0.3    0.6      1.4   2.8         6.3               9.8   11.8   13.8   14.8

Subsequent note: ArcelorMittal reported to be planning DR/EAF plants at Bremen and Eisenhuettenstadt by 2026.

       March 18th 2021                                GLOBAL IRON ORE 2021                                                   8
Merchant DR grade pellet demand (mt) ‐ 1.45 t pellets per 1t DRI
                    80
                                                                                                                    73.4
                                                                                                             71.8
                    70                                                                                68.8
                                                                                               65.4
                                                                                    59.9                     20.0   21.5
                    60                                                                                17.1
                                                                            54.4               14.2
                                                                     51.3           9.1
                                                           48.3             4.1
Argentina           50                        46.0                    2.0
                                                           0.9
Trinidad                 42.6          43.4   0.4
USA
                    40          38.9
Germany
South Africa
Algeria
Libya               30
Egypt
Saudi Arabia                                                         49.3   50.3    50.8       51.2   51.7   51.8   52.0
                                              45.5         47.4
Qatar                    42.6          43.4
                    20          38.9
Bahrain
UAE
Oman
Malaysia            10

                     0
                         2019   2020   2021   2022         2023      2024   2025    2026       2027   2028   2029   2030
                                                   Existing/Contracted      Uncontracted/New

  March 18th 2021                             GLOBAL IRON ORE 2021                                              9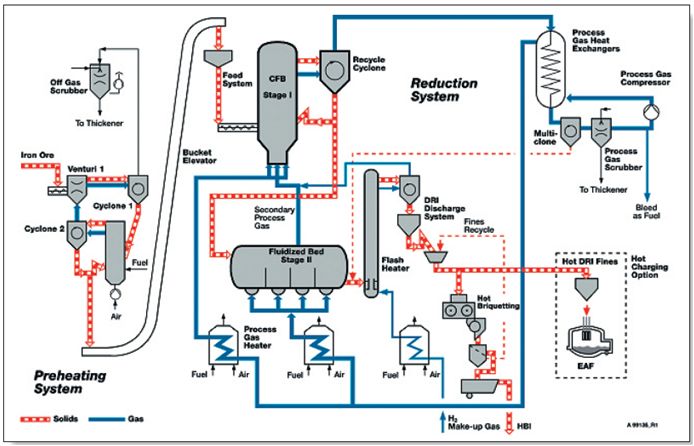
Iron ore pellets gap to fill ‐ million tonnes

                           11.8                                               19.0 30.8

                                 2019‐2025         2025‐2030

         0        5         10           15                         20   25     30        35

March 18th 2021                              GLOBAL IRON ORE 2021                              10
Seaborne Ore Supply to DR plants 2020 (mt) ‐ total 38.2 mt
(preliminary estimate)
source: trade statistics and author's estimates
(compares with 38.9 mt derived from DRI production data)
1.8
1.1
0.7
Vale
LKAB
Canada 14.6
8.0
Bahrain Steel
India
CIS
Tosyali
Cliffs
4.1 Lump
7.5
March 18th 2021 GLOBAL IRON ORE 2021 11Potential incremental DR pellet supply:demand 2019 to 2030 (mt)
Assumes Vale reaches 60 80
mt pellet production of
75 11.0
which 45% is DR grade
Assumes 12 mt from 70
73.4
Bahrain Steel 65
3.5 11.0
8.0
Assumes Tosyali Algerie 2.0
2.0
60 3.0
is self‐sufficient in pellets
2.0
by 2025 55 8.0 0.3
54.4
Assumes start date for 50
Samarco Phases 2 & 3 1.7 0.3
45
during second half
42.6
decade 40
According to this 35
scenario, potential 2025
30
DR pellet supply exceeds
demand by 20%
To meet the 2030 level of
demand, Samarco Phases
2 and 3 and much more
will be needed….
+30.8 mt
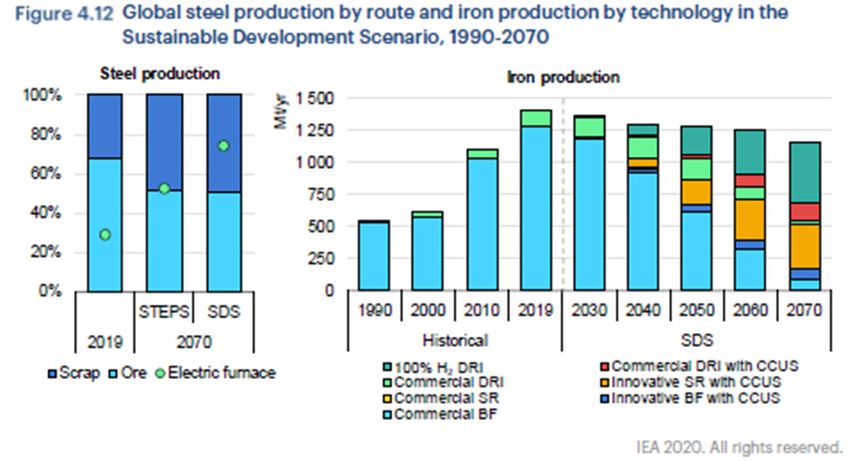
March 18th 2021 GLOBAL IRON ORE 2021 12International Energy Agency’s “Energy Technology
Perspectives 2020” and “Iron & Steel Technology Roadmap”
The IEA considers two scenarios:
The Stated Policies Scenario (STEPS) takes into account
countries’ energy‐ and climate‐related policy
commitments, including nationally determined
contributions under the Paris Agreement, to provide a
baseline against which to assess the additional policy
actions and measures needed to achieve the Sustainable
Development Scenario.
The Sustainable Development Scenario (SDS) sets out the
major changes that would be required to reach the main
energy‐related goals of the United Nations Sustainable
Development Agenda, including an early peak and
subsequent rapid reduction in emissions, in line with the
Paris Agreement, universal access to modern energy by
2030 and a dramatic reduction in energy‐related air
pollution. The trajectory for emissions in the Sustainable
Development Scenario is consistent with reaching global
“net‐zero” CO2 emissions for the energy system as a
whole by around 2070.
March 18th 2021 GLOBAL IRON ORE 2021 13DRI production according to IEA's sustainable development scenario ‐ mt
700
638
600
540
500
411
400 471
350
300 213
269
80
200
167 14 37
116 98
0
1
100 141
157 174 162
115
92
25
0
2019 2030 2040 2050 2060 2070
Commercial DRI Commercial DRI with CCUS 100% H₂ DRI
March 18th 2021 GLOBAL IRON ORE 2021 14DRI production in 2050 ‐ scenario comparison ‐ mt
700
600
596
500
400
411
394
300
272
200
157
100
108
0
2019 IEA WSD
DRI Iron Ore
March 18th 2021 GLOBAL IRON ORE 2021 15World iron ore production 2020 ‐ tonnes x 106
Iron production trends ‐ IEA SDS ‐ tonnes x 106 Australia 900
560
1400 Brazil 252
400
Canada 57
BF DRI SR 34
1200 Chile 13
8
China 340
210
India 230
1000 140
Iran 32
21
21 Usable ore ‐ total 2,400
Kazakhstan 5.9
800 15
Peru 10 Fe content ‐ total 1,500
Russia 95
63
600 South Africa 71
40
Sweden 35
22
400 Turkey 16
8.9
Ukraine 62
39
USA 37
200 24
Others 75
43
Source: US Geological Survey, February 2021
0
2019 2030 2040 2050 2060 2070
World iron ore reserves ‐ tonnes x 106
Australia 50,000
24,000
Brazil 34,000
15,000
On the face of it, the shift from BF/BOF to DR/EAF does Canada 2,300
6,000
not appear to be too much of a quantitative problem China 6,900
20,000
from the iron ore supply perspective…. India 5,500
3,400 Crude Ore ‐ total 180,000
Iran 2,700
1,500
Fe content ‐ total 84,000
2020 production 1.5 bn tonnes Fe‐contained with Kazakhstan 900
2,500
25,000
reserves of 84 bn tonnes Russia
1,000
14,000
South Africa 640
Sweden 1,300
Of course in practice it’s not as simple as that…. Ukraine
600
6,500
2,300
3,000
The real issue for DR/EAF is ore quality….and value‐in‐use USA
Others
1,000
18,000
9,500
Note: excludes Chile, Peru, Turkey
Source: US Geological Survey, February 2021
March 18th 2021 GLOBAL IRON ORE 2021 16Some interim remarks….
The iron & steel value chain is like a super‐tanker ‐ it
takes a long time to change course….
The roadmap to “carbon‐neutral” steelmaking has a
timeline of 30‐50 years and there are several pathways
under active consideration, with common themes
being hydrogen as reductant/energy source and the
eventual destination of EAF.
Many steel companies are moving rapidly toward the
first steps, notably in Europe (e.g. ArcelorMittal,
Salzgitter, thyssenkrupp, voestalpine, SSAB, SHS Saar).
Direct reduction plays a vital role in most roadmaps
and thus iron ore is fundamental to success.
DRI and HBI are essential EAF steelmaking inputs, their
clean analysis diluting residual metallic impurities in Image source: Salzgitter AG/Salcos
scrap, thus enabling:
production of high quality steel products, and
inclusion of lower grades of scrap in the charge
March 18th 2021 GLOBAL IRON ORE 2021 17Iron ore quality trends
Iron ore quality has been declining
gradually as shown in these charts.
Conversely, over the same period, the
quality of seaborne iron ore pellet feed
and concentrates has remained rather
constant, as has the quality of seaborne
DR grade pellets, although in some
cases this masks the need for additional source: Raw Materials & Ironmaking Global Consulting
beneficiation and concentration of the
source ore in order to maintain grade.
March 18th 2021 GLOBAL IRON ORE 2021 18Impact of declining iron ore quality DR/EAF Lower yield and productivity in both DR and EAF Greater slag volume in EAF / higher Fe yield losses Higher power consumption in EAF BF/BOF Increased sinter production required to provide the same Fe units from the sinter plants Increased blast furnace slag volumes and therefore increased fuel rates Increased BOF flux consumption to maintain P removal March 18th 2021 GLOBAL IRON ORE 2021 19
DRI production by process 2019 % (total 108.1 tonnes x 106)
Fines
0.2
Lump ore & pellets 24
shaft furnace
rotary kiln
Three issues to consider: fluidised
Where will the longer‐term bed/other
pellet supply come from?
75.8
Should fines‐based DR Mainly pellets
(some lump ore)
processes be considered?
What is the scope for lump ore?
Data source: Midrex Technologies
March 18th 2021 GLOBAL IRON ORE 2021 20Iron ore quality requirements for DR/EAF Fe content as high as possible, minimum 65‐66%, ideally ≥67% Acid gangue content (SiO2 + Al2O3) as low as possible, maximum 3.5%, ideally maximum 2% (also TiO2
“Traditional” suppliers of merchant DR grade pellets:
Vale, Samarco, IOC, AMMC, LKAB, Bahrain Steel
“Emerging” suppliers of merchant DR grade pellets: Future merchant pellet supply
Cleveland Cliffs, Metalloinvest, Metinvest, Ferrexpo
Other suppliers of merchant pellets to DR plants:
CMP, Severstal Resources, various Indian plants e.g. KIOC
Global iron ore pellet production ‐ tonnes x 106
Failed or dormant DR pellet projects: Europe
29.4
28.5
Canada: LabMag/KéMag (New Millennium Iron/Tata Steel) ‐ 9 mt 27.2
72.9 2017 2018 2019
CIS
74.9
USA Mn: Mesabi Metallics ‐ 7 mt 78.2
81.2
Mauritania: El Aouj (SNIM/Glencore) ‐ 7 mt North America 80.8
77.2
Totals:
Oman: Jindal Shadeed ‐ 7 mt South America
46.9
50.6
2017 468.9
2018 463.3
Saudi Arabia: Wadi Sawawin (National Mining Company) ‐ 5 mt 35.3
48.6 2019 462.8
Africa/ME 57.2
58.6
New opportunities: India 59.6
63.6
2ndline at Vale Oman 69.7
120
India (likely domestic use with 80 mt sponge iron target) China 105
110
Algeria (Tosyali Phase 4) Japan
3
3
3
New DR plants with integrated pellet plants Australia
3.3
3.7
US pellet plants researching shift from BF to DR grade (UMD/NRRI 3.6
project) Data source: worldsteel
Others?
Shift of BF pellets to DRI for BF/BOF consumption
March 18th 2021 GLOBAL IRON ORE 2021 22Fines‐based DR processes
CIRCORED (Outotec) FINORED (Primetals)
fines/concentrates 0.1 – 2 mm fines up to 8 mm
HYFOR (Primetals)
(under development)
concentrates
up to 0.15 mm (150 µm)
March 18th 2021 GLOBAL IRON ORE 2021 23Current merchant high grade pellet feed supply
Minas Rio, Brazil (Anglo American)
25‐27 mt from 2023 (of which ±8 mt ≥67% Fe / ≤2% gangue)
Champion Iron, Canada (Bloom Lake)
FY 2020 8 mt production, 66.5% Fe (Phase 2: 15 mt)
Two recent concentrate shipments to MENA totaling 0.34 mt with 67.98% and 67.8% Fe with combined
SiO2 + Al2O3 of 2.57% and 2.68%
Kaunis Iron, Sweden
2 mt >68% Fe
CMP, Chile
El Romeral, Planta Magnetita (copper mining by‐product) 66‐68% Fe
Metalloinvest, Russia
BF/DR grade concentrate (≤ 70% Fe, ≤ 2.6% SiO2) ‐ 6 mt from 2021
DR grade concentrate ((≤ 71% Fe, ≤ 1.0% SiO2) ) ‐ 4 mt from 2024
March 18th 2021 GLOBAL IRON ORE 2021 24Potential future suppliers of DR grade pellet feed
Eurasian Resources’ Bamin project, Brazil: 16‐18 mt 67‐68.5% Fe concentrate, start‐up potentially 2021
SAM’s’ Projeto Bloco 8, MG Brazil: 27.5 mt pellet feed 66.2% Fe
Strike Resources’ Apurimac project in Peru: base case is 20 mt magnetite concentrate >66% Fe,
dependent on new railway with completion 2028, now updating PFS prior to BFS, now mining DSO
Nordic Iron Ore Ludvika mines, central Sweden: plans to produce up to 4.4 mt high grade concentrate in
three phases (66.5‐70.5% Fe)
Tacora Resources’ recently acquired Sydvaranger mine in Kirkenes, Norway: first operated in 1910, mine
last operated 2009‐2015, 20 mt ore mined and 8 mt magnetite concentrate sold, specification 68% Fe (5%
SiO2)
FMG’s Ironbridge project in WA Australia: 22 mt 67% Fe magnetite concentrate (to be blended with
lower grade FMG products?)
Carpentaria Resources’ Hawsons Iron project in NSW, Australia: aims to produce 70% Fe magnetite
concentrate at initial rate of 10 mt from Q4 2022 ‐ now undertaking financing for BFS
Magnetite Mines’ Mawson Iron project in South Australia: could produce 8.2 mt magnetite concentrate
with up to 68.8% Fe
Many other magnetite‐based iron ore projects in Australia: Southdown (Grange Resources), Mt. Ida
(Jupiter Mines), Australian Resources’ Balmoral South project, etc.
Zanaga Iron Ore’s project in Republic of Congo: Phase 1: 12 mt (66% Fe) and Phase 2: +18 mt (67.5% Fe)
pellet feed
Black Iron’s Shymanivske project in Krivyi Rih, Ukraine: Phase 1; 4 mt. Phase 2: 8 mt 68% Fe magnetite
concentrate
March 18th 2021 GLOBAL IRON ORE 2021 25Some key messages First and foremost, the iron ore status quo is not an option if carbon‐neutral steelmaking is to become a reality in the prescribed timescale. The iron & steel industry and its technology suppliers have already started the journey, as have major iron ore producers around the world. March 18th 2021 GLOBAL IRON ORE 2021 26
Iron ore majors and scope 3 emissions
Rio Tinto:
Partnership with China Baowu Steel Group and Tsinghua University
‐ establishment of Low Carbon Materials Preparation R&D Centre
MOU with Nippon Steel to jointly explore, develop and
demonstrate technologies to transition to a low‐carbon emission
steel value chain
MOU with SHS Saar and Paul Wurth – H2‐based HBI production in
Canada
BHP
Partnership with JFE Steel to jointly study technologies and
pathways capable of making material reductions to greenhouse
gas emissions from the integrated steelmaking process
Partnership with China Baowu Steel Group to share technical
knowledge to help address the challenge of reducing greenhouse
gas emissions facing the global steel industry.
Partnership with HBIS Group – examine technology to reduce GHG
in steel industry: H2‐based DRI technology, recycling of steelmaking
slags, the role of lump ore utilisation
Vale and BHP
Investment in Boston Metal – Molten Oxide Electrolysis
March 18th 2021 GLOBAL IRON ORE 2021 27Some key messages First and foremost, the iron ore status quo is not an option if carbon‐ neutral steelmaking is to become a reality in the prescribed timescale. The iron & steel industry and its technology suppliers have already started the journey, as have major iron ore producers around the world. These two inter‐dependent industries must co‐operate closely to ensure that iron ore of the right type and quality is available on a timely basis ‐ this is not a one‐way street. In the long run, iron ore of the type and quality needed is not going to become cheaper to produce, given the need for higher levels of beneficiation in many cases. Whilst at industry level these challenges are increasingly well understood, it is essential that they be communicated to policy makers. March 18th 2021 GLOBAL IRON ORE 2021 28
Thanks for your attention!

                                                                            IIMA Chief Adviser:
                                                                              Chris Barrington
                                                                         cbarrington@metallics.org
                                                                               Website:
                                                                            www.metallics.org

Health warning: a forecast (or even a scenario) is not a prophecy!

         March 18th 2021                          GLOBAL IRON ORE 2021                          29
You can also read