June 16, 2021 Business Update

Page created by Glen Payne
 
CONTINUE READING
June 16, 2021 Business Update
Forward Looking Statements & Non-GAAP Measures
Forward-Looking Statements
Certain statements in this presentation constitute “forward-looking” statements, which include any statements related to the novel coronavirus ("COVID-19"),
the Freshpet Kitchens Expansion, and the Company's general operating and economic environment. These statements are based on management's current
opinions, expectations, beliefs, plans, objectives, assumptions or projections regarding future events or future results. These forward-looking statements are
only predictions, not historical fact, and involve certain risks and uncertainties, as well as assumptions. Actual results, levels of activity, performance,
achievements and events could differ materially from those stated, anticipated or implied by such forward-looking statements. While Freshpet believes that its
assumptions are reasonable, it is very difficult to predict the impact of known factors, and, of course, it is impossible to anticipate all factors that could affect
actual results. There are many risks and uncertainties that could cause actual results to differ materially from forward-looking statements made herein
including, most prominently, the risks discussed under the heading “Risk Factors” in the Company's latest annual report on Form 10-K and quarterly reports on
Form 10-Q filed with the Securities and Exchange Commission. Such forward-looking statements are made only as of the date of this presentation. Freshpet
undertakes no obligation to publicly update or revise any forward-looking statement because of new information, future events or otherwise, except as
otherwise required by law. If we do update one or more forward-looking statements, no inference should be made that we will make additional updates with
respect to those or other forward-looking statements.
Non-GAAP Measures
Freshpet uses certain non-GAAP financial measures, including EBITDA, Adjusted EBITDA, Adjusted EBITDA as a % of net sales, Adjusted Gross Profit, Adjusted
Gross Profit as a % of net sales (Adjusted Gross Margin), Adjusted SG&A and Adjusted SG&A as a % of net sales. These non-GAAP financial measures should be
considered as supplements to GAAP reported measures, should not be considered replacements for, or superior to, GAAP measures and may not be
comparable to similarly named measures used by other companies.
Freshpet defines EBITDA as net income (loss) plus interest expense, income tax expense and depreciation and amortization expense, and Adjusted EBITDA as
EBITDA plus net income (loss) on equity method investment, plant start-up expense, non-cash share-based compensation, launch expense, fees related to
equity offerings of our common stock, implementation and other costs associated with the implementation of an ERP system, and other expenses, including
loss on disposal of equipment and COVID-19 expenses.

                                                                                                                                                           2
June 16, 2021 Business Update
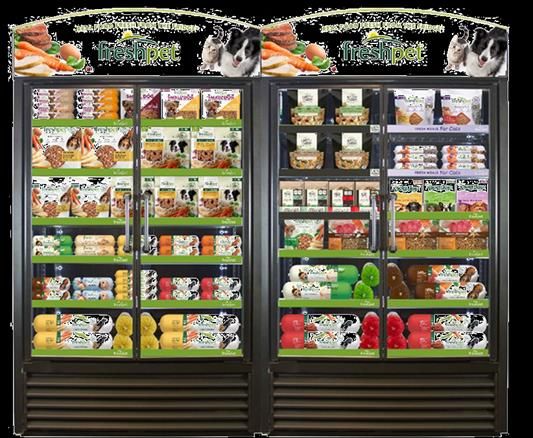
Forward Looking Statements & Non-GAAP Measures (cont.)

Freshpet defines Adjusted Gross Profit as gross profit before depreciation expense, plant start-up expense, COVID-19 expenses and non-cash share-based
compensation, and Adjusted SG&A as SG&A expenses before depreciation and amortization expense, non-cash share-based compensation, launch expense,
gain (loss) on disposal of equipment, fees related to equity offerings of our common stock, implementation and other costs associated with the
implementation of an ERP system and COVID-19 expenses.
Management believes that the non-GAAP financial measures are meaningful to investors because they provide a view of the Company with respect to ongoing
operating results. Non-GAAP financial measures are shown as supplemental disclosures in this presentation because they are widely used by the investment
community for analysis and comparative evaluation. They also provide additional metrics to evaluate the Company’s operations and, when considered with
both the Company’s GAAP results and the reconciliation to the most comparable GAAP measures, provide a more complete understanding of the Company’s
business than could be obtained absent this disclosure. Adjusted EBITDA is also an important component of internal budgeting and setting management
compensation. The non-GAAP measures are not and should not be considered an alternative to the most comparable GAAP measures or any other figure
calculated in accordance with GAAP, or as an indicator of operating performance. The Company’s calculation of the non-GAAP financial measures may differ
from methods used by other companies. Management believes that the non-GAAP measures are important to an understanding of the Company's overall
operating results in the periods presented. The non-GAAP financial measures are not recognized in accordance with GAAP and should not be viewed as an
alternative to GAAP measures of performance.
Certain of these measures present the Company’s guidance for fiscal year 2021. The Company does not provide guidance for the most directly comparable
GAAP measure and similarly cannot provide a reconciliation to such measure without unreasonable effort due to the unavailability of reliable estimates for
certain items. These items are not within the Company’s control and may vary greatly between periods and could significantly impact future financial results.

                                                                                                                                                   3
June 16, 2021 Business Update
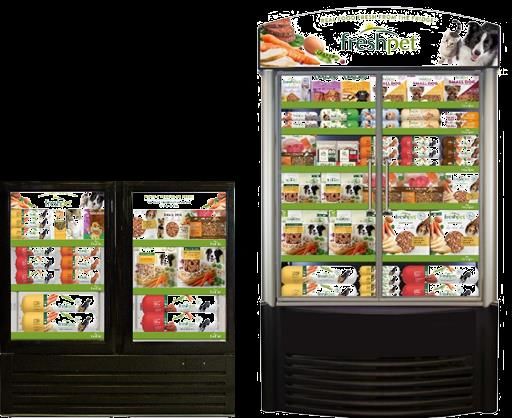
2021 Guidance Review
June 16, 2021 Business Update
2021 guidance re-affirmed

                 $ in Millions            2020              2021             % Change

                Net Sales                 $318.8            >$430            +35%

                Adjusted EBITDA           $46.9             >$61             +30%

• ERP Conversion: Tentatively targeted for 10/1/21
• COVID Addback: Anticipating $2.0 million in COVID-related costs in 2021 until broadscale vaccination has
  occurred – currently projected to occur within Q3

                                                                                                             6
June 16, 2021 Business Update
Assumptions behind guidance

           Q1 Expectations                           Q2 Expectations                      Q3 & Q4 Expectations
• Moderating consumption growth            • Accelerating consumption behind      • Strong period-to-period
  due to out-of-stocks                       improved retail conditions and         consumption growth behind
• Net sales in excess of consumption         strong advertising investment          advertising investment and strong
  as we re-fill trade inventory – slight   • Shipment growth modestly in            supply
  acceleration in growth rate from Q4        excess of consumption growth due     • Shipment growth in excess of
• Adj. gross margin in line with Q4          to trade inventory re-fill             consumption growth due to short
  due to higher staffing levels to drive   • Lower cost per lb. of production       shipments in the YA
  higher throughput, beef costs, lost        (improved mix & higher               • Continuing to expect adjusted gross
  production due to storms and mix           throughput)                            margin lift due to increased
  shift to bags                            • Incremental costs associated with      throughput
• U. S. advertising investment               disposals & incremental processing   • Continued heavy advertising
  delayed to allow for improved in-        • Strong advertising investment          investment
  stocks– in line with previous year       • Resumption of fridge placements as   • Meaningful store count growth
• Low new store additions until trade        inventories are replenished
  inventory is replenished in April

                                                                                                                      7
June 16, 2021 Business Update
Inflation considerations heading into 2H 2021

                               Chicken               Beef            Packaging              Labor           Freight
    Key cost element

                          Priced annually in                       Floats with resin                        Assumed
                                                                                          Tight labor
                              December;        Priced quarterly;     price; expect                        inflation but
  Potential cost impact                                                                market; impact
                           potential impact    assumed in plan     some impact in                          exceeding
                                                                                       likely next year
                               next year                               back half                          expectations

• Full year 2021 adjusted gross margin could be pressured and be slightly below previous year
• May require pricing actions to offset rising costs in 2022

                                                                                                                          8
COVID impact & addback

             Q1 Results                        Q2 Expectations                          Q3 Expectations
• Includes $950K of COVID-related    • Team members became eligible for      • Anticipated completion of COVID
  addbacks for supplemental wages      vaccines on March 31, 2021              addback
  to production team, incremental    • Offered team members an incentive     • Final quarter of supplemental pay
  sanitation and health screening,     to provide documentation that they      and compensation for
  and above normal absenteeism         have successfully been vaccinated       asymptomatic testing/quarantine
                                         • 2 days of paid time off if        • Maintaining supplemental
                                            vaccinated by June 1; 1 day of     screening and sanitation costs per
                                            paid time off if vaccinated        OSHA and CDC guidance
                                            between June 1 and August 1
                                         • $25 gift card
                                         • Entered in drawing to win
                                            $1500
                                     • Continuing all safety protocols,
                                       supplemental wages,
                                       testing/quarantine costs

                                                                                                                    9
Current Business Performance
Strong net sales growth YTD; tough year-on-year comp in
     June will bring Q2 growth rate to low-mid 30’s
               2021 Freshpet Monthly Net Sales vs. YA                   Q2 2020 Net Sales vs. YA

          Winter Storms Orlena and
                                                                                                   154%
               Uri constrained                          150%
          production and shipments
                                            144%
                                                                124%
                                 140%                                            119%
   137%

                   122%

   January        February       March       April      May    April 2020       May 2020       June 2020   11
Strong growth vs. YA will narrow before expanding again in late
  Q3 & Q4 behind increased capacity and advertising investment
                                                              Nielsen Mega-Channel Consumption
      12,000,000                  Winter Storm Uri

                                                                                                                                      +>35% (est)
      11,000,000

                                                                                      +~20% (est)
      10,000,000

                                                                    +34%
       9,000,000
                                                       +49%                                              Capacity constrained and out-of-stocks
                         +30%
       8,000,000
                                                                                                    Nielsen Mega-Channel consumption vs. YA:
                                                                                                    • Latest 4 weeks: +33%
       7,000,000                                                                                    • Q2 to date: +41%
                                                                                                    • YTD: +30%
       6,000,000
                1/2/21          2/2/21      3/2/21   4/2/21    5/2/21      6/2/21      7/2/21       8/2/21     9/2/21   10/2/21   11/2/21     12/2/21

                                                                  Mega Channel 2021        Mega Channel 2020

Source: Nielsen Mega-Channel Data thru 6/5/21
                                                                                                                                                        12
Strong growth on a 2-year stacked basis
                                                                          Nielsen Mega-Channel Consumption Growth
                                                                                                        (2 Year Stacked)
                          66%
      62%                                                                                                 63%                                              62%
                                    59%                                                        58%                           59%                 59%                         59%
                                             58%                                                                                                                                       57%                 58%
                54%                                                                                                 55%                                             56%                          55%
                                                       53%                                     1%                                      53%                                                                          54%
                                                                                     50%
                          34%                                    45%
                                                                            43%
      34%
                                    31%      28%
                28%                                    26%                           17%                                                                                                                   34%
                                                                                                                                                           46%                                   32%                28%
                                                                                                                                                                             41%       39%
                                                                 20%        15%                                                                                     42%
                                                                                                          66%                50%
                                                                                                                    46%                          54%
                                                                                                                                       45%
                                                                                               57%

                          32%                                                        33%
      28%                           28%      30%       28%                  28%
                26%                                              25%                                                                                                                                       24%      26%
                                                                                                                                                                                                 22%
                                                                                                                                                           16%               18%       17%
                                                                                                                                                                    14%
                                                                                                                    10%       9%       8%
                                                                                                                                                 4%
      1/9/21   1/16/21   1/23/21   1/30/21   2/6/21   2/13/21   2/20/21    2/27/21   3/6/21   3/13/21     -3%
                                                                                                         3/20/21   3/27/21   4/3/21   4/10/21   4/17/21   4/24/21   5/1/21   5/8/21   5/15/21   5/22/21   5/29/21   6/5/21

                                                                                                          2020        2021
                                                                                                                                                                                                                             13
Source: Nielsen Mega-Channel Data thru 6/5/21
2-year stacked will remain strong and could accelerate in
         late Q3 and Q4 behind increased advertising
                                                                     Nielsen Mega-Channel Consumption Growth
                                                                                           (2 Year Stacked)
              66%
      62%                                       63%         62%
                  59%                    58%         59% 59%      59%
                     58%                                                 58%
          54%                                     55%          56% 57%55%
                        53%              1%             53%                 54%
                                      50%
              34%             45%
                                 43%                                                                                  45%45%44%
      34%                                                                                                     41%                42%                            42%
                  31%28%                                                                                            40%             41%40%             39%  41%       40%
                                      17%
          28%           26%                                  46% 41% 32%34%28%         37% 38%
                                                                                          35%
                                                                                                                              38%         38% 37%38% 39% 38%
                                                                                                                                             36%                  35%
                                                                                                                                                                         38% 39%
                                                                                                                                                                            36%
                              20%15%                                39%          33%
                                                                42%                 32%
                                                66%46%50% 54%                 30%
                                                         45%
                                          57%

            32%           33%
      28%26% 28%30%28% 28%                                                           26%
                      25%
                                                                               22%24%
                                                                   16%14%18%17%
                                                  10% 9% 8%
                                                              4%
                                                -3%

                                                                                             2020     2021
                                                                                                                                                                                   14
Source: Nielsen Mega-Channel Data thru 6/5/21
Channels & Distribution
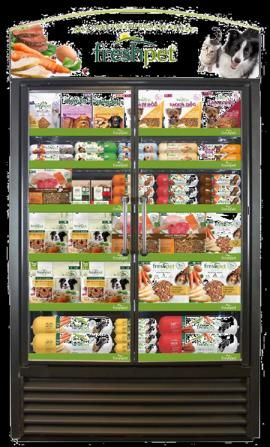
Q2 to date: Strong performance on upgrades & second
                               fridges
                                                        Net New Stores                         Fridge Upgrades                      Second Fridges
                                                                        550
                                                                                               2,940                                2,953
                                                                               405
                                                                                       1,809
                                               253     231                                                                  1,586
            Store Count
                                                                                                                                                 779
                                                                                                                     554                                476
                            23,121                                                                            218

       22,120                                  Qtr. Increase           YTD Increase   Total Operating         YTD New      Total Operating       YTD New
                                                         Q2 2020    Q2 2021                     Q2 2020    Q2 2021                  Q2 2020   Q2 2021

      Q2 2020              Q2 2021
       2021 Guidance: ~23,750

                                                 2021 Guidance: +~1000 to 23,750         2021 Guidance: +~500 to 2,900       2021 Guidance: +~550 to 3,150    16
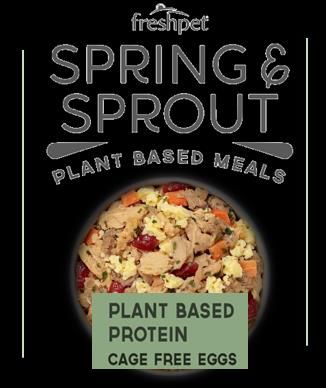
Source: Internal company data through 6/7/21
Innovative new products launched to meet emerging
  consumer needs with focus on Millennials & GenZ

      Environmentally friendly   Ethical treatment of   Home cooking
                                       animals

                                                                       17
Q1 2021 Freshpet E-Com grew +156% vs. YA

                                              9%
                                             Online
                                         Fresh Delivery
                       29%
                      Last Mile
                      Delivery
                                  $6.2MM

     6.3%
 1Q 21 mix of e-                     62%
                                  Click & Collect
 commerce sales

  91% of Sales
Contribute to Brick
    & Mortar
                                                          18
Freshpet is an omni-channel brand with differentiated
propositions to serve the widest range of consumer needs
  “Healthy, Tail-Wagging   “Purposeful Food,   “Fresh Food for Your
     Nourishment”            Thriving Pets”                           “Good Food that Does Good”
                                                  Family’s Pack”
                                                        ”

                                                                                  19               19
Partnership with Chewy.com to provide subscription
            capability to consumers who prefer to buy that way

                                                                       Q1 Letter to Shareholders

Chewy.com Shareholder Letter: https://s23.q4cdn.com/610444331/files/doc_financials/2021/q1/Q1-2021-Shareholder-Letter.pdf
                                                                                                                            20
International Business
$-
                                                                                                                                                         $100,000.00

                   $10,000.00
                                $20,000.00
                                             $30,000.00
                                                                           $40,000.00
                                                                                        $50,000.00
                                                                                                     $60,000.00
                                                                                                                  $70,000.00
                                                                                                                               $80,000.00
                                                                                                                                            $90,000.00
                                                                                                                                                                        Retail Sales
     201801
     201804
     201807
     201810
     201813
     201816
     201819
     201822
     201825
     201828
     201831
     201834
     201837
     201840
     201843
     201846
     201849
     201852
     201903
     201906
     201909
     201912
     201915
     201918
     201921
     201924
     201927
     201930
     201933
     201936
     201939
     201942
     201945
     201948
                                                                                                                                                                                                                                         investment

     201951
     202001
     202004
     202007
     202010
     202013
                                                                                                                                                                       Leading Canadian Retail Customer Weekly Sales

     202016
     202019
     202022
     202025
     202028
     202031
     202034
     202037
     202040
     202043
     202046
     202049
     202052
     202103
     202106
                                                Last 4 weeks +46% vs. YA
                                                                                                                                                                                                                       Canadian business accelerating behind advertising

     202109
22

     202112
     202115
     202118
£0
                                       £10,000
                                                   £20,000
                                                                £30,000
                                                                               £40,000
                                                                                                   £50,000
                                                                                                                       £60,000
                                                                                                                                           £70,000
                                                                                                                                                               £80,000
                                                                                                                                                                                              £90,000
                        Week 40

                                                                                                                                                                                                                      Retail Sales
                        Week 42
                        Week 44
                        Week 46
                        Week 48
                        Week 50
                        Week 52
                        Week 01
                        Week 03
                        Week 05
                        Week 07
                        Week 09
                        Week 11
                        Week 13

        Regular
                        Week 15
                        Week 17
                        Week 19
                        Week 21
                        Week 23

        TV Spots
                        Week 25
                        Week 27
                        Week 29
                        Week 31
                        Week 33
                        Week 35

        Panic Buying
                        Week 37
                        Week 39
                        Week 41
                        Week 43
                        Week 45
                        Week 47
                                                                                                                                                                               Last 4 weeks +40% vs. YA

                        Week 49
                        Week 51
                                                                                                                                                                                                                      Leading UK Retail Customer Sales by Week

                        Week 01
                        Week 03
                        Week 05
                        Week 07
                        Week 09
                        Week 11
                                      £2,000
                                                 £4,000
                                                             £6,000
                                                                                         £10,000
                                                                                                             £12,000
                                                                                                                                 £14,000
                                                                                                                                                     £16,000
                                                                                                                                                                         £18,000
                                                                                                                                                                                                            £20,000

                                                                          £8,000

                                 £0

                        1-Jun
                                                                                                                                                                                                                      Retail Sales

                       15-Jun
                       29-Jun
                        13-Jul
                        27-Jul
                       10-Aug
                       24-Aug
                        7-Sep
                       21-Sep
                        5-Oct
     Regular

                       19-Oct
                        2-Nov
                       16-Nov
     TV Spots

                       30-Nov
                       14-Dec
                       28-Dec
     Panic Buying

                       11-Jan
                       25-Jan
                        8-Feb
                                                                                                                                                                                        Latest 4 weeks +29% vs. YA

                       22-Feb
                        8-Mar
                                                                                                                                                                                                                           Leading UK Retail Customer Sales by Week

                       22-Mar
                        5-Apr
                                                                                                                                                                                                                                                                      Freshpet’s advertising-driven model works in the UK

                       19-Apr
23

                       3-May
                       17-May
Manufacturing Progress
Production is running well ahead of YA with more capacity
                 coming on-stream in Q3
                                                          2021 vs. 2020 Production Performance Comparison
                                                                         Rolling 7-Day Average Pounds Produced
                   April 1 – June 13 production = 496k lbs/calendar day
 Thousands

             600

             500

             400
                                                                                                 +40%

             300

                                                 Easter Holiday
             200
                        Winter storms                                        Memorial Day          Avg. production 4/1/20 – 12/31/20 = 354k lbs/calendar day
                                                                               Holiday
             100

              0
              1/1/21       2/1/21       3/1/21        4/1/21        5/1/21        6/1/21         7/1/21           8/1/21        9/1/21   10/1/21   11/1/21   12/1/21

                                                                  Rolling 7 Day Average - 2020            Rolling 7 Day Average - 2021
                                                                                                                                                                       25
Outside of holidays and snowstorms, production is in
             excess of consumption every week this year
                                                                                 Production vs. Consumption                              Winter Storm Orlena          Easter holiday
 $14,000,000

 $13,000,000

 $12,000,000

 $11,000,000

 $10,000,000

  $9,000,000

  $8,000,000

  $7,000,000                                                                                                                                                                             Memorial Day
                                                                                                                                                                                           holiday
  $6,000,000                                                                                                                                    Winter Storm Uri
                                                                                                                                                (Kitchens South)
  $5,000,000

  $4,000,000
          3/7/2020    4/7/2020     5/7/2020     6/7/2020     7/7/2020     8/7/2020   9/7/2020   10/7/2020   11/7/2020    12/7/2020   1/7/2021   2/7/2021   3/7/2021     4/7/2021       5/7/2021   6/7/2021

                                                    Total Weekly Retail $ Value (incl. treats) Production               Nielsen Mega-Channel Consumption

Source: Nielsen Mega-Channel Data thru 6/5/21 and internal company data
                                                                                                                                                                                                    26
Out-of-stocks are improving

                                Freshpet Consumer Comments: Out-of-stock & Can’t find
    1200

    1000

     800

     600

     400

     200

        0

                                                   Out of Stock/Can't Find
                                                                                        27
Source: Internal company data
Steady increases in production capacity throughout 2021

                                   Freshpet Annualized Production Capacity
                                                              2021
            Successfully               24/4 operation on both                          Kitchens 2.0 rolls
          started up rolls              lines in Kitchens 2.0                             line to 24/7
                                      (incremental step to increase
                                                                                 $640   (pulled forward)
                                                                                                                            $640
          in Kitchens 2.0
                                             output on rolls)
   $590                             $590                                                                                                $590
                                                           24/7 operation                                  Line 2 in
                                                             on bags in
                                                                                             $540
                                                                                                       Kitchens South
                                                            Kitchens 2.0
                                                $490

               $390                                         Begins July 5th                            Begins Q3 with
                                                            (slight delay from                          output in Q4
                                                              original timing                          (slight delay from
                                                             due to staffing)                           original timing)

          Q1                               Q2                                           Q3                                         Q4

                             Equipment Capacity ($ million/year)             Staffed Capacity ($ million/year)
                                                                                                                                               28
Successfully added significant talent but labor supply
                         remains a real challenge
                              Successfully Hiring Key Talent                                                     Challenges in the Labor Market

                                                                                                                           Freshpet Staffing Pipeline
                                                                                                                                              (candidates seeking jobs)

                                                               Pending Hires
                                                                                                                                                           Stimulus

                                                                          1/3/21

                                                                                                                           2/7/21

                                                                                                                                                                  3/7/21

                                                                                                                                                                                                         4/4/21

                                                                                                                                                                                                                                                5/2/21
                                                                                                                                                                                                                                                         5/9/21
                                                                                   1/10/21
                                                                                             1/17/21
                                                                                                       1/24/21
                                                                                                                 1/31/21

                                                                                                                                    2/14/21
                                                                                                                                              2/21/21
                                                                                                                                                        2/28/21

                                                                                                                                                                           3/14/21
                                                                                                                                                                                     3/21/21
                                                                                                                                                                                               3/28/21

                                                                                                                                                                                                                  4/11/21
                                                                                                                                                                                                                            4/18/21
                                                                                                                                                                                                                                      4/25/21

                                                                                                                                                                                                                                                                  5/16/21
                                                                                                                                                                                                                                                                            5/23/21
                                                                                                                 U.S. Dept. of Labor Initial Unemployment Claims

                                                                                                                                                                                                                                                                                      29
Source: US Dept. of Labor and internal data
Kitchens 2.0 bag line produces more pounds with fewer people –
     fulfilling its potential for greater efficiency and throughput

                   Avg. Pounds Per Production Day: April 2021                                                                                                 Production Staffing
   120,000

                                                                                                                                                                             12
   100,000

                                                                                                             Production FTE’s per shift
    80,000

    60,000

    40,000                                                                                                                                          10                                                10

    20,000

        -
              Kitchens 1.0 Bag Line #1       Kitchens 1.0 Bag Line #2      Kitchens 2.0 Bag Line #3                                       Kitchens 1.0 Bag Line #1 Kitchens 1.0 Bag Line #2 Kitchens 2.0 Bag Line #3

                                                                                                                                                                                                                       30
*Results will vary for each line based on package and product mix on each line on each day. Staffing only includes production personnel. Does not include support services.
Kitchens 3.0 in Ennis, TX: Construction is on track for a
                   Q2 2022 start-up

Kitchens 3.0 will include all the technical advances found in Kitchens 2.0 with additional improvements designed to increase
            throughput, improve quality and safety, and enhance the environmental sustainability of the facility
                                                                                                                               31
You can also read