2018 Needham Growth Conference - January 18, 2018 - AVID
←
→
Page content transcription
If your browser does not render page correctly, please read the page content below

2018 Needham
Growth Conference

January 18, 2018
Non-GAAP & Operational Measures
The following Non-GAAP (Adjusted) Measures & Operational Measures will be used in the presentation:

               Non-GAAP Measures
               ▪  Adjusted EBITDA
               ▪  Adjusted Free Cash Flow
               ▪  Non-GAAP Revenue
               ▪  Non-GAAP Gross Margin
               ▪  Non-GAAP Operating Expenses

               Operational Measures
               ▪  Bookings, Recurring Revenue Bookings
               ▪  Revenue Backlog
These non-GAAP measures are defined in our Form 8-K filed today, and the non-GAAP measures are reconciled with GAAP measures in our press release tables as
well as in the supplemental financial information available on ir.avid.com, which also includes definitions of our operational measures. Avid believes the non-GAAP
financial measures and operational metrics provided in this release provide helpful information to investors with respect to evaluating the Company’s performance.

The presentation also includes forward-looking non-GAAP financial measures, including non-GAAP Revenue, Adjusted EBITDA, non-GAAP Operating Expenses and
Adjusted Free Cash Flow. Reconciliations of these forward-looking non-GAAP financial measures are not included in this presentation or our press release issued today,
due to the high variability and difficulty in making accurate forecasts and projections of some of the excluded information, together with some of the excluded information
not being ascertainable or accessible at this time. As a result, the Company is unable to quantify certain amounts that would be required to be included in the most
directly comparable GAAP financial measure without unreasonable efforts.

                                                                                                                                                                  Avid ©2017   2
Safe Harbor Statement
Certain statements made within this presentation contain forward-looking statements, within the meaning of the Private Securities Litigation
Reform Act of 1995 that involve risks and uncertainties, including projections and statements about our anticipated plans, objectives,
expectations and intentions. Among other things, this presentation includes estimated results of operations for 2017, which estimates are
based on a variety of assumptions about key factors and metrics that will determine our future results of operations, including, for example,
anticipated market update of new products, realization of identified efficiency programs and market based cost inflation. Other forward-
looking statements include, without limitation, statements based upon or otherwise incorporating judgments or estimates relating to future
performance such as future operating results and expenses; earnings; bookings; backlog; product mix and free cash flow; our long-term and
recent cost savings initiatives and the anticipated benefits therefrom; our future strategy and business plans; our product plans, including
products under development, such as cloud and subscription based offerings. The projected future results of operations, and the other
forward-looking statements in this presentation are based on current expectations as of the date of this presentation and subject to known
and unknown risks and uncertainties that could cause actual results to differ materially from those expressed or implied by such statements.
The guidance presented in this presentation is inherently uncertain and subject to numerous risks and uncertainties. Our actual future
results of operations and cash flows could differ materially from those discussed in this presentation.

For additional information, including a discussion of some of the key risks and uncertainties associated with these forward-looking
statements, please see the “Forward Looking Statements” section of our press release issued today, as well as the Risk Factors and
Forward-Looking Statements sections of the Company’s 2016 Annual Report on Form 10-K filed with the SEC. Copies of these filings are
available from the SEC, the Avid Technology web site or the Company’s Investor Relations Department.

Any forward-looking information relayed in this presentation speaks only as of today, and Avid undertakes no obligation to update or revise
any forward-looking statements whether as a result of new information, future events or otherwise, except as required by law.

                                                                                                                                    Avid ©2017   3
Avid At-a-Glance
Avid Technology, Inc. is the premier provider of technology solutions to
media companies to create, manage, distribute and monetize media content

Total revenues
More than $420M in the last twelve months            Category creator with
Trusted partner                                       30-year heritage of
For customers in 140 countries                          innovation and
                                                      industry leadership
Employees
Approximately 1,800 FTEs in offices globally
                                               Comprehensive media technology
Trades on NASDAQ under the ticker               suite and leading global brands,
AVID
                                                   including Pro Tools, Media
Headquartered in                               Composer, and Avid MediaCentral,
Burlington, MA                                    our enterprise-wide platform

                                                                                   Avid ©2017   4
Company Highlights
 Well positioned in a large, growing market undergoing significant transition

 The only enterprise platform specifically for Media, uniquely positioned for the cloud

 Realigned cost structure to drive growth and profitability

 Shift to more recurring revenue and growing backlog is improving visibility

 Transformation completed; company positioned for profitable growth

                                                                                  Avid ©2017   5
Large and growing market opportunity
                                                     Selected Segments Multi-Year CAGRs

                                         VR / AR                                                                92%
                        IaaS - Compute / Storage                                            43%
                                         Security                        27%
Selected Sub-Segments

                                                                                                                                                       High Growth
                        Phonetic Search and QC                         25%
                                                                                                                         MEDIA TECHNOLOGY               Segments
                                            DRM                        24%
                                      OVP / OTT                  15%                                                      SPEND: $60B (2017)             $12B
                           Digital Video Analytics             12%
                                   Watermarking                11%
                                                                                                                                                         Currently
                              Managed Services              10%
                                                                                                                                                        Addressable
                                            MAM             9%                                                                      Remaining Media
                          Metadata Management               9%                                                                      Technology Spend        $8B
                                 Plugin Software          8%                                                                             $40B
                                             NLE       6%
                                 Shared Storage        6%
                                      Newsroom       3%

Opportunity to both gain share in segments Avid currently operates and expand into higher growth areas

                                                                             Sources: PwC, IABM, Devoncoft, NAMM, Infocomm, Avid.
                                                                                                                                                                Avid ©2017   6
Large and growing market opportunity
                                                         ENTERPRISE OPPORTUNITY
                     $5B   Develop the platform and enable upsell/cross-sell opportunities
                           Expand relationships
                           Convert enterprises to multi-year enterprise-wide agreements
                           Move to cloud, new cloud services (i.e. cognitive, storage, …)
       Continuum

                   TOTAL
                   $8B
                                                            INDIVIDUAL OPPORTUNITY
                           Digital (cloud-enabled subscriptions, digital GTM, First offerings)
                           Upsell/cross-sell new applications and services
                           Attract new creative customers
                     $3B   Cloud-enabled innovations and new offerings

                                                                                            Avid ©2017   7
2017                           7         Education
                                                                                   8    Professional
                                                                                        Services
          6 Consumer
             Packaged Goods
                                                                                                 9     Hospitality
                                                                                                       & Tourism
   5   Telecommunications                                           Media &
                                                           1
                                                                    Entertainment

                                                                                                        10 Manufacturing
         4   Financial                                                         2       IT Tech
             Services

                                        3         Retail

                   Source: Global Center for Digital Business Transformation                                         Avid ©2017   8
Media challenges
Fundamental      from
             needs    digital
                    across thedisruption
                                industry

    Create
                        Distribute to            Maximize &                   Ensure
 High-quality,
                       More>10x
                            Devices &           Protect Value             Operational &
  Engaging
                         Channels                 of Assets              Capital Efficiency
   2x–4x
   Content
                                                      +50%                    +3–4%
  Increasing Rate of   Exponential Growth of     Continued Increase in     Media Tech Budgets
  Content Creation     Distribution Platforms   Content Consumption        Have Not Kept Pace

                                                                                        Avid ©2017   9
Industry’s business challenges and needs were the
catalyst for the Avid MediaCentral™ Platform

                                                    Avid ©2017   10
Platform strategy uniquely positions Avid while
unlocking growth and driving greater efficiencies
Leverage comprehensive …along with category
global distribution… leading brands Market
Expansion
Increase
Wallet-share
Integrate on a common And now move it all
technology platform into the Cloud Maximize
MediaCentral
Lifetime Value
• Shared Media Services
• Connectivity Toolkit
• Common User Experience
Lower Costs
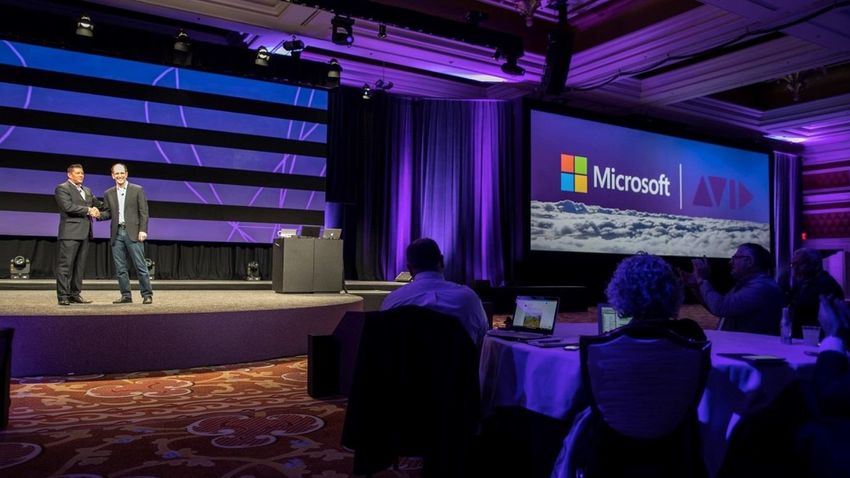
Avid ©2017 11Breakthrough alliance with Microsoft
to lead the media industry into the cloud
Avid ©2017 12Platform is uniquely enabling connections and
collaboration across the global media ecosystem
Avid ©2017 13Stronger financials today and tomorrow
Revenue visibility and predictability greatly improving
Cost structure realigned to focus on growth areas
Profitability and Adjusted Free Cash Flow improving
Avid ©2017 14Strategy is opening up an expanded market opportunity
New High
Growth Opportunities Platform allows efficient expansion into
New product categories, cloud new high-growth categories and customer
services, customer segments
segments
Cloud Incremental opportunity from cloud services
Cloud hosting, as-a-service,
with Microsoft enabled by platform strategy and strategic
alliance with Microsoft
Recurring
Business Model
Subscription, Enterprise, Shift to recurring model adds new services
Maintenance opportunities and establishes model for growth
Heritage
Market Large market, but low growth – MediaCentral
Video, Audio
platform expands addressable opportunity from
Newsroom, content creation through distribution
Storage
Avid ©2017 15Land, expand and maximize lifetime value
ADOPTION: Increase number of enterprises
and creative clients on the platform
REFINEMENT: Improve platform
performance and customer experience
CLOUDIFICATION: Enable full cloud
deployment of the platform, including SaaS
Expand Services Offering
Expand Product Offering • Cloud Media & Cognitive Services
• New (Adjacent) Growth Categories • Microsoft Azure Cloud & Marketplace
• Content & Infrastructure Security • Consulting, Enhanced Professional
• Content Monetization Services and Expanded Training Offering
• Advanced Client Care
Avid ©2017 16Revenue opportunity builds as customers adopt the platform
Customer A Land with platform and anchor products
2016 2017 2018 2019 2020 2021
Avid ©2017 17Revenue opportunity builds as customers adopt the platform
Expand with cross sell of apps and integrated solutions
Customer A Land with platform and anchor products
2016 2017 2018 2019 2020 2021
Avid ©2017 18Revenue opportunity builds as customers adopt the platform
Group B Group D
Group A
Group C
Expand footprint across the enterprise
Expand with cross sell of apps and integrated solutions
Customer A Land with platform and anchor products
2016 2017 2018 2019 2020 2021
Avid ©2017 19Revenue opportunity builds as customers adopt the platform
Expand footprint across the enterprise
Maximize
Expand with cross sell of apps and integrated solutions
Lifetime Value
Customer A Land with platform and anchor products
2016 2017 2018 2019 2020 2021
Avid ©2017 20Revenue opportunity
builds as customers Expand
adopt the platform Customer D Land
Expand
Expand
▪ Good traction with early adopters, 50,000 users Expand
across 600 MediaCentral installations Customer C Land
▪ We’ve only converted 1/3 of the current Avid base
▪ Once we land with the platform, value to Expand
customer is compelling, switching costs are high Expand
▪ Positions us more strategically with customer for Customer B Land
enterprise-level commercial engagements
▪ Drives further shift to recurring and growing Expand
backlog
Expand
Customer A Land
2016 2017 2018 2019 2020 2021
Avid ©2017 21Transformation has improved financials
Implied Guid
Mid Pt
AFX $M 2013 2014 2015 2016 2017
Operational Revenue (a) 439 439 425 435 417
▪ Overall results have built a stronger foundation for the
Pre-2011 Revenue (b) 124 92 59 25 1 company’s future and growth
Elim PCS (c) 0 0 23 53 2
Amort of acquired deferred revenue 0 0 (1) (1) 0
GAAP Revenue 563 530 506 512 420 ▪ The composition of the revenue has changed and the
Cost of Goods Sold 222 204 193 171 43 visibility has increased
Gross Margin 342 327 313 341 255
Operational Gross Margin 217 235 233 264 252 ▪ A leaner and more directed cost structure to address
% Operational Revenue 50% 54% 55% 61% 60% the industry opportunity has driven higher earnings
Operating Expense 280 270 272 241 217
▪ Turned the corner to profitability with over $90M
Adjusted EBITDA 80 72 55 116 50
Operational Adj EBITDA (44) (19) (25) 39 48 improvement in operational adjusted EBITDA
% Operational Revenue -10% -4% -6% 9% 11%
COGS + OPEX 502 474 465 412 259 ▪ Unbilled backlog approaching $300 million
Backlog (Unbilled) 92 125 204 204 293 (d)
Recurring Revenue as % Total (e) 21% 22% 27% 37%
(a) As a result of (i) the impact of accounting changes effective January 1, 2011, and (ii) changes in the company’s revenue recognition models due to the elimination of Implied PCS in more
recent periods, the calculation of Operational Revenue for 2013 and 2014 is not consistent with other periods presented and is therefore less meaningful for comparison purposes.
(b) Represents revenue from all customer transactions originating prior to 2011. Effective January 1, 2011, due to changes in accounting standards, many of the Company’s products began to
qualify for upfront revenue recognition. Prior to these changes, the same products required ratable recognition over periods of up to eight years. As a result, some of the revenue attributable to
transactions originating prior to 2011 would not have been recognized in subsequent periods had the adoption of the new accounting standard been applied on a retroactive basis.
(c) Represents the impact of accelerated recognition of revenue due to the cessation of implied post-contract customer support (“Implied PCS”) for certain product lines.
(d) As of quarter ending 9/30/2017
(e ) Excludes Enterprise Agreements & Volume Purchase Agreements
Avid ©2017 22Greater China New Partnerships
• Signed five-year agreements with two new partners effective January 1, 2018.
• Digital Media Technology Co. Ltd.
• New Digital Technology Holdings Ltd.
• Partners have exclusive distribution rights to cover all of the Greater China market.
• Each partner will focus on and distribute products to specific end markets where
they have expertise.
• Commercial agreement with Beijing Jetsen Technology Co. Ltd. was terminated as of
the end of December 2017.
• Securities purchase agreement expired without Jetsen acquiring any shares.
• New agreements include performance guarantees with a minimum of between
6-10% growth per annum.
Avid ©2017 23Strategy driving growth and improving visibility
Subscribers and Digital
MediaCentral Platform Adoption
Sales Surging
50,000+ users Paying subscribers up 69%
from Q3’16
27% growth year-over-year Digital sales up 35%
Vehicle for future cross-sales and
maximizing lifetime value of customer over Q3’16
Shift to Recurring Backlog Continues to
Revenue Bookings* Increase Year-Over-Year
41% of Q3’17 Total revenue backlog of $488
13% in Q1’12 (quarter low pre-transformation) million which includes contractually
50% of LTM committed revenue backlog of $293
17% in 2012 (pre-transformation) million
* On constant $ basis.
Avid ©2017 24Q3 2017 – Growth Across Most Categories
Change %
Fav/(UnFav)
($M) Q3 ‘16 Q2 ‘17 Q3 ‘17 Seq YoY
▪ Bookings excluding Greater China up
Bookings – Constant $ $94.7 $104.3 $107.9 3% 14% year-over-year and sequentially
Excl. Greater China 90.4 104.3 107.9 3% 19%
▪ Revenue growing (excluding Pre-2011
Bookings 89.5 98.0 102.8 5% 15%
Excl. Greater China 85.2 98.0 102.8 5% 21%
& Elim PCS) while shifting to recurring
revenue
Non-GAAP Revenue 119.0 102.4 105.3 3% (12%)
Revenue excl. Pre-2011 & Elim PCS 101.7 102.0 105.1 3% 3% ▪ Minimal amount of Pre-2011 & Elim
Pre-2011 & Elim PCS 17.4 0.4 0.1 PCS revenue in Q3; reduced by over
$17M year-over-year
Non-GAAP Gross Margin 77.5 62.1 62.4 0% (20%)
G.M. excl. Pre-2011 & Elim PCS 60.1 61.8 62.3 1% 4%
▪ Efficiency program drives year-over-
% Revenue excl. Pre-2011 & Elim PCS 59.2% 60.5% 59.2%
year reduction in Non-GAAP
Non-GAAP Operating Expenses 58.4 56.6 53.9 5% 8% Operating Expenses
Adjusted EBITDA 22.9 8.9 11.5 30% (50%) ▪ Adjusted Free Cash Flow improves
Adj. EBITDA excl. Pre-2011 & Elim PCS 5.5 8.5 11.4 34% 107% $3.2M year-over-year
Adjusted Free Cash Flow (2.6) 6.2 0.5 (91%) -
Avid ©2017 25Contractually Committed Backlog – Significant Increase
$350
$300 ▪ Total revenue backlog of $488
$293 million which includes
$250 contractually committed backlog
of $293 million
$200
▪ Contractually committed
$M
backlog is bookings
$150 representing future:
▪ Billings
$100 ▪ Revenue
$92 ▪ EBITDA
$50 ▪ Cash
$0
12/31/2013 9/30/2017
Avid ©2017 26Revenue visibility continues to increase
Deferred
Revenue ▪ Entering a quarter,
70-80% approximately 70-80% of
revenue is known
Contractually
Committed ▪ Recurring revenue as a
Backlog percentage of total is increasing
year-over-year
Current Quarter
Bookings
Avid ©2017 27Expense reductions complete; continued refinements ahead
($M) Non-GAAP Operating Expenses (LTM)
$300
$280 ▪ Completed $106M+ savings
▪ 2016 - $76 million
$260 ▪ 2017 - $30 million
-17% YoY
$240
▪ How?
▪ Leveraged development
platform
$220
▪ Aligned talent
▪ Rationalized facilities
$200
$180
Q1'16 Q2'16 Q3'16 Q4'16 Q1'17 Q2'17 Q3'17
Avid ©2017 28Adjusted Free Cash Flow is much improved year-over-year
($M) YTD Adjusted Free Cash Flow
$13.5
+$55.7
$(42.3)
Q1-Q3 2016 Q1-Q3 2017
Avid ©2017 29Non-Recurring Cash Expenses Diminishing in 2017
($M)
$5.5
$5.0 $5.0
$5.0
$4.5 ▪ In 2017, expect
approximately $16
$4.0 million of non-recurring
$3.5 cash expenses
$3.5
▪ In 2018, trend of
$3.0
declining non-recurring
~ $2.5 expected to continue
$2.5
$2.0
$1.5
Q1 2017 Q2 2017 Q3 2017 Q4 2017-F
Avid ©2017 30Cash & Liquidity Strengthening; Covenant Compliance Solid
▪ Cash & Liquidity
▪ September 30, 2017 cash balance - $44.1 million (plus $5 million LOC)
▪ November 6, 2017 closed on expanded loan facility which provided:
• Term Loan Increase – Cash $15M
• Expanded Line of Credit $5M
Incremental Liquidity $20M
▪ Covenant Compliance Considerations
▪ Foreign currency (FX) adjustment
▪ 2017 bonus expense (reversal mechanism)
▪ ASC 606 add-back* (2018 forward)
* Included in the November 6, 2017 debt amendment.
Avid ©2017 31Avid is well positioned today, and for the future…
Our Position Financial Opportunity
▪ Large and growing market ▪ Accelerating revenue growth
▪ Right products, at the right time ▪ Scaling profitability
▪ Consistent management execution ▪ Driving higher cash flow
Avid ©2017 32Avid ©2017 33
You can also read