Q2 2019 Earnings Slides - July 23, 2019 - SNAP's Investor Relations
←
→
Page content transcription
If your browser does not render page correctly, please read the page content below
Q2 2019 Earnings Slides
July 23, 2019
Forward-Looking Statements & Non-GAAP Financial Measures
This presentation contains forward-looking statements about us and our industry that involve substantial risks and uncertainties. All statements other than statements of historical facts
contained in this presentation, including statements regarding guidance, our future results of operations or financial condition, business strategy and plans, user growth and
engagement, product initiatives, and objectives of management for future operations, are forward-looking statements.

In some cases, you can identify forward-looking statements because they contain words such as “anticipate,” “believe,” “contemplate,” “continue,” “could,” “estimate,” “expect,” “going
to,” “intend,” “may,” “plan,” “potential,” “predict,” “project,” “should,” “target,” “will,” or “would” or the negative of these words or other similar terms or expressions.

You should not rely on forward-looking statements as predictions of future events. We have based the forward-looking statements contained in this presentation on our current
expectations and projections about future events and trends that we believe may affect our business, financial condition, results of operations, and prospects. These forward-looking
statements are subject to risks, uncertainties, and other factors, including those described in the sections titled “Risk Factors” and “Management’s Discussion and Analysis of Financial
Condition and Results of Operations” in our most recent quarterly report on Form 10-Q filed with the SEC, which is available on the SEC’s website at www.sec.gov. Additional
information will be made available in our quarterly report on Form 10-Q for the quarter ended June 30, 2019 and other filings that we make from time to time with the SEC.

In addition, the forward-looking statements in this presentation relate only to events as of the date on which the statements are made and are based on information available to us as of
the date of this presentation. We undertake no obligation to update any forward-looking statements made in this presentation to reflect events or circumstances after the date of this
presentation or to reflect new information or the occurrence of unanticipated events, except as required by law. We may not actually achieve the plans, intentions, or expectations
disclosed in our forward-looking statements, and you should not place undue reliance on our forward-looking statements. Our forward-looking statements do not reflect the potential
impact of any future acquisitions, mergers, dispositions, joint ventures, or investments.

This presentation includes certain non-GAAP financial measures. These non-GAAP financial measures, which may be different than similarly titled measures used by other companies,
are presented to enhance investors’ overall understanding of our financial performance and should not be considered a substitute for, or superior to, the financial information prepared
and presented in accordance with GAAP. A reconciliation of GAAP to non-GAAP measures is provided in the appendix of this presentation.

                                                                                                                                                                                             2
Second Quarter Financial Highlights
• Revenue increased 48% YoY to $388 million.
Revenue
• Average revenue per user increased 37% YoY to $1.91.
• Gross margin1 increased to 46%, compared to 30% in Q2 2018.
• Operating loss improved $53 million YoY to $(305) million.
• Net loss improved $98 million YoY to $(255) million.
Operating
Performance
• Adjusted EBITDA improved $90 million YoY to $(79) million.
• Adjusted EBITDA margin improved to (20)%, compared to (64)% in Q2 2018.
• Adjusted EBITDA leverage improved to 72%, compared to 31% in Q2 2018.
• Operating cash flow improved $104 million YoY to $(96) million.
Cash • Free Cash Flow improved $131 million YoY to $(103) million.
• Ending cash and marketable securities of $1.2 billion was nearly flat versus the prior quarter.
1
Excludes stock-based compensation expense and related payroll tax expense, depreciation and amortization, and certain other non-cash or non-recurring items impacting net income (loss) from time to time.
3Business Highlights
We added 13 million Daily Active Users in the second quarter and saw increased engagement across key metrics:
• DAUs were 203 million in Q2 2019, compared to 190 million in Q1 2019 and 188 million in Q2 2018.
• DAUs were up sequentially and year-over-year in each of North America, Europe, and Rest of World.
• DAUs were up sequentially and year-over-year on each of iOS and Android platforms.
• The average number of Snaps created every day grew to more than 3.5 billion in Q2 2019.
We are seeing early results from the improvements of our Android application:
• On the majority of Android devices used by new users, Snapchatters are now sending 7% more Snaps when compared to the old version, which
we believe is an important leading indicator of their long-term retention.
• We saw more than a 10% increase in the retention rate of people who open Snapchat for the first time.
We continue to invest in our Discover platform, with a particular focus on building a sustainable premium content ecosystem:
• Our audience watching content on Discover every day has grown over 35% year-over-year.
• Total daily time spent by Snapchatters watching Discover increased by over 60% year-over-year.
• Total daily time spent by Snapchatters watching Shows, our 3-5 minute premium episodes that are vertically shot and quickly paced, more than
tripled compared to Q2 2018.
• 90% of Snapchatters who completed the first season of “Endless Summer,” a Snap Original produced by Bunim/Murray Productions, went on to
watch season two in its first month.
4Business Highlights (Continued)
We continue to invest in our augmented reality platform:
• We recently launched the next generation of AR Lenses that use deep neural networks to modify a person’s appearance in real-time, and over 200
million Snapchatters played with these new Lenses in the first two weeks.
• The number of Snapchatters submitting new Lenses through Lens Studio every month grew by more than 20% from the prior quarter.
• By the end of Q2 2019, over 500,000 Lenses had been created by our community through Lens Studio.
• We saw more engagement with Lenses created by our community in Q2 2019 than the entirety of 2018.
We launched Snap Games in Q2 2019 to bring the fun of playing games with your friends to Snapchat and foster a scalable ecosystem that
benefits users, developers, and Snap:
• In the past four months, we have worked with our partners to release seven new made-for-Snapchat games for our community, including three
games that allow users to play as their Bitmoji.
We continue to build on and improve Snap Kit, our set of developer tools that allow our partners to bring Snapchat features into their services:
• We more than doubled the number of partner app integrations since the end of 2018.
• 11 apps created by our partners are currently in the top 100 of the iOS App Store and Google Play Store.
We strengthened our platform capabilities to drive improved outcomes for advertisers:
• We started testing our new Instant Create onboarding flow, which generates ads for businesses in three simple steps from their existing assets, be
it their app or their ecommerce storefront.
• We announced the launch of Snap Select, a new way for advertisers to run unskippable Commercials within a curated set of our Shows
programming.
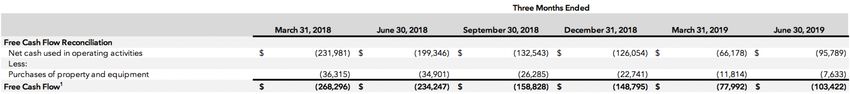
5Free Cash Flow1
(in millions, unaudited)
Cash Used in Operating Activities Capital Expenditures
Q1'18 Q2'18 Q3'18 Q4'18 Q1'19 Q2'19
$(66)
$(96)
$(133) $(126)
$(12)
$(78)
$(199) $(8)
$(232) $(103)
$(23)
$(26)
$(149)
$(159)
$(35)
$(234)
$(36)
$(268)
YoY Change (55)% (2)% 28% 25% 71% 56%
Numbers throughout presentation may not foot due to rounding.
1
We define Free Cash Flow as net cash provided by (used in) operating activities, reduced by purchases of property and equipment. See Appendix for reconciliation of net cash used in operating activities to Free Cash Flow.
6
OPTIMIZING LONG-TERM FREE CASH FLOW; FREE CASH FLOW IMPROVED 56% Y O YCommon Shares Outstanding Plus Shares Underlying Stock-Based Awards
(in millions, unaudited)
Common Shares Outstanding Shares Underlying Stock-Based Awards1
1,544 1,553
1,479 1,476 1,507
1,457
209 181
185 189
202 206
1,318 1,335 1,372
1,254 1,273 1,291
Q1'18 Q2'18 Q3'18 Q4'18 Q1'19 Q2'19
YoY Change 2% 3% 2% 4% 6% 5%
1
Shares underlying stock-based awards include restricted stock units, restricted stock awards, and outstanding stock options. 7
FOCUSED ON MANAGING DILUTION OVER THE LONG TERMRevenue by Geography
(in millions, unaudited)
North America1 Europe2 Rest of World
QUARTERLY REVENUE TRAILING TWELVE MONTHS (TTM)
$1,396
$213
$390 $388
$58 $67 $987 $221
$320
$298 $112
$62 $47 $61
$262 $40
$140
$231 $45
$47
$50
$27
$40
$33
$962
$269 $260
$226 $735
$207
$170 $177
Q1'18 Q2'18 Q3'18 Q4'18 Q1'19 Q2'19 TTM Q2'18 TTM Q2'19
YoY Change 54% 44% 43% 36% 39% 48% 58% 41%
Total revenue for geographic reporting is apportioned to each region based on our determination of the geographic location in which advertising impressions are delivered, as this approximates revenue based on user activity. This allocation is consistent with how we determine ARPU.
8
1
North America includes Mexico, the Caribbean, and Central America.
2
Europe includes Russia and Turkey.
REVENUE UP 48% Y O Y AND 21% Q O Q; TRAILING TWELVE MONTHS REVENUE INCREASED 41% TO $1.4 BILLIONAverage Daily Active Users (DAU)
(in millions, unaudited)
GLOBAL NORTH AMERICA1
+8% +3%
203
191 188 186 186 190
81 80 79 79 80 83
Q1'18 Q2'18 Q3'18 Q4'18 Q1'19 Q2'19 Q1'18 Q2'18 Q3'18 Q4'18 Q1'19 Q2'19
EUROPE2 REST OF WORLD
+5% +21%
62 61 59 60 61 64 56
48 47 47 47 49
Q1'18 Q2'18 Q3'18 Q4'18 Q1'19 Q2'19 Q1'18 Q2'18 Q3'18 Q4'18 Q1'19 Q2'19
We define a Daily Active User, or DAU, as a registered Snapchat user who opens the Snapchat application at least once during a defined 24-hour period. We calculate average Daily Active Users for a particular quarter by adding the number of DAUs on each day of that quarter and dividing that sum by the number of
days in that quarter.
1
2
North America includes Mexico, the Caribbean, and Central America.
Europe includes Russia and Turkey.
9
GLOBAL DAU INCREASED 8% Y O YAverage Revenue Per User (ARPU)
(unaudited)
GLOBAL NORTH AMERICA1
+37% +42%
$3.38
$3.14
$2.81
$2.62
$2.09 $2.10 $2.21
$1.91
$1.60 $1.68
$1.40
$1.21
Q1'18 Q2'18 Q3'18 Q4'18 Q1'19 Q2'19 Q1'18 Q2'18 Q3'18 Q4'18 Q1'19 Q2'19
EUROPE2 REST OF WORLD
+43% +25%
$1.04
$0.95 $1.24 $1.20
$0.85
$0.77 $0.96 $0.97
$0.66 $0.84
$0.53
$0.58
Q1'18 Q2'18 Q3'18 Q4'18 Q1'19 Q2'19 Q1'18 Q2'18 Q3'18 Q4'18 Q1'19 Q2'19
We define ARPU as quarterly revenue divided by the average Daily Active Users. For purposes of calculating ARPU, revenue by user geography is apportioned to each region based on our determination of the geographic location in which advertising impressions are delivered, as this approximates revenue based on
user activity.
1
North America includes Mexico, the Caribbean, and Central America.
2Europe includes Russia and Turkey.
10
GLOBAL ARPU INCREASED 37% Y O YCost of Revenue1
COST OF REVENUE AS A % OF REVENUE COST OF REVENUE COMPOSITION
(in millions, unaudited)
Gross Margin1
Infrastructure Cost
Revenue Share Cost
Other
-16 PPTS +13%
83%
$208
70% $202 $196
$191 $184 $191 $24
64% $28
61% $20 $25 $25
$25
54% $37
52% $32 $26 $39 $35
$24
46%
39%
48%
36%
30% $146
$139 $136 $140 $134 $136
17%
Q1'18 Q2'18 Q3'18 Q4'18 Q1'19 Q2'19 Q1'18 Q2'18 Q3'18 Q4'18 Q1'19 Q2'19
Total Non-GAAP
$5 $8 $7 $11 $8 $8
Exclusions1
1Excludes
11
stock-based compensation expense and related payroll tax expense, depreciation and amortization, and certain other non-cash or non-recurring items impacting net income (loss) from time to time.
COST OF REVENUE INCREASED 13% Y O Y, WHILE REVENUE INCREASED 48% Y O YOperating Expenses1
OPERATING EXPENSES AS A % OF REVENUE OPERATING EXPENSES COMPOSITION
(in millions, unaudited)
Research and Development
Sales and Marketing
General and Administrative
-27 PPTS +5%
112%
$257 $259
$247 $246 $248
94% $238
82% $77 $87
$75 $82 $82
77% $80
67%
61%
$79 $75 $68 $75 $81
$75
$102 $97 $95 $91 $91
$84
Q1'18 Q2'18 Q3'18 Q4'18 Q1'19 Q2'19
Q1'18 Q2'18 Q3'18 Q4'18 Q1'19 Q2'19 Total Non-GAAP
$169 $182 $178 $133 $185 $219
Exclusions1
1Excludes stock-based compensation expense and related payroll tax expense, depreciation and amortization and certain other non-cash or non-recurring items impacting net income (loss) from time to time. 12
Refer to Appendix for description of Reduction in Force Charges and Lease Exit Charges.
OPERATING EXPENSES INCREASED 5% Y O Y AND 4% Q O Q,
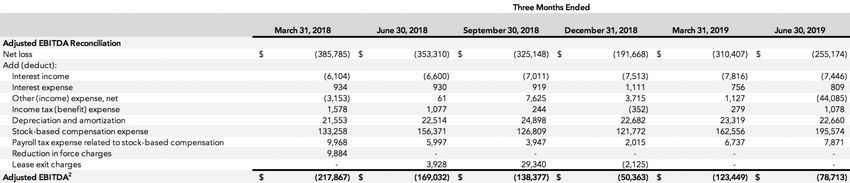
WHILE REVENUE INCREASED 48% Y O Y AND 21% Q O QAdjusted EBITDA1
(in millions, unaudited)
Adjusted EBITDA Margin
QUARTERLY ADJUSTED EBITDA
Q1'18 Q2'18 Q3'18 Q4'18 Q1'19 Q2'19
(13)%
(20)%
$(50) (39)%
(46)%
(64)% $(79)
(94)%
$(123)
$(138)
$(169)
$(218)
1We define Adjusted EBITDA as net income (loss), excluding interest income; interest expense; other income (expense), net; income tax benefit (expense); depreciation and amortization; stock-based compensation expense and related payroll tax expense; and certain other non-cash or non-recurring items impacting net income 13
(loss) from time to time. See Appendix for reconciliation of net loss to Adjusted EBITDA.
Adjusted EBITDA Margin
ADJUSTED EBITDA IMPROVED $90 MILLION Y O Y, AND ADJUSTED EBITDA MARGIN IMPROVED 44 PPTS Y O YFinancial Guidance
The following forward-looking statements reflect our expectations for the third quarter of 2019 as of July 23,
2019, and are subject to substantial uncertainty. This guidance assumes, among other things, that no business
acquisitions, investments, restructurings, or legal settlements are concluded in the quarter. Our results are
based on assumptions that we believe to be reasonable as of this date, but may be materially affected by many
factors, as discussed in “Forward-Looking Statements & Non-GAAP Financial Measures.”
Q3 2019 Outlook
• Revenue is expected to be between $410 million and $435 million, compared to $298 million in Q3 2018.
• Adjusted EBITDA is expected to be between $(85) million and $(60) million, compared to $(138) million in Q3
2018.
14Appendix
Non-GAAP Financial Measures Reconciliation
                  (in thousands, unaudited)

1 Wedefine Free Cash Flow as net cash provided by (used in) operating activities, reduced by purchases of property and equipment.
2
 We define Adjusted EBITDA as net income (loss), excluding interest income; interest expense; other income (expense), net; income tax benefit (expense); depreciation and amortization; stock-based compensation expense and related payroll tax expense; and certain other non-cash or non-recurring items impacting net
income (loss) from time to time. Reduction in force charges in Q1 2018 were primarily composed of severance expense and related payroll tax expense related to a reduction in force plan. Lease exit charges were related to our exit of various operating leases prior to the end of the contractual lease term. The lease exit charges
primarily include the present value of our remaining lease obligation on the cease use dates that occurred during the quarter, net of estimated sublease income. These charges are non-recurring and not reflective of underlying trends in our business.
                                                                                                                                                                                                                                                                                                                                           1
Non-GAAP Financial Measures Reconciliation (Continued)
(in thousands, except per share amounts, unaudited)
Three Months Ended
March 31, 2018 June 30, 2018 September 30, 2018 December 31, 2018 March 31, 2019 June 30, 2019
Non-GAAP Net Loss Reconciliation
Net loss $ (385,785) $ (353,310) $ (325,148) $ (191,668) $ (310,407) $ (255,174)
Amortization of intangible assets 10,824 10,754 10,610 10,441 10,369 9,048
Stock-based compensation expense 133,258 156,371 126,809 121,772 162,556 195,574
Payroll tax expense related to stock-based compensation 9,968 5,997 3,947 2,015 6,737 7,871
Gain on divestiture - - - - - (39,883)
Reduction in force charges 9,884 - - - - -
Lease exit charges - 3,928 29,340 (2,125) - -
Income tax adjustments 220 (339) (253) 84 (115) 376
Non-GAAP net loss1 $ (221,631) $ (176,599) $ (154,695) $ (59,481) $ (130,860) $ (82,188)
Weighted-average common shares - Diluted 1,270,998 1,294,846 1,309,918 1,324,858 1,340,615 1,362,544
Three Months Ended
March 31, 2018 June 30, 2018 September 30, 2018 December 31, 2018 March 31, 2019 June 30, 2019
Non-GAAP diluted net loss per share reconciliation
GAAP diluted net loss per share $ (0.30) $ (0.27) $ (0.25) $ (0.14) $ (0.23) $ (0.19)
Non-GAAP adjustment to net loss 0.13 0.13 0.13 0.10 0.13 0.13
Non-GAAP diluted net loss per share1 $ (0.17) $ (0.14) $ (0.12) $ (0.04) $ (0.10) $ (0.06)
1 We define Non-GAAP Net Loss as net income (loss); excluding amortization of intangible assets; stock-based compensation expense and related payroll tax expense; certain other non-cash or non-recurring items impacting net income (loss) from time to time; and related income tax adjustments. Non-recurring items
include reduction in force charges and lease exit charges as described in the preceding slide. Non-GAAP Net Loss and weighted average diluted shares are then used to calculate Non-GAAP diluted net loss per share. 2Note Regarding User Metrics and Other Data We define a Daily Active User, or DAU, as a registered Snapchat user who opens the Snapchat application at least once during a defined 24-hour period. We calculate average Daily Active Users for a particular quarter by adding the number of DAUs on each day of that quarter and dividing that sum by the number of days in that quarter. We also break out Daily Active Users by geography because certain markets have a greater revenue opportunity and lower bandwidth costs. We define average revenue per user, or ARPU, as quarterly revenue divided by the average DAUs. For purposes of calculating ARPU, revenue by user geography is apportioned to each region based on our determination of the geographic location in which advertising impressions are delivered, as this approximates revenue based on user activity. This allocation differs from our components of revenue disclosure in the notes to our consolidated financial statements, where revenue is based on the billing address of the advertising customer. Unless otherwise stated, statistical information regarding our users and their activities is determined by calculating the daily average of the selected activity for the most recently completed quarter. While these metrics are determined based on what we believe to be reasonable estimates of our user base for the applicable period of measurement, there are inherent challenges in measuring how our products are used across large populations globally. For example, there may be individuals who have multiple Snapchat accounts, even though we forbid that in our Terms of Service and implement measures to detect and suppress that behavior. We have not determined the number of such multiple accounts. Our user metrics are also affected by technology on certain mobile devices that automatically runs in the background of our Snapchat application when another phone function is used, and this activity can cause our system to miscount the user metrics associated with such account. Changes in our products, infrastructure, mobile operating systems, or metric tracking system, or the introduction of new products, may impact our ability to accurately determine active users or other metrics and we may not determine such inaccuracies promptly. We believe that we don’t capture all data regarding all our active users. For example, technical issues may result in data not being recorded from every user’s application. While we believe this underreporting is generally immaterial, we are unable to precisely determine the level of underreporting and for some periods the underreporting may be material. We continually seek to address these technical issues and improve our accuracy, but given the complexity of the systems involved and the rapidly changing nature of mobile devices and systems, we expect underreporting to continue. We do not adjust our reported metrics to reflect this underreporting. Some of our demographic data may be incomplete or inaccurate. For example, because users self-report their dates of birth, our age-demographic data may differ from our users’ actual ages. And because users who signed up for Snapchat before June 2013 were not asked to supply their date of birth, we exclude those users and estimate their ages based on a sample of the self-reported ages we do have. If our DAUs provide us with incorrect or incomplete information regarding their age or other attributes, then our estimates may prove inaccurate and fail to meet investor expectations. 3
Note Regarding User Metrics and Other Data (Continued)
We currently use an analytics platform that we developed and operate and we count a DAU only when a user opens the application and only once per user per day. We believe this
methodology accurately measures our user engagement. We have multiple pipelines of user data that we use to determine whether a user has opened the application during a particular
day and thus is a DAU. This provides redundancy in the event one pipeline of data were to become unavailable for technical reasons, and also gives us redundant data to help measure
how users interact with Snapchat.

If we fail to maintain an effective analytics platform, our metrics calculations may be inaccurate. We regularly review, have adjusted in the past, and are likely in the future to adjust our
processes for calculating our internal metrics to improve their accuracy. As a result of such adjustments, our DAUs or other metrics may not be comparable to those in prior periods. Our
measures of DAUs may differ from estimates published by third parties or from similarly titled metrics of our competitors due to differences in methodology or data used.

                                                                                                                                                                                                 4
You can also read