Investor Presentation - ITT Inc.
←
→
Page content transcription
If your browser does not render page correctly, please read the page content below

ITT Inc.

Investor
Presentation

Safe Harbor

This presentation contains “forward-looking statements” intended to qualify for the safe harbor from liability established by
the Private Securities Litigation Reform Act of 1995. These forward-looking statements are not historical facts, but rather
are based on current expectations, estimates, assumptions and projections about our business, future financial results
and the industry in which we operate, and other legal, regulatory and economic developments. These forward-looking
statements include, but are not limited to, future strategic plans and other statements that describe the company’s
business strategy, outlook, objectives, plans, intentions or goals, and any discussion of future events and future operating
or financial performance.

We use words such as “anticipate,” “estimate,” “expect,” “project,” “intend,” “plan,” “believe,” “target,” “future,” “may,” “will,”
“could,” “should,” “potential,” “continue,” “guidance” and other similar expressions to identify such forward-looking
statements. Forward-looking statements are uncertain and to some extent unpredictable, and involve known and
unknown risks, uncertainties and other important factors that could cause actual results to differ materially from those
expressed or implied in, or reasonably inferred from, such forward-looking statements.

Where in any forward-looking statement we express an expectation or belief as to future results or events, such
expectation or belief is based on current plans and expectations of our management, expressed in good faith and
believed to have a reasonable basis. However, there can be no assurance that the expectation or belief will occur or that
anticipated results will be achieved or accomplished. More information on factors that could cause actual results or
events to differ materially from those anticipated is included in the Risk Factors section of the Company's Annual Report
on Form 10-K, Quarterly Reports on Form 10-Q and other documents filed from time to time with the Securities and
Exchange Commission.

The forward-looking statements included in this presentation speak only as of the date hereof. We undertake no
obligation to update any forward-looking statements, whether as a result of new information, future events or otherwise.

All Results are Unaudited                                                                                                             2
For non-GAAP reconciliations, refer to appendix and www.itt.com/investors

Global Diversified Industrial Leader
Revenue & Adj Margins                                                                              Geography                    Market
  $ Millions                                                                     Adj Op Margin %
  2,900
                                                                                                         9%                      10%
  2,800                                                                2,745         16.5%

  2,700                                                                                            16%
                                                                      15.1%          15.5%                       39%
                                               2,585
  2,600                                                                                                                   31%
                                                                    +200 bps         14.5%                                                     59%
  2,500                                     13.6%
                       2,405
  2,400                                                                                              36%
                      13.1%                                                          13.5%                                       Aero & Rail
  2,300
  2,200                                                                              12.5%
                       2016                    2017                    2018

                                                                                                         North America           Transportation
                                                                                                         Europe                  Industrial
$2.75B                                $367M                                   101%                       Asia Pacific            Energy
Annual Sales                          Adjusted                                3-Yr Average               Rest of World
                                      Operating                               Adjusted FCF
                                      Income                                  Conversion

               10,000                                                       1,000                        30+                    1,000+
               Employees in                                                 Engineers                    Leading Global         Active U.S. Patents
               35 Countries                                                                              Brands

All Results are Unaudited                                                                                                                            3
For non-GAAP reconciliations, refer to appendix and www.itt.com/investors
Q1 2019 Strategic Highlights

              CUSTOMER                                                      OPERATIONAL                  EFFICIENT
              CENTRICITY                                                    EXCELLENCE                    CAPITAL
                                                                                                        DEPLOYMENT

                                              Execution                     +   Accountability   +   Speed

                                                     High Performance Culture

All Results are Unaudited                                                                                            4
For non-GAAP reconciliations, refer to appendix and www.itt.com/investors
Effective Capital Deployment
Capital Deployment Philosophy Balanced Deployment Track Record
Maintain Investment Grade
Balance Sheet ~$800M ~$900M ~$1,000M
in acquisitions in repurchases and in organic
dividends investments
Fund Organic Investments
2012-2019E Aggregate Deployment
• Capital Expenditures That Drive ROIC
Expansion
• Geographic Expansions in China & North
America
• Investments In Auto for Awarded Platforms
• Connected Technologies i-Alert & SmartPad
• New Market Expansions into EV & Rotorcraft
Targeted Acquisitions
• Financial Metrics Delivered
• Close-to-Core & Selected Adjacencies
• All VCs Ready for Inorganic Growth
• Intensified Cultivation of Targets
Growth Dividend
*Includes Both Capital Expenditures & Strategic Investments
All Results are Unaudited 5
For non-GAAP reconciliations, refer to appendix and www.itt.com/investors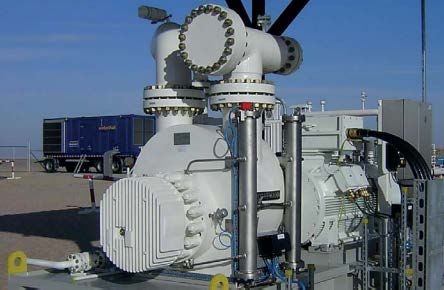
Motion Technologies
Revenue & Adj Margins Long-Term Growth Drivers
$ Millions Adj Op Margin %
1,400 18.5% Growing Global Transportation Powerhouse
18.1% 1,274
• Outgrow Global Markets on Share Gains
1,176
1,200 18.0%
L-T Platform Visibility & ~35% Aftermarket
983 Provide Solid Annual Revenue Foundation
1,000 17.5%
17.2%
World-Class Manufacturing & R&D
16.9%
800 17.0% • Including Ground-Breaking Material Science, Electric
Vehicle Friction, and Rail Technologies
600 16.5%
2016 2017 2018
2018 Revenue Breakdown
Rail &
Other
63%
15% Europe
North
America
21%
Asia
MT
1%
ROW Automotive
All Results are Unaudited 6
For non-GAAP reconciliations, refer to appendix and www.itt.com/investors 6
Connect & Control Technologies
Revenue & Adj Margins Long-Term Growth Drivers
$ Millions Adj Op Margin %
660 20.0% ~60% Aerospace & Defense
647
• Expand Rotorcraft, Composite, & Aftermarket Portfolio
640 • Leverage Scale at Manufacturing Centers of Excellence
16.0%
~40% Gen Industrial, Transportation, Medical, O&G
620 606 +360 bps 15.0%
• Enhanced Product Offerings, Including Medical, Electric
596 Vehicle and O&G Connectors
600 13.5%
12.4% Driving Significant Margin Expansion in 2019
580 10.0%
2016 2017 2018
2018 Revenue Breakdown
Aerospace & Defense
21%
63% Europe
North
America
13%
Asia
CCT
3% General
Industrial O&G
ROW
All Results are Unaudited 7
For non-GAAP reconciliations, refer to appendix and www.itt.com/investors 7
Industrial Process
Revenue & Adj Margins Long-Term Growth Drivers
$ Millions Adj Op Margin %
850 15.0% Strong Goulds Pumps Brand & Reputation in NA
830 827 with Significant Opportunities to Expand Globally
13.0% Leader in North American Chemical & GI Markets
807 11.1%
800 11.0% Leader in Industrial Health Monitoring Technology
+340 bps >40% Aftermarket Revenues
9.0%
7.7% Driving Global Execution
8.9%
750 7.0% • Targeting Triple-Digit Margin Expansion in 2019
2016 2017 2018
2018 Revenue Breakdown
Oil & Gas
7%
58% Europe
North Chemical &
America
16%
10%
Asia
IP Industrial
Pumps
Mining
M. East
9% & Africa
Latin
America
All Results are Unaudited 8
For non-GAAP reconciliations, refer to appendix and www.itt.com/investors 8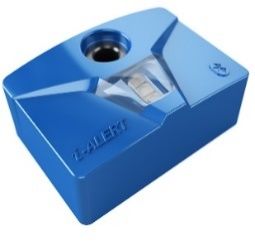
Innovation at ITT

   Ultra-Fast EV Charging Capabilities                                      Advanced Industrial Monitoring Equipment

  •      ITT connector technology enables high-power                           •   ITT IoT technology enables near real-time
         & ultra-fast charging capabilities                                        health monitoring of industrial rotating
                                                                                   equipment
  •      This technology allows charging for a 400km
         range in 15 min and renders e-mobility a                              •   This technology allows predictive maintenance
         reality                                                                   and provides increased productivity and safety
  •      Total EV growth in 2018 +68%                                          •   40K units installed

                                                       Advancing Innovation in Growth Markets
All Results are Unaudited                                                                                                       9
For non-GAAP reconciliations, refer to appendix and www.itt.com/investors                                                           9
Innovation at ITT
Eliminates Need for Gas Flaring Improved Safety & Fuel Efficiency
• ITT twin-screw boosting pump technology • ITT SmartPad and Rotor coating programs aim
enables the elimination of gas flaring to improve braking safety and reduce dust
• Increases production, extends well life, and • Residual drag reduction drives fuel efficiency
simplifies footprint
• Real-time performance data
• Lowers capital & maintenance costs by as
much as 60%
• $77M of orders in 2018
Advancing Innovation in Growth Markets
All Results are Unaudited 10
For non-GAAP reconciliations, refer to appendix and www.itt.com/investors 10ITT Brand Recognition
INDUSTRIAL PROCESS CONNECT & CONTROL
MOTION TECHNOLOGIES
TECHNOLOGIES
Rheinhutte Pumpen Acquisition Announced in February 2019 and Closed in April 2019
All Results are Unaudited 11
For non-GAAP reconciliations, refer to appendix and www.itt.com/investors 11ITT Inc. Supplemental Data
Q1 2019 Results
+1% Organic Orders +5% Organic Revenue
$ millions
2019 vs 2018 (+3% Ex PY Russia Rail Order)
(except EPS)
+11% Oil & Gas: Pump Projects on
+26% Oil & Gas: Upstream and Double-Digit Growth in NA & EU
Downstream Pump Projects
+10% Industrial: +16% Chemical &
+1% Transportation: +62% KONI Rail, Industrial Pumps and +22% Mining
Total
$739 (-3%) +13% Aero & Defense, Partially Offset
Orders +2% Transportation: +15% Aero &
by Auto
Defense; +13% in Rail, Partially Offset
+4% Ex PY Russia Rail Order by Auto
(-3%) Industrial: Strength in IP Industrial
Total Pumps & Valves, Offset by CCT
$696 +1%
Revenue Industrial
Adj Segment +9% Adj Segment OI +18% Adj EPS
Operating $112 +9%
+13% Adj Segment OI, ex (-$4M) FX Segment OI Growth
Income
Manufacturing & Supply Chain Reduced Corporate Costs
Productivity
Adj Favorable Interest & Environmental
Higher Commodity & Tariff Costs
Operating $105 +14%
Income (-$4M) FX Impact Tax Rate Favorability
Strategic Investments, MT Proactively
Funded by Government Incentives
Adjusted
$0.91 +18%
EPS
All Results are Unaudited 13
For non-GAAP reconciliations, refer to appendix and www.itt.com/investorsQ1 2019 Strategic Highlights
$696M Total Revenue +1%; Organic +5%
16.2% Adj Seg OI Margin +120 bps; 15.1% Adj OI Margin +170 bps
Financial Highlights $0.91 Adj EPS +18%
$25M Adj Free Cash Flow +154%
Record Adj Seg OI & Margin, Adj OI & Margin, & Adj EPS
Operational Excellence 7th Consecutive Quarter of Solid Year-Over-Year Segment OI Margin Expansion
Exceptional Execution at KONI, MT Mexico & CCT Connectors
+14% Backlog ex FX, Led by IP +19% & CCT +19%
+47% Project Revenue Strength at IP on Share Gains Across End-Markets
Customer Centricity Over 500 bps MT Friction OEM Outperformance vs Global Market
+135% Friction Pad Awards vs PY
• Includes Major N. America Market Share Win on SUV Platform (Front & Rear Axle)
Rheinhütte Pumpen Acquisition Accelerates Global Expansion at IP
Effective Capital i-Alert Data Analytics Investment to Augment Machine Health Monitoring Strategy
Deployment
CCT New Make vs Buy Strategy
All Results are Unaudited 14
For non-GAAP reconciliations, refer to appendix and www.itt.com/investorsQ1 2019 ITT Adjusted Segment Performance
Connect &
Motion Industrial Total
Control
Technologies Process Segments
Technologies
Q1 2019 Total Revenue vs PY (-7.9%) 13.6% 4.5% 0.9%
FX 6.6% 2.0% 1.5% 4.1%
Acquisition/Disposition 0.0% 0.0% 0.0% 0.0%
Q1 2019 Organic Revenue vs PY (-1.3%) 15.6% 6.0% 5.0%
Q1 2018 Adjusted Operating Margin 18.4% 9.0% 14.8% 15.0%
Volume, Mix, Productivity & Other 1.1% 1.1% 1.9% 1.1%
Growth Investments 0.3% (-0.2%) (-0.1%) 0.1%
Acquisition/Disposition 0.0% 0.0% 0.0% 0.0%
FX (-0.3%) 0.8% 0.2% 0.0%
Q1 2019 Adjusted Operating Margin 19.5% 10.7% 16.8% 16.2%
All Results are Unaudited 15
For non-GAAP reconciliations, refer to appendix and www.itt.com/investors 15Key Performance Indicators & Non-GAAP Measures
Management reviews a variety of key performance indicators including revenue, segment operating income and margins, earnings per share, order
growth, adjusted free cash flow, and backlog, some of which are non-GAAP. In addition, we consider certain measures to be useful to management and
investors when evaluating our operating performance for the periods presented. These measures provide a tool for evaluating our ongoing operations and
management of assets from period to period. This information can assist investors in assessing our financial performance and measures our ability to
generate capital for deployment among competing strategic alternatives and initiatives, including, but not limited to, acquisitions, dividends and share
repurchases. These metrics, however, are not measures of financial performance under accounting principles generally accepted in the United States of
America (GAAP) and should not be considered a substitute for measures determined in accordance with GAAP. We consider the following non-GAAP
measures, which may not be comparable to similarly titled measures reported by other companies, to be key performance indicators for purposes of our
reconciliation tables.
Organic Revenue and Organic Orders are defined as revenue and orders, excluding the impacts of foreign currency fluctuations, acquisitions and
divestitures. Divestitures include sales of portions of our business that did not meet the criteria for presentation as a discontinued operation. The period-
over-period change resulting from foreign currency fluctuations is estimated using a fixed exchange rate for both the current and prior periods.
Management believes that reporting organic revenue and organic orders provides useful information to investors by helping identify underlying trends in
our business and facilitating easier comparisons of our revenue performance with prior and future periods and to our peers.
Adjusted Operating Income, Adjusted Segment Operating Income, Adjusted Operating Margin, and Adjusted Segment Operating Margin are
defined as total operating income and segment operating income, adjusted to exclude special items that include, but are not limited to, asbestos-related
costs, restructuring costs, realignment costs, certain acquisitions-related expenses, and unusual or infrequent operating items. Special items represent
significant charges or credits that impact the current results, which management views as unrelated to the Company's ongoing operations and
performance. Adjusted operating margin and adjusted segment operating margin are defined as adjusted operating income or adjusted segment operating
income divided by total revenue. We believe that adjusted operating income and segment operating income are useful to investors and other users of our
financial statements in evaluating ongoing operating profitability, as well as in evaluating operating performance in relation to our competitors.
Adjusted Income from Continuing Operations, Adjusted EPS and Adjusted EPS Guidance are defined as income from continuing operations
attributable to ITT Inc. and income from continuing operations attributable to ITT Inc. per diluted share, adjusted to exclude special items that include, but
are not limited to, asbestos-related costs, restructuring costs, realignment costs, certain acquisition-related expenses, income tax settlements or
adjustments, and unusual and infrequent non-operating items. Special items represent significant charges or credits, on an after-tax basis, that impact
current results, which management views as unrelated to the Company's ongoing operations and performance. The after-tax basis of each special item is
determined using the jurisdictional tax rate of where the expense or benefit occurred. We believe that adjusted income from continuing operations is useful
to investors and other users of our financial statements in evaluating ongoing operating profitability, as well as in evaluating operating performance in
relation to our competitors.
Adjusted Free Cash Flow is defined as net cash provided by operating activities less capital expenditures, adjusted for cash payments for restructuring
costs, realignment actions, net asbestos cash flows and other significant items that impact current results which management views as unrelated to the
Company's ongoing operations and performance. Due to other financial obligations and commitments, including asbestos, the entire free cash flow may
not be available for discretionary purposes. We believe that adjusted free cash flow provides useful information to investors as it provides insight into the
cash flow metric used by management to monitor and evaluate cash flows generated by our operations.
Working Capital is defined as the sum of net receivables, net inventory and current contract assets less accounts payable and current contract liabilities.
We believe that working capital provides useful information to investors as it also provides insight into the cash flow metric used by management to
monitor and evaluate cash flows generated by our operations.
All Results are Unaudited 16
For non-GAAP reconciliations, refer to appendix and www.itt.com/investorsITT Inc. Non-GAAP Reconciliation
Reported vs. Organic Revenue / Order Growth
First Quarter 2019 & 2018
(In Millions)
(As Reported - GAAP) (As Adjusted - Organic)
(A) (B) (C) (D) (E) (F) = A-D-E (G) =C-D-E (H) = G / B
Acquisition /
Change % Change Divestitures FX Impact Revenue / Orders Change % Change
3M 2019 3M 2018 2019 vs. 2018 2019 vs. 2018 3M 2019 3M 2019 3M 2019 Adj. 2019 vs. 2018 Adj. 2019 vs. 2018
Revenue
ITT Inc. $ 695.5 $ 689.3 $ 6.2 0.9% - $ (28.6) $ 724.1 $ 34.8 5.0%
Motion Technologies 315.2 342.2 (27.0) (7.9%) - (22.5) 337.7 (4.5) (1.3%)
Industrial Process 215.7 189.8 25.9 13.6% - (3.8) 219.5 29.7 15.6%
Connect & Control Technologies 165.0 157.9 7.1 4.5% - (2.4) 167.4 9.5 6.0%
Orders
ITT Inc. $ 738.9 $ 761.2 $ (22.3) (2.9%) - $ (33.0) $ 771.9 $ 10.7 1.4%
Motion Technologies 331.5 369.9 (38.4) (10.4%) - (25.5) 357.0 (12.9) (3.5%)
Industrial Process 219.0 210.1 8.9 4.2% - (4.7) 223.7 13.6 6.5%
Connect & Control Technologies 189.1 181.8 7.3 4.0% - (2.8) 191.9 10.1 5.6%
Note: Excludes intercompany eliminations
Immaterial differences due to rounding
All Results are Unaudited 17
For non-GAAP reconciliations, refer to appendix and www.itt.com/investors 17ITT Inc. Non-GAAP Reconciliation
Reported vs Adjusted Segment Operating Income & Operating Margin
First Quarter 2019 & 2018
(In Millions)
3M 2019 3M 2019 3M 2019 3M 2018 3M 2018 3M 2018 % Change % Change
Special Special As Reported As Adjusted
As Reported Items As Adjusted As Reported Items As Adjusted 2019 vs. 2018 2019 vs. 2018
Revenue:
Motion Technologies $ 315.2 $ 315.2 $ 342.2 $ 342.2 (7.9%) (7.9%)
Industrial Process 215.7 215.7 189.8 189.8 13.6% 13.6%
Connect & Control Technologies 165.0 165.0 157.9 157.9 4.5% 4.5%
Intersegment eliminations (0.4) (0.4) (0.6) (0.6)
Total Revenue $ 695.5 $ 695.5 $ 689.3 $ 689.3 0.9% 0.9%
Operating Margin:
Motion Technologies 19.3% 20 BP 19.5% 18.1% 30 BP 18.4% 120 BP 110 BP
Industrial Process 10.3% 40 BP 10.7% 8.9% 10 BP 9.0% 140 BP 170 BP
Connect & Control Technologies 16.6% 20 BP 16.8% 14.6% 20 BP 14.8% 200 BP 200 BP
Total Operating Segments 15.9% 30 BP 16.2% 14.8% 20 BP 15.0% 110 BP 120 BP
Income (loss):
Motion Technologies $ 60.9 0.7 $ 61.6 $ 61.9 1.0 $ 62.9 (1.6%) (2.1%)
Industrial Process 22.2 0.8 23.0 16.9 0.1 17.0 31.4% 35.3%
Connect & Control Technologies 27.4 0.4 27.8 23.0 0.4 23.4 19.1% 18.8%
Total Segment Operating Income $ 110.5 $ 1.9 $ 112.4 $ 101.8 1.5 $ 103.3 8.5% 8.8%
Note: Immaterial differences due to rounding.
Special items include, but are not limited to, restructuring and realignment costs, certain asset impairment charges, acquisition-related expenses,
and other unusual or infrequent operating items including certain legal matters.
All Results are Unaudited 18
For non-GAAP reconciliations, refer to appendix and www.itt.com/investors 18ITT Inc. Non-GAAP Reconciliation
Reported vs. Adjusted Income from Continuing Operations & Adjusted EPS
First Quarter 2019 & 2018
(In Millions, except per share amounts)
Percent Change
Q1 2019 Non-GAAP Q1 2019 Q1 2018 Non-GAAP Q1 2018 2019 vs. 2018 2019 vs. 2018
As Reported Adjustments As Adjusted As Reported Adjustments As Adjusted As Adjusted As Adjusted
Segment Operating Income $ 110.5 $ 1.9 #A $ 112.4 $ 101.8 $ 1.5 #A $ 103.3
Corporate (Expense) (19.9) 12.3 #B (7.6) 8.8 (19.9) #B (11.1)
Operating Income 90.6 14.2 104.8 110.6 (18.4) 92.2
Interest Income (Expense) 1.1 - 1.1 (0.7) - (0.7)
Other Income (Expense) (0.6) - (0.6) (1.1) - (1.1)
Income from Continuing Operations before Tax 91.1 14.2 105.3 108.8 (18.4) 90.4
Income Tax (Expense) (19.7) (4.5) #C (24.2) (7.6) (13.9) #C (21.5)
Income from Continuing Operations 71.4 9.7 81.1 101.2 (32.3) 68.9
Less: Non Controlling Interest 0.1 - 0.1 0.1 0.1
Income from Continuing Operations - ITT Inc. $ 71.3 $ 9.7 $ 81.0 $ 101.1 $ (32.3) $ 68.8
EPS from Continuing Operations $ 0.80 $ 0.11 $ 0.91 $ 1.14 $ (0.37) $ 0.77 0.14 18.2%
Note: Amounts may not calculate due to rounding.
#A - 2019 includes restructuring and realignment ($1.6M) and a legal accrual ($0.3M).
#A - 2018 includes restructuring costs ($0.9M) and acquisition related costs ($0.6M).
#B - 2019 includes asbestos related expense ($12.6M) and other income primarily from the sale of excess property ($0.3M).
#B - 2018 includes asbestos related benefit ($19.7M) and certain income associated primarily with the sale of excess property ($0.2M).
Note: ($19.7M) net asbestos related benefit includes a favorable settlement agreement ($32.1M) offset by asbestos related expense to maintain 10 year accrual ($12.4M).
#C - 2019 includes various tax-related special items including tax benefit for valuation allowance change ($1.9M), tax benefit for tax law changes ($0.9M), tax expense on future distribution of foreign earnings ($2.8M),
and the tax impact of other operating special items.
#C - 2018 includes various tax-related special items including tax benefit for valuation allowance change ($22.1M), tax expense for tax law changes ($0.5M), tax expense on future distribution of foreign earnings ($3.7M),
and the tax impact of other operating special items.
All Results are Unaudited 19
For non-GAAP reconciliations, refer to appendix and www.itt.com/investors 19ITT Inc. Non-GAAP Reconciliation
Net Cash - Operating Activities vs. Adjusted Free Cash Flow Conversion
First Quarter 2019 & 2018
(In Millions)
3M 2019 3M 2018
Net Cash - Operating Activities $ 42.1 $ 42.4
Capital expenditures 29.2 28.7
Free Cash Flow 12.9 13.7
Insurance settlement agreement - (19.0)
Asbestos cash payments, net 9.9 12.8
Restructuring cash payments 1.8 2.4
Acquisition / Realignment-related cash payments - (0.2)
Adjusted Free Cash Flow 24.6 9.7
Income from Continuing Operations - ITT Inc. 71.3 101.1
Special Items, net of tax 9.7 (32.3)
Income from Continuing Operations - ITT Inc., Excluding
Special Items $ 81.0 $ 68.8
Adjusted Free Cash Flow Conversion 30.4% 14.1%
All Results are Unaudited 20
For non-GAAP reconciliations, refer to appendix and www.itt.com/investors 20ITT Inc. Non-GAAP Reconciliation
GAAP vs. Adjusted EPS Guidance
Full Year 2019
2019 Full-Year Guidance
Low High
EPS from Continuing Operations - GAAP $ 2.78 $ 3.06
Estimated Asbestos Related Costs, Net of Tax 0.47 0.39
$ 3.25 $ 3.45
Estimated Restructuring, Realignment and Other Costs, Net of Tax 0.26 0.22
Other Special Tax Items (0.01) (0.01)
EPS from Continuing Operations - Adjusted $ 3.50 $ 3.66
All Results are Unaudited 21
For non-GAAP reconciliations, refer to appendix and www.itt.com/investors 21You can also read