2020/2021 SORGHUM QUALITY REPORT - U.S. Grains Council
←
→
Page content transcription
If your browser does not render page correctly, please read the page content below
2020/2021 SORGHUM QUALITY REPORT
As a USDA programs participant, the U.S. Grains Council is committed
  to complying with non-discrimination policies from federal, state and
local civil rights laws and those of the USDA. Visit the USDA website page
    (https://www.usda.gov/non-discrimination-statement) for details.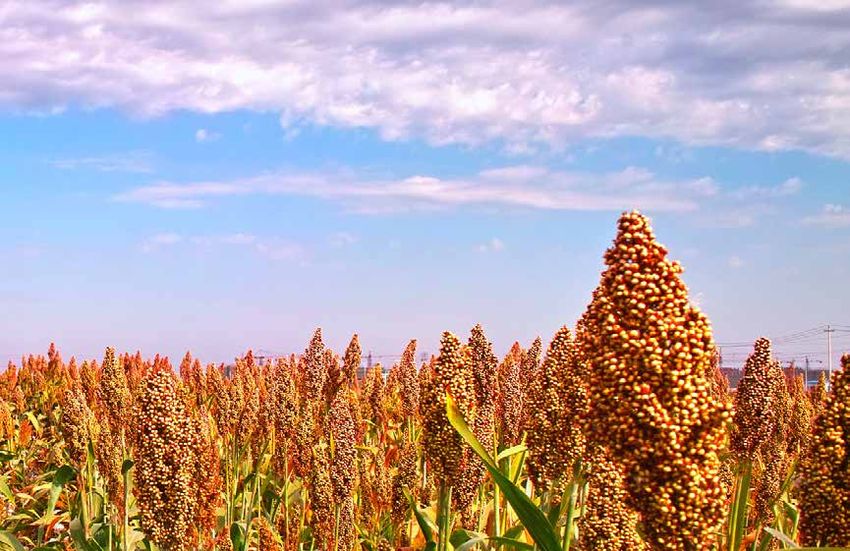
TABLE OF CONTENTS

Introduction...........................................................................................................................ii

Methodology..........................................................................................................................1

Quality Test Results..............................................................................................................2

    A.    Grade Factors........................................................................................................................ 2

    B.    Tannins................................................................................................................................... 6

    C.    Chemical Composition........................................................................................................... 7

    D.    Physical Factors..................................................................................................................... 9

U.S. Sorghum Grades and Conversions.............................................................................. 11

U.S. Grains Council Contact Information (back cover)

                                                                                                         2020/2021 Sorghum Quality Report • i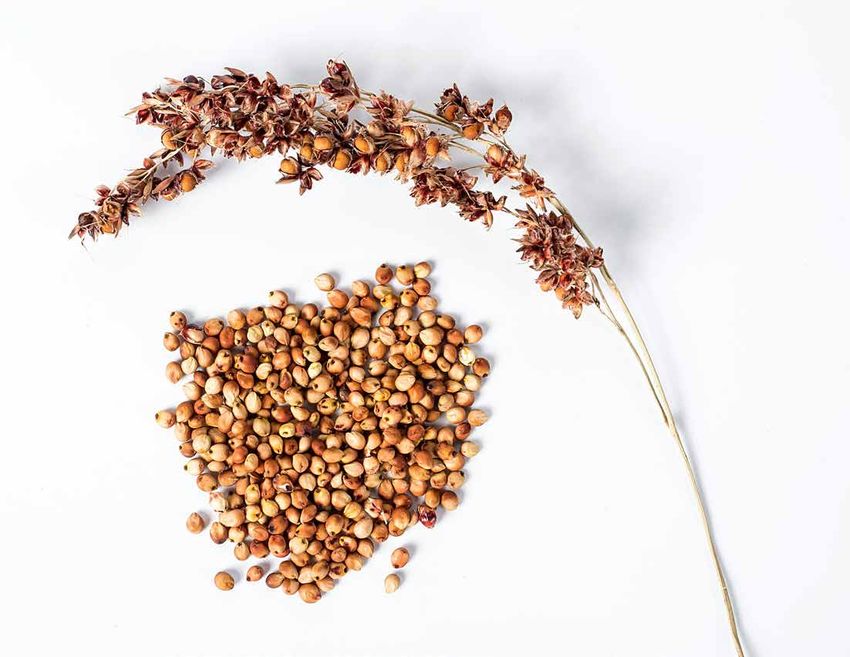
INTRODUCTION

       The U.S. Grains Council (Council) is pleased to present the findings from its
       2020/2021 Sorghum Quality Report. This is the second annual edition of a report
       designed to provide international customers and other interested parties with
       accurate, unbiased information about the quality of the U.S. sorghum crop. A
       total of 108 samples were collected from the outbound shipments of U.S. country
       elevators and large farmers and analyzed for the grade factors established by the
       U.S. Department of Agriculture as well as chemical composition and other quality
       characteristics not reported elsewhere. The results are summarized at the U.S.
       Aggregate level.

       The Council’s mission is one of developing markets, enabling trade and improving
       lives. To help fulfill this mission, the Council is pleased to offer this report as a
       service to our partners. We hope it provides valuable information about the quality
       of U.S. sorghum to our valued trade partners.

ii • 2020/2021 Sorghum Quality Report
METHODOLOGY

Sorghum production in the United States can be grouped into the two main harvest
areas shown in the map below (the Early Harvest Area and the Late Harvest Area). For
this 2020/2021 Sorghum Quality Report, the target population was sorghum from these
two key U.S. sorghum-producing areas representing nearly 100% of the U.S. sorghum
exports.1 The results reflect the quality of blended samples pulled from the outbound
sorghum shipments of U.S. elevators and large sorghum producers.

The targeted number of samples                SORGHUM HARVEST AREAS
were proportionately stratified
according to each sorghum-
producing area’s share of total
U.S. sorghum exports, as shown
on the map.

The Council recruited participating                              Late
elevators across these two areas by                             Harvest
email or phone. Participants were                              81.4%
instructed to collect 2,200 grams                                       Early
(about five pounds) of sorghum                                         Harvest
per sample bag provided. Samples                                       18.6%
were requested to be collected from
individual outbound rail or truck
shipments as the sorghum was
being loaded or from inventories
expected to be shipped for export.

    ● A total of 108 blended sorghum samples from thirteen participating elevators and
      two participating farmers were received from September 30, 2020, through February
      23, 2021. Samples were received by the Amarillo Grain Exchange, Inc. in Amarillo,
      Texas, and tested for the sorghum grade factors. The samples were then sent to the
      Cereal Quality Lab at Texas A&M University in College Station, Texas, for chemical
      composition and physical factor analysis.

    ● Averages and standard deviations for each quality factor were calculated for the
      Early Harvest Area and the Late Harvest Area. The U.S. Aggregate average and
      standard deviation were then calculated based on each Harvest Area’s proportion of
      total U.S. sorghum exports following standard statistical techniques for proportionate
      stratified sampling. The results are reported only for the U.S. Aggregate and not the
      individual Harvest Areas.

1
    Source: USDA NASS and Centrec estimates

                                                                      2020/2021 Sorghum Quality Report • 1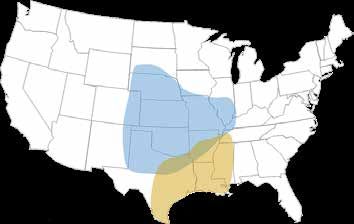
QUALITY TEST RESULTS

   A. GRADE FACTORS
   The U.S. Department of Agriculture’s Federal Grain Inspection Service (FGIS) has
   established numerical grades, definitions and standards for grains. The attributes that
   determine the numerical grades for sorghum are test weight, broken kernels and foreign
   material (BNFM), foreign material, total damage and heat damage.

                                               SUMMARY: GRADE FACTORS
                                                      2020/2021                                            2019/2020
                                     No. of                 Std.                          No. of              Std.
                                    Samples       Avg.      Dev.     Min.     Max.       Samples Avg.         Dev.     Min.   Max.
          U.S. Aggregate
          Test Weight (lb/bu)          108         58.3     1.92     47.8     61.5           68     58.9*     1.59     55.4   62.2
          Test Weight (kg/hl)          108         75.1     2.47     61.5     79.2           68     75.8*     2.04     71.3   80.1
          BNFM (%)                     108         1.6      1.08      0.1      5.7           68      1.7      0.74     0.3    3.9
          Foreign Material (%)         108         0.6      0.45      0.0      3.0           68      0.5      0.40     0.0    2.4
          Total Damage (%)             108         0.0      0.26      0.0      3.0           68      0.2      0.89     0.0    6.9
          Heat Damage (%)              108         0.0      0.00      0.0      0.0           68      0.0      0.00     0.0    0.0
          *
           Indicates that the 2020 average is significantly different from the respective year.

2 • 2020/2021 Sorghum Quality Report
QUALITY TEST RESULTS
TEST WEIGHT
Test weight is defined as the weight of grain required to fill a specific volume
(Winchester bushel). This measure of bulk density is often used as a general indicator
of overall quality and as a gauge of endosperm hardness for value-added processing.
The test involves filling a test cup of known volume through a funnel held at a
specific height above the test cup to the point where grain begins to pour over the
sides of the test cup. A strike-off stick is used to level the grain in the test cup, and
the grain remaining in the cup is weighed. The weight is then converted to and
reported in the traditional U.S. unit, pounds
per bushel (lb/bu). Results are also reported TEST WEIGHT (lb/bu & kg/hl)
in kilograms per hectoliter (kg/hl) in this TestU.S.
Test Weight AGGREGATE
(both)
Weight (both) RESULTS SUMMARY
report. The average and standard deviation
for the 2020/2021 samples were the following: 58.9 58.9
(75.8) (75.8)
● Average: 58.3 lb/bu (75.1 kg/hl), 58.3 58.3
lower than 2019/2020 (58.9 lb/bu or (75.1) (75.1)
75.8 kg/hl) but above the minimum
for U.S. No. 1 grade (57.0 lb/bu or
73.4 kg/hl)
● Standard deviation: 1.92 lb/bu
MY19/20
MY19/20 MY20/21
MY20/21
(2.47 kg/hl), higher than 2019/2020
(1.59 lb/bu or 2.04 kg/hl)
2020/2021 Sorghum Quality Report • 3QUALITY TEST RESULTS
BROKEN KERNELS AND FOREIGN MATERIAL
Broken kernels and foreign material (BNFM), an indicator of the amount of clean, sound
sorghum available for feed and processing, is reported as the sum of broken kernels as
a percent of the dockage-free sample weight and the foreign material.
Broken kernels is defined as all material that passes through a 5/64th -inch triangular-
hole sieve and over a 2.5/64th -inch round-hole sieve.
Foreign material is defined as all material, except sorghum, that remains on top of
the 5/64th -inch triangular-hole sieve and all matter other than sorghum, which passes
over a No. 6 riddle. Foreign material is reported as a sum of the mechanically-
separated foreign material as a percent of
the dockage-free sample weight and the BNFM (%)
handpicked foreign material as a percent BNFM (%) U.S.
BNFM (%)AGGREGATE RESULTS SUMMARY
of the handpicked sample portion weight.
The average and standard deviation for the
2020/2021 samples were the following:
1.7 1.7
● Average: 1.6%, similar to 2019/2020
1.6 1.6
(1.7%) and below the maximum for
U.S. No. 1 grade (3.0%)
● Standard deviation: 1.08%,
higher than 2019/2020 (0.74%)
MY19/20
MY19/20 MY20/21
MY20/21
FOREIGN MATERIAL
Foreign material, a part of BNFM, consists FOREIGN MATERIAL (%)
of non-sorghum material and dust. Foreign Foreign Material
U.S.Material
Foreign AGGREGATE
(%) (%) RESULTS SUMMARY
material is generally higher in moisture
content than the sorghum itself and reduces
feed and processing value. The average and
standard deviation for the 2020/2021 samples 0.6 0.6
were the following: 0.5 0.5
● Average: 0.6%, similar to 2019/2020
(0.5%) and below the maximum for
U.S. No. 1 grade (1.0%)
MY19/20
MY19/20 MY20/21
MY20/21
● Standard deviation: 0.45%,
similar to 2019/2020 (0.40%)
4 • 2020/2021 Sorghum Quality ReportQUALITY TEST RESULTS
TOTAL DAMAGE
Total damage is the percentage of kernels and pieces of kernels that are damaged
in some way. A representative working sample of 15 grams of BNFM-free sorghum is
visually examined by a properly trained individual for the content of damaged kernels.
Types of damage include germ-damaged kernels, ground- or weather-damaged kernels,
diseased kernels, frost-damaged kernels, heat-damaged kernels, insect-bored kernels,
mold-damaged kernels (surface or internal), mold-like substance, purple-pigment-
damaged kernels and sprout-damaged kernels. Total damage is reported as the weight
percentage of the working sample that is total damaged grain.
● Average: 0.0%, similar to 2019/2020 TOTAL DAMAGE (%)
(0.2%) and below the maximum for TotalU.S.
Total Damage (%) AGGREGATE
Damage (%) RESULTS SUMMARY
U.S. No. 1 grade (2.0%)
● Standard deviation: 0.26%,
lower than to 2019/2020 (0.89%)
0.2 0.2
0.0 0.0
MY19/20
MY19/20 MY20/21
MY20/21
HEAT DAMAGE
Heat damage is a subset of total damage and consists of kernels and pieces of sorghum
kernels that are materially discolored and damaged by heat. It occurs during heated
air drying or in storage. Heat-damaged kernels are determined by a properly trained
individual visually inspecting a 15-gram sample of BNFM-free sorghum. Heat damage,
if found, is reported separately from total damage. The average for the 2020/2021
samples was the following:
● Average: 0.0%, no heat damage was observed, same as in 2019/2020
2020/2021 Sorghum Quality Report • 5QUALITY TEST RESULTS
B. TANNINS
Tannins are present in sorghum varieties that have a pigmented testa within
their kernels. Tannins affect nutritional and functional properties as a result of
interactions of the tannins in sorghum-containing rations. Values near or below
4.0 mg catechin equivalents (CE) per gram (g) sample by this method generally
imply the absence of condensed tannins. Type III tannin sorghums usually have
values greater than 8.0 mg CE/g.
Leucoanthocyanidins (catechins) and proanthocyanidins (tannins) are a class of
flavonoids known as flavanols that react with vanillin in the presence of mineral acids
to produce a red color. Vanillin reacts with flavanols, but other flavonoid compounds
can give specific color development. The test involves grinding approximately 50 g of
sound seed using a UDY grinder with a 1-mm sieve and accurately weighing 0.30 g of
this sample for analysis. Extraction and analysis are performed using the vanillin-HCl
test with blank subtraction to remove interference by sorghum pigments. Developed
color is measured using a UV-Vis spectrophotometer at 500 nanometers. A standard
curve is run using pure catechin. Tests are run in triplicates, and the average value is
reported as mg CE/g sample on a dry basis.
Tannins (mg CE/g) DON'T CHANGE THE FONT SIZE ON THIS CHART
● Tannin levels in all 108 samples were less than 4.0 mg CE/g, implying an absence
of tannins, the same as in 2019/2020.
TANNINS (%)
PERCENT OF SAMPLE BY CROP YEAR
2019/2020 2020/2021
100.0 100.0
0.0 0.0 0.0 0.0QUALITY TEST RESULTS
C. CHEMICAL COMPOSITION
Chemical composition of sorghum is important because the components of protein,
starch and oil are of significant interest to end-users. These attributes provide
additional information related to nutritional value for livestock and poultry feeding
and other processing uses of sorghum. Chemical composition tests for protein, oil
and starch were conducted using an approximately 50-gram sample in a Perten DA
7250 Near-Infrared Reflectance (NIR) instrument. Results are reported on a dry basis
(percent of non-water material).
SUMMARY: CHEMICAL FACTORS
2020/2021 2019/2020
No. of Std. No. of Std.
Samples Avg. Dev. Min. Max. Samples Avg. Dev. Min. Max.
U.S. Aggregate
Protein (Dry Basis %) 108 11.2 0.79 9.3 12.8 68 10.4* 0.76 9.0 13.1
Starch (Dry Basis %) 108 72.6 1.01 69.1 75.2 68 72.1* 1.21 68.5 74.6
Oil (Dry Basis %) 108 4.7 0.20 3.9 5.2 68 4.7 0.26 3.4 5.1
*
Indicates that the 2020 average is significantly different from the respective year.
PROTEIN
Protein is very important for poultry PROTEIN (Dry Basis %)
and livestock feeding, as it supplies Protein (Dry U.S.
Protein
Basis AGGREGATE
(Dry
%)Basis %) RESULTS SUMMARY
essential sulfur-containing amino acids
and improves the feed conversion
efficiency. Protein is usually inversely 11.2 11.2
related to starch concentration. Results
are reported on a dry basis. The average 10.4 10.4
and standard deviation for the 2020/2021
samples were the following:
● Average: 11.2%, higher than
2019/2020 (10.4%) MY19/20
MY19/20 MY20/21
MY20/21
● Standard deviation: 0.79%,
similar to 2019/2020 (0.76%)
2020/2021 Sorghum Quality Report • 7QUALITY TEST RESULTS
STARCH
Starch is related to metabolizable energy STARCH (Dry Basis %)
for livestock and poultry. High starch Starch (Dry U.S.(Dry
Starch
Basis AGGREGATE
%)Basis %) RESULTS SUMMARY
concentration is often indicative of good
kernel maturation/filling conditions and
reasonably moderate kernel densities. 72.6 72.6
Results are reported on a dry basis. The
average and standard deviation for the 72.1 72.1
2020/2021 samples were the following:
● Average: 72.6%, similar to
2019/2020 (72.1%)
MY19/20
MY19/20 MY20/21
MY20/21
● Standard deviation: 1.01%,
similar to 2019/2020 (1.21%)
OIL
Oil is an essential component of poultry and OIL (Dry Basis %)
livestock rations. It serves as an energy Oil (Dry BasisU.S.
Oil (Dry AGGREGATE
%)Basis %) RESULTS SUMMARY
source, enables fat-soluble vitamins to be
utilized and provides certain essential fatty
acids. Oil may also be an important co- 4.7 4.7 4.7 4.7
product of sorghum value-added processing.
Results are reported on a dry basis. The
average and standard deviation for the
2020/2021 samples were the following:
● Average: 4.7%, same as 2019/2020
MY19/20
MY19/20 MY20/21
MY20/21
● Standard deviation: 0.20%,
lower than 2019/2020 (0.26%)
8 • 2020/2021 Sorghum Quality ReportQUALITY TEST RESULTS
D. PHYSICAL FACTORS
Physical factors include other quality attributes that are neither grading factors nor
chemical composition. Tests for physical factors provide additional information about
the processing characteristics of sorghum for various uses, as well as its storability and
potential for breakage in handling.
SUMMARY: PHYSICAL FACTORS
2020/2021 2019/2020
No. of Std. No. of Std.
Samples Avg. Dev. Min. Max. Samples Avg. Dev. Min. Max.
U.S. Aggregate
Kernel Diameter (mm) 108 2.48 0.13 2.20 2.85 68 2.57* 0.10 2.28 2.82
1000-Kernel Weight (g) 108 25.02 2.72 19.09 31.71 68 26.58* 2.11 22.60 31.99
Kernel Hardness Index 108 67.1 5.6 48.1 83.7 68 70.9* 6.1 50.2 85.3
*
Indicates that the 2020 average is significantly different from the respective year.
KERNEL DIAMETER
Kernel diameter directly correlates with kernel volume, affects material handling
practices and may indicate the maturity of kernels.
Kernel diameter is measured using a KERNEL DIAMETER (mm)
Perten Single Kernel Characterization U.S.Diameter
Kernel Diameter
Kernel AGGREGATE
(mm) (mm) RESULTS SUMMARY
System (SKCS 4100). The instrument
records the individual diameter of 300
seeds and calculates the average seed
diameter in millimeters (mm). The average 2.57 2.57
and standard deviation for the 2020/2021 2.48 2.48
samples were the following:
● Average: 2.48 mm, lower than
2019/2020 (2.57 mm)
MY19/20
MY19/20 MY20/21
MY20/21
● Standard deviation: 0.13 mm,
higher than 2019/2020 (0.10 mm)
2020/2021 Sorghum Quality Report • 9QUALITY TEST RESULTS
1000-KERNEL WEIGHT
1000-kernel weight (commonly referred to as TKW) is the weight for a fixed number of
kernels and is reported in grams. Kernel volume (or size) can be inferred from TKW. As
TKW increases or decreases, kernel volume will proportionally increase or decrease.
The TKW is determined from the average weight of 300 individual kernel replicates
using the SKCS 4100. The instrument weighs each seed to the nearest 0.01 mg and
automatically calculates the TKW based
on the average weight of the 300 individual 1000-KERNEL WEIGHT (g)
seeds. The average TKW is reported in TKW (g) TKWU.S.
(g) AGGREGATE RESULTS SUMMARY
grams. The average and standard deviation
for the 2020/2021 samples were the
following: 26.58 26.58
● Average: 25.02 g, lower than 25.02 25.02
2019/2020 (26.58 g)
● Standard deviation: 2.72 g,
higher than 2019/2020 (2.11 g)
MY19/20
MY19/20 MY20/21
MY20/21
KERNEL HARDNESS INDEX
Kernel hardness affects mold and insect resistance, size reduction behavior and
sorghum end-use. Grain hardness was measured using the SKCS 4100. The SKCS
4100 automatically selects individual kernels, weighs them, and then crushes them
between a toothed rotor and a progressively narrowing crescent gap. As a kernel is
crushed, the force between the rotor and crescent is measured. About 50 g of clean,
externally intact seed is introduced into the instrument hopper. The instrument then
automatically characterizes 300 individual seeds. The data are reported as average
kernel hardness index, based on the 300
individual seeds. Samples are also classified KERNEL HARDNESS INDEX
as hard, mixed, or soft, depending on the Kernel Hardness
U.S.Hardness
Kernel AGGREGATE
Index Index RESULTS SUMMARY
average hardness index value and hardness
distribution among the 300 seeds. Kernel
hardness index values can range from 20 to
70.9 70.9
120. The average and standard deviation for
the 2020/2021 samples were the following:
67.1 67.1
● Average: 67.1, lower than
2019/2020 (70.9)
● Standard deviation: 5.6,
MY19/20
MY19/20 MY20/21
MY20/21
similar to 2019/2020 (6.1)
10 • 2020/2021 Sorghum Quality ReportU.S. SORGHUM GRADES & CONVERSIONS
U.S. SORGHUM GRADES AND GRADE REQUIREMENTS
Maximum Limits of
Damaged Kernels Broken Kernels and Foreign Material
Minimum Test Heat Foreign Material
Weight per Bushel Damaged Total (part of total) Total
Grade (Pounds) (Percent) (Percent) (Percent) (Percent)
U.S. No. 1 57.0 0.2 2.0 1.0 3.0
U.S. No. 2 55.0 0.5 5.0 2.0 6.0
U.S. No. 31 53.0 1.0 10.0 3.0 8.0
U.S. No. 4 51.0 3.0 15.0 4.0 10.0
U.S. Sample Grade is sorghum that:
(a) Does not meet the requirements for the grades U.S. Nos. 1, 2, 3, or 4; or
(b) Contains 8 or more stones which have an aggregate weight in excess of 0.2 percent of the sample
weight, 2 or more pieces of glass, 3 or more crotalaria seeds (Crotalaria spp.), 2 or more castor
beans (Ricinus communis L.), 4 or more particles of an unknown foreign substance(s) or a commonly
recognized harmful or toxic substance(s), 8 or more cockleburs (Xanthium spp.) or similar seeds
singly or in combination, 10 or more rodent pellets, bird droppings, or an equivalent quantity of other
animal filth in 1,000 grams of sorghum, 11 or more pieces of other material from any combination
of animal filth, castor beans, crotalaria seeds, glass, stones, unknown foreign substances, and
cockleburs; or
(c) Has a musty, sour, or commercially objectionable foreign odor (except smut odor); or
(d) Is badly weathered, heating or otherwise of distinctly low quality.
1
Sorghum which is distinctly discolored shall not grade any higher than U.S. No. 3.
Source: Code of Federal Regulations, Title 7, Part 810, Subpart D, United States Standards for Sorghum
U.S. AND METRIC CONVERSIONS
Sorghum Equivalents Metric Equivalents
1 bushel = 56 pounds (25.40 kilograms) 1 pound = 0.4536 kg
39.368 bushels = 1 metric ton 1 hundredweight = 100 pounds or 45.36 kg
15.93 bushels/acre = 1 metric ton/hectare 1 metric ton = 2204.6 lbs
1 bushel/acre = 62.77 kilograms/hectare 1 metric ton = 1000 kg
1 bushel/acre = 0.6277 quintals/hectare 1 metric ton = 10 quintals
56 lbs/bushel = 72.08 kg/hectoliter 1 quintal = 100 kg
1 hectare = 2.47 acres
2020/2021 Sorghum Quality Report • 11HEADQUARTERS:
20 F Street NW, Suite 900 • Washington, DC 20001
Phone: +1-202-789-0789 • Fax: +1-202-898-0522
Email: grains@grains.org • Website: grains.org .
PEOPLE’S REPUBLIC OF CHINA: Beijing SOUTH ASIA
Tel1: +86-10-6505-1314 • Tel2: +86-10-6505-2320 adcastillo@grains.org
Fax: +86-10-6505-0236 • china@grains.org.cn
JAPAN: Tokyo SOUTH EAST ASIA: Kuala Lumpur
Tel: +81-3-6206-1041 • Fax: +81-3-6205-4960 Tel: +603-2093-6826
japan@grains.org • www.grainsjp.org sea-oceania@grain.org
KOREA: Seoul
Tel: +82-2-720-1891 • Fax: +82-2-720-9008 TAIWAN: Taipei
seoul@grains.org Tel: +886-2-2523-8801 • Fax: +886-2-2523-0189
taipei@grains.org
MEXICO: Mexico City
Tel1: +52-55-5282-0244 • Tel2: +52-55-5282-0973
Tel3: +52-55-5282-0977 • Fax: +52-55-5282-0974 WESTERN HEMISPHERE: Panama City
mexicousg@grains.org Tel: +507-315-1008
panama@grains.org
MIDDLE EAST AND AFRICA: Tunis
Tel: +216-71-191-640 • Fax: +216-71-191-650
tunis@grains.org
Developing Markets • Enabling Trade • Improving LivesYou can also read