FIRST QUARTER 2020 EARNINGS CONFERENCE CALL FEBRUARY 27, 2020

Page created by Charles Meyer
 
CONTINUE READING
FIRST QUARTER 2020 EARNINGS CONFERENCE CALL FEBRUARY 27, 2020
FIRST QUARTER 2020
EARNINGS CONFERENCE CALL
    FEBRUARY 27, 2020
FIRST QUARTER 2020 EARNINGS CONFERENCE CALL FEBRUARY 27, 2020
Safe harbor
FORWARD-LOOKING STATEMENTS
•   This presentation contains certain forward-looking statements within the meaning of the Private Securities Litigation Reform Act of 1995.
    The words “may,” “will,” “expect,” “intend,” “estimate,” “anticipate,” “aspiration,” “objective,” “project,” “believe,” “continue,” “on track” or
    “target” or the negative thereof and similar expressions, among others, identify forward-looking statements. All forward looking statements
    are based on information currently available to management. Such forward-looking statements are subject to certain risks and uncertainties
    that could cause events and the Company’s actual results to differ materially from those forecasted, projected, or anticipated, whether
    expressed or implied. Please see the disclosure regarding forward-looking statements immediately preceding Part I of the Company’s
    Annual Report on the most recently filed Form 10-K. The company undertakes no obligation to update or revise any forward-looking
    statements.
REGULATION G
•   This presentation includes certain non-GAAP financial measures like EBITDA, Adjusted EBITDA and other measures that exclude
    adjustments such as restructuring and other unusual charges and gains that are volatile from period to period. Management of the
    company uses the non-GAAP measures to evaluate ongoing operations and believes that these non-GAAP measures are useful to enable
    investors to perform meaningful comparisons of current and historical performance of the company. All non-GAAP data in the presentation
    are indicated by footnotes. Tables showing the reconciliation between GAAP and non-GAAP measures are available at the end of this
    presentation and on the Greif website at www.greif.com.

                                                                                                                                       February 27, 2020 – P.2
FIRST QUARTER 2020 EARNINGS CONFERENCE CALL FEBRUARY 27, 2020
First Quarter Fiscal Year (FY) 2020 summary
     Financial performance                    Markets and operations                                                                Strategic priority highlights

 •   Net Sales: $1,112.4M, +24% YoY     • RIPS:                                                                                    • Differentiated customer service:
                                              ‒      Improved demand Western/Central                                                       ‒      Q1’20 customer satisfaction index
 •   Gross Profit: $222.6M, +29%                                                                                                                  (CSI) score of 93.9 – 11th straight
                                                     Europe; continued market strength
     YoY                                             in Eastern Europe and Middle                                                                 quarter of improvement
                                                     East/North Africa, offset by                                                  • Sustainability performance:
 •   Adj. EBITDA1: $147.4M, +39%                     continued weakness in the U.S.
     YoY                                                                                                                                   ‒      Recognized on Newsweek’s list of
                                              ‒      IBC volumes +23.5% YoY
                                                                                                                                                  America's Most Responsible
 •   Adj. Class A EPS1: $0.64, flat     • FPS:                                                                                                    Companies 2020
     YoY (higher YoY depreciation and
     interest expense)                        ‒      Continued demand softness in                                                          ‒      Awarded Supplier Engagement
                                                     Western Europe                                                                               Rating (SER) of A by CDP
 •   Adj. Free Cash Flow2: $(13.3)M,    • PPS:                                                                                     • Portfolio optimization:
     +$22.3M YoY
                                              ‒      Containerboard: softer demand                                                         ‒      Entered into a definitive agreement
                                                     resulted in 21K tons of economic                                                             to sell the Consumer Packaging
                                                     downtime; lower YoY published                                                                Group (CPG) to Graphic Packaging
                                                     prices; favorable OCC costs                                                                  (NYSE: GPK) for $85M. Expect the
                                              ‒      Boxboard: stable YoY pricing and                                                             transaction to close by 3/31/2020.
                                                     favorable OCC costs

                                        (1)   A summary of all adjustments that are included in the Adj. EBITDA and Adj. Class A EPS is set forth in the appendix of this presentation.
                                        (2)   Adjusted free cash flow is defined as net cash provided by (used in) operating activities, less cash paid for purchases of
                                              properties, plants and equipment, plus cash paid for acquisition and integration related costs, plus cash paid for acquisition
                                              and integration related Enterprise Resource Planning (ERP) systems.                                                                            February 27, 2020 – P.3
                                        Note: A reconciliation of the differences between all non-GAAP financial measures used in this presentation with the most directly comparable GAAP
                                        financial measures is included in the appendix of this presentation.
FIRST QUARTER 2020 EARNINGS CONFERENCE CALL FEBRUARY 27, 2020
Rigid Industrial Packaging & Services (RIPS) review
      $M                      Q1 2020     Q1 2019                                                           Quarter Highlights:
                                                                                                            •      Net sales down 4.1%, excluding F/X1, from prior year quarter
      Net sales                $568.7      $597.9                                                                  ‒ Solid demand in West/Central/Eastern Europe and the Middle East and
                                                                                                                      North Africa, offset by softness in North America and South East Asia
      Gross profit             $107.8      $98.6                                                                   ‒ Lower average sales price stemming from contractual price adjustments
                                                                                                                      tied to raw material price declines, partially offset by strategic pricing
                                                                                                                      actions
      Adj. EBITDA               $62.5      $48.7                                                                   ‒ Global IBC volumes +23.5%
                                                                                                            •      Adj. EBITDA2 up 28.3% from prior year quarter
      Adj. EBITDA Margin       11.0%       8.1%                                                                    ‒ Lower raw material costs and SG&A expense reduction
                                                                                                                   ‒ Q1’19 was adversely impacted by a one-time $1.5M correction
Intermediate Bulk Container (IBC) line, Chicago

                                                    Solid Q1 performance in a choppy market
                                                    (1) A summary of the adjustments for the impact of currency translation is set forth in the appendix of this presentation.
                                                    (2) A summary of all adjustments that are included in Adjusted EBITDA is set forth in the appendix of this presentation.
                                                    Note: A reconciliation of the differences between all non-GAAP financial measures used in this presentation with the most directly comparable GAAP financial
                                                    measures is included in the appendix of this presentation.                                                                                                     February 27, 2020 – P.4
FIRST QUARTER 2020 EARNINGS CONFERENCE CALL FEBRUARY 27, 2020
Flexible Products & Services (FPS) review
      $M                      Q1 2020     Q1 2019                                                           Quarter Highlights:
      Net sales                 $63.0       $75.1                                                           •       Net sales down 14.6%, excluding F/X1, from prior year quarter

                                                                                                                    ‒      Soft demand conditions in Western Europe and poor start to fertilizer
      Gross profit              $12.3       $17.4                                                                          season

      Adj. EBITDA               $4.1        $7.9                                                            •       Adj. EBITDA2 down 48.1% from prior year quarter

                                                                                                                    ‒      Weak volumes, only partially offset by SG&A expense reduction
      Adj. EBITDA Margin        6.5%        10.5%
                                                                                                                    ‒      Additional variable cost reduction activities underway
2 loop Flexible Intermediate Bulk Containers (FIBC)

                             Soft demand in Western Europe and weak fertilizer season impacted results
                                                    (1) A summary of the adjustments for the impact of currency translation is set forth in the appendix of this presentation.
                                                    (2) A summary of all adjustments that are included in Adjusted EBITDA is set forth in the appendix of this presentation.
                                                    Note: A reconciliation of the differences between all non-GAAP financial measures used in this presentation with the most directly comparable GAAP
                                                    financial measures is included in the appendix of this presentation.                                                                                 February 27, 2020 – P.5
FIRST QUARTER 2020 EARNINGS CONFERENCE CALL FEBRUARY 27, 2020
Paper Packaging & Services (PPS) review
     $M                      Q1 2020      Q1 2019                                                          Quarter Highlights:
                                                                                                           •      Net sales up 118% from prior year quarter
     Net sales                   $473.7   $217.3
                                                                                                                  ‒      Caraustar addition: $288.2M
     Gross profit                $100.1    $53.9                                                                  ‒      Softer containerboard conditions and lower YoY published prices
                                                                                                                  ‒      21K tons of containerboard economic downtime
     Adj. EBITDA                 $77.9     $46.5                                                           •      Adj. EBITDA1 up 68% from prior year quarter
                                                                                                                  ‒      Caraustar Adj. EBITDA contribution: $47.2M
     Adj. EBITDA Margin          16.4%    21.4%

Various tube and core products

                                 Solid Caraustar performance helped offset softness in legacy business
                                                   (1) A summary of all adjustments that are included in Adjusted EBITDA is set forth in the appendix of this presentation.
                                                   Note: A reconciliation of the differences between all non-GAAP financial measures used in this presentation with the most directly comparable GAAP financial
                                                   measures is included in the appendix of this presentation.
                                                                                                                                                                                                                  February 27, 2020 – P.6
FIRST QUARTER 2020 EARNINGS CONFERENCE CALL FEBRUARY 27, 2020
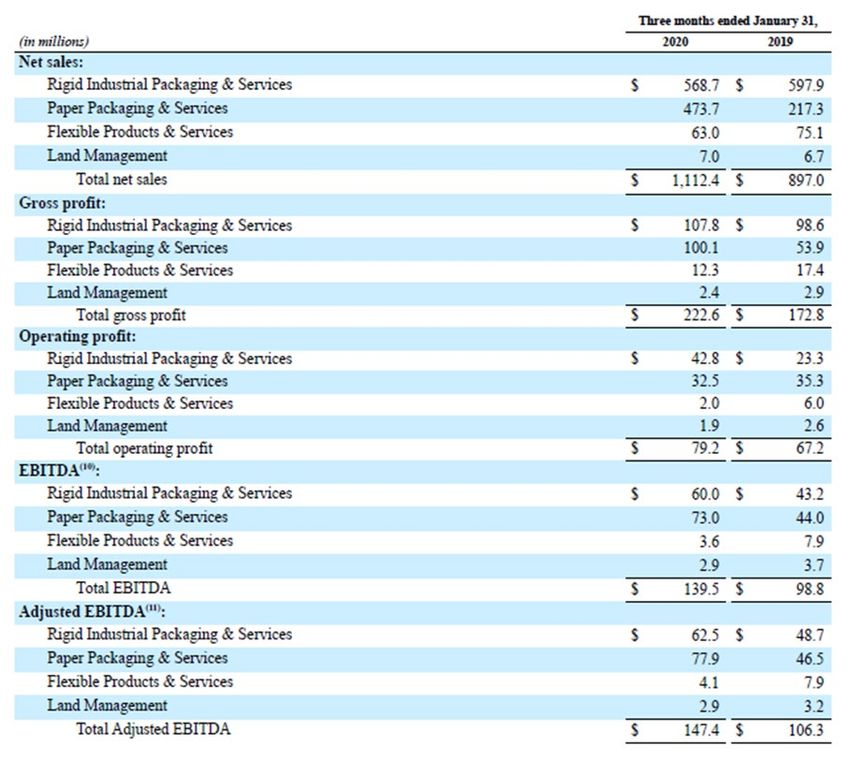
Caraustar integration progressing to plan
      Anticipated synergy over 36 months ($M)               Caraustar recap and integration highlights
$75
                                         At least   •   February 11, 2020 was one year anniversary of Caraustar
                                          $70M          acquisition closing
$70
                                                    •   Caraustar’s strategic rationale continues to be confirmed:
$65
                                                        ‒   Enhanced margins: Greif Adj. EBITDA = 13.2% in Q1’20 vs
$60
                                                            11.6% in Q1’19
$55                                                     ‒   Significant value creation: forecasted synergy capture of
                                                            > $70M, +55% improvement vs. deal assumptions
$50
                                                        ‒   Strong cultural fit and alignment: 99% retention rate
$45
                                                    •   Recent integration highlights:
$40
                                                        ‒   Migrated Caraustar onto Greif standard ERP system
$35
                                                        ‒   Realizing cross-selling opportunities
$30
           Deal      Revised   Revised   Revised
        Assumption    Q2'19     Q3'19     Q4'19

                                                                                                              February 27, 2020 – P.7
FIRST QUARTER 2020 EARNINGS CONFERENCE CALL FEBRUARY 27, 2020
Q1’20 vs. Q1’19: financial comparison
Key financial metrics ($M and $/sh)                                                                                                                       Q1 2020                                        Q1 2019
Net Sales, Excluding the Impact of Currency Translation1                                                                                                   $1,117.9                                       $897.0
Gross Profit                                                                                                                                                 $222.6                                       $172.8
SG&A                                                                                                                                                         $135.4                                       $98.1
Adjusted EBITDA2                                                                                                                                             $147.4                                       $106.3
Interest expense                                                                                                                                              $30.7                                       $11.7
Other expense (income)                                                                                                                                         $1.3                                       $(0.2)
Adjusted Net Income Attributable to Greif, Inc.                                                                                                               $37.9                                       $38.3
Adjusted Class A Earnings Per Share2                                                                                                                          $0.64                                       $0.65
Capital expenditures                                                                                                                                          $37.5                                       $26.0
Adjusted Free Cash Flow3                                                                                                                                    $(13.3)                                      $(35.6)

                                          (1)  A summary of the adjustments for the impact of currency translation is set forth in the appendix of this presentation.
                                          (2)  A summary of all adjustments excluded from the Adj. Class A earnings per share and Adj. EBITDA is set forth in the appendix of this presentation.
                                          (3)  Adjusted free cash flow is defined as net cash provided by (used in) operating activities, less cash paid for purchases of
                                               properties, plants and equipment, plus cash paid for acquisition and integration related costs, plus cash paid for acquisition                                February 27, 2020 – P.8
                                               and integration related Enterprise Resource Planning (ERP) systems.
                                          Note: A reconciliation of the differences between all non-GAAP financial measures used in this presentation with the most directly comparable GAAP financial
                                          measures is included in the appendix of this presentation.
FIRST QUARTER 2020 EARNINGS CONFERENCE CALL FEBRUARY 27, 2020
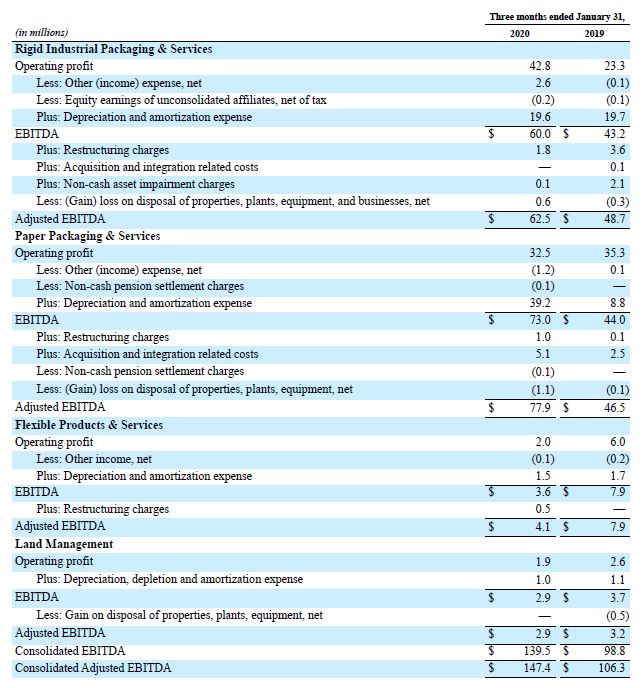
FY20 guidance and key modeling assumptions
Fiscal 2020 guidance1 ($/sh and $M)                                                 FY 2020 Guidance issued at Q1 ‘20                                                      FY 2020 Guidance issued at Q4 ‘19
Adj. Class A Earnings Per Share1                                                                             $3.55 – $3.91                                                                          $3.63 – $4.13
Adjusted Free Cash Flow2                                                                                      $265 – $305                                                                             $245 – $285
Fiscal 2020 key modelling assumptions ($M and %)                                                    FY 2020 Assumption                                                                     FY 2020 Assumption
DD&A expense                                                                                                    No change                                                                             $247 – $257
Interest expense                                                                                                No change                                                                             $119 – $124
Other expense                                                                                                   No change                                                                                $2.5 – 7.5
Net income attributable to noncontrolling interests                                                             No change                                                                                $17 – $22
Non – GAAP tax rate                                                                                             No change                                                                                27 – 31%
Adj. Capital expenditures                                                                                       No change                                                                             $160 – $180

                                          (1)   No reconciliation of the fiscal year 2020 Class A earnings per share before special items guidance, a non-GAAP financial measure which excludes gains and losses on
                                                the disposal of businesses, timberland and property, plant and equipment, acquisition costs, non-cash pension settlement charges, restructuring and impairment charges
                                                is included in this presentation because, due to the high variability and difficulty in making accurate forecasts and projections of some of the excluded information,
                                                together with some of the excluded information not being ascertainable or accessible, we are unable to quantify certain amounts that would be required to be included in
                                                the most directly comparable GAAP financial measure without unreasonable efforts.                                                                                          February 27, 2020 – P.9
                                          (2)   Adjusted free cash flow is defined as net cash provided by (used in) operating activities, less cash paid for purchases of
                                                properties, plants and equipment, plus cash paid for acquisition and integration related costs, plus cash paid for acquisition
                                                and integration related Enterprise Resource Planning (ERP) systems.
FIRST QUARTER 2020 EARNINGS CONFERENCE CALL FEBRUARY 27, 2020
Capital allocation priorities
1
           Reinvest in          •   Fund maintenance to sustain cash generation and advance organic growth opportunities that
          the business              exceed required returns

2
      De-lever the balance      •   Current compliance leverage ratio = ~3.7x
             sheet              •   Aim to achieve targeted leverage ratio of 2.0 – 2.5x by 2023

3
         Return cash to
    shareholders via industry   •   Paid $25.9M in dividends in Q1’20
      leading dividend and      •   Potentially grow dividend once target leverage ratio is achieved
       periodically review

                                          After getting to targeted leverage ratio…
4
            Grow the            •   Capitalize on external growth opportunities (e.g. containerboard integration, IBC/IBC reconditioning)
        business through            that align close to GEF’s core
          material M&A          •   Advance opportunistic capital options if hurdle rates are met and justified by returns

                                                                                                                               February 27, 2020 – P.10
Why invest in Greif?
                                      Compelling customer value
  Robust and diverse product                                              Numerous avenues for          Compelling dividend and
                                          proposition due to
  portfolio with exposure to a                                         incremental low-risk growth      opportunity for free cash
                                      demonstrated commitment
    variety of end markets                                               and margin enhancement             flow expansion
                                         to customer service
     We have leading market           We are pursuing our vision: in    We employ a risk-adjusted       We offer an industry leading
  positions (e.g. steel drum, fiber    industrial packaging, be the      return process that drives    dividend and have significant
    drum, large plastic drum,           best performing customer        capital investment. We are     Free Cash Flow expansion on
  uncoated recycled board) that       service company in the world.     growing close to the core in           the horizon.
    serve a variety of markets        We partner with customers to      plastics and increasing our
              globally.               help solve their problems and     containerboard integration.
                                          grow their businesses.

                                                                                                                             February 27, 2020 – P.11
APPENDIX
Q1 Price, Volume and Foreign Currency Impact to Net Sales for Primary Products:
                                                                                    TOTAL SALES
                                VOLUME             PRICE             FX
                                                                                     VARIANCE

    RIPS NA                               -6.2%             -5.0%          0.2%             -11.0%
                                         ($12.7)           ($10.2)         $0.3              ($22.5)

    RIPS LATAM                            -1.4%            11.6%          -15.4%              -5.2%
                                          ($0.5)            $4.3           ($5.7)             ($1.9)

    RIPS EMEA                             5.3%              -0.9%          -0.9%              3.5%
                                         $12.3              ($2.1)         ($2.2)             $8.1

    RIPS APAC                          -10.4%               -3.0%          -0.5%            -13.9%
                                          ($6.3)            ($1.8)         ($0.3)             ($8.4)

 RIPS Segment                             -1.3%             -1.8%          -1.5%              -4.6%
                                          ($7.2)            ($9.8)         ($7.8)            ($24.8)

 PPS Segment                              -8.6%             -7.0%          0.0%             -15.6%
                                         ($18.6)           ($15.2)         $0.0              ($33.8)

 FPS Segment                           -14.2%               1.8%           -1.5%            -13.9%
                                         ($10.1)            $1.3           ($1.1)             ($9.9)

PRIMARY PRODUCTS                          -4.4%             -2.9%          -1.1%              -8.3%
                                         ($35.9)           ($23.7)         ($8.9)            ($68.5)

RECONCILIATION TO TOTAL COMPANY NET SALES
                                                                                                       NOTES:
                                                                                                       (1) Primary products are manufactured steel, plastic and fibre drums; IBCs (new and reconditioned); linerboard, medium, corrugated sheets and corrugated containers; 1&2 loop and 4 loop FIBCs
                                                                                              -8.2%    (2) Non-primary products include land management; closures; accessories; filling; non- IBC reconditioning; water bottles; pails; and other miscellaneous products / services
NON-PRIMARY PRODUCTS                                                                                   (3) The breakdown of price, volume, FX is not provided for non-primary products due to the difficulty of computation due to the mix, transactions, and other issues
                                                                                              ($6.2)
                                                                                                       (4) Price volume excludes net sales and volume related to Caraustar acquisition
                                                                                                       (5) Var% > 2.5%
TOTAL COMPANY                                                                                 -8.3%    (6) (2.5)% < Var% < 2.5%
                                                                                             ($74.6)   (7) Var% < (2.5)%

                                                                                                                                                                                                                                                            February 27, 2020 – P.13
Key assumptions and sensitivity
                         FY 2020 Foreign Exchange Exposure                                                 Paper Packaging & Services Assumptions & Sensitivity
                                    10% strengthening of the USD;         Cumulative impact       Key PPS stats
Currency
                                          impact to EBITDA                 before hedging
                                                                                                  Containerboard production                   ~1M tons per year
Euro                                         $(9M) – $(11M)                 $(9M) – $(11M)
                                                                                                  URB production                             ~800K tons per year
Next five largest exposures                  $(5M) – $(8M)                  $(14M) – $(19M)
                                                                                                  CRB production                             ~200K tons per year
    Turkish Lira                               $3M – $4M
                                                                                                                                            Every $10/ton increase
    Russia Ruble                             $(3M) – $(4M)                                        OCC sensitivity
                                                                                                                                          = ~$1.2M per month impact

    Singapore Dollar                         $(2M) – $(3M)
                                                                                                  FY2020 OCC assumption                            $38/ton
    British Pound                            $(2M) – $(3M)

    Israeli Shekel                           $(1M) – $(2M)

All remaining exposures                      $(3M) – $(5M)                 $(17M) – $(24M)

•      Greif transacts in more than 25 global currencies

•      Our EBITDA currency exposure profile results in a benefit when the US dollar broadly
       weakens, and we face challenges when the US dollar broadly strengthens

          ‒    Greif has hedges that dampen the currency volatility on both on the current year
               EBITDA as well as the longer term business value of our foreign subsidiaries

•      Our global supply chain and cost structure help to mitigate our foreign exchange
       exposure

                                                                                                                                                             February 27, 2020 – P.14
Becoming a world class customer service organization
            Customer Satisfaction Index (CSI)1                                                                                       NPS Score Evolution
                                                      Expectation

RIPS

                                                                                         Wave 9             6                26                                                   67                              = 61

PPS

                                                                                         Wave 1                 11                        38                                                51
                                                                                                                                                                                                                  = 40
FPS

                                                                                                        0                     20                     40                     60                     80          100
       50        60      70         80           90                    100
                        Q1'20   Q1'19                                                                                          Detractors                  Passives                 Promoters

                                         1PPS CSI for Q4’19 includes Caraustar

                                         Note: CSI is an internal measure of a plant’s or business’ performance against selected parameters that customers experience, giving us an indication of our
                                         level of meeting our customers basic needs. Components include: customer complaints received; customer complaints open greater than 30 days; credits           February 27, 2020 – P.15
                                         raised; number of late deliveries; and the number of deliveries. Also note that consolidated NPS scores may vary slightly from registered promoters and
                                         detractors due to rounding.
Non – GAAP financial measures

  Non-GAAP measures are intended to supplement and should be read together with our
  financial results. They should not be considered an alternative or substitute for, and should
  not be considered superior to, our reported financial results. Accordingly, users of this
  financial information should not place undue reliance on these non-GAAP financial measures.

                                                                                           February 27, 2020 – P.16
GAAP to Non-GAAP reconciliation:
Segment and Consolidated Financials: Q1 2020, Q1 2019

                                                        (11) EBITDA is defined as net income, plus interest expense, net, including debt extinguishment charges, plus income tax expense, plus depreciation, depletion and amortization. However,
                                                        because the Company does not calculate net income by segment, this table calculates EBITDA by segment with reference to operating profit by segment, which, as demonstrated in the table of
                                                        Consolidated EBITDA, is another method to achieve the same result. See the reconciliations in the table of Segment EBITDA.
                                                        (12) Adjusted EBITDA is defined as net income, plus interest expense, net, including debt extinguishment charges, plus income tax expense, plus depreciation, depletion and amortization       February 27, 2020 – P.17
                                                        expense, plus restructuring charges, plus acquisition-related costs, plus non-cash impairment charges, plus non-cash pension settlement charges, less (gain) loss on disposal of properties,
                                                        plants, equipment and businesses, net.
GAAP to Non-GAAP reconciliation:
Reconciliation of Net Sales to Net Sales Excluding the Impact of Currency Translation
$Millions

                                                                                        February 27, 2020 – P.18
GAAP to Non-GAAP reconciliation:
Reconciliation of Net Income to Adjusted EBITDA(13)
$Millions

                                                      (13) Adjusted EBITDA is defined as net income, plus interest expense, net, including debt extinguishment charges, plus income tax expense, plus depreciation, depletion

                                                      and amortization expense, plus restructuring charges, plus acquisition-related costs, plus non-cash impairment charges, plus non-cash pension settlement charges,
                                                      less (gain) loss on disposal of properties, plants, equipment and businesses, net.
                                                                                                                                                                                                                                February 27, 2020 – P.19
GAAP to Non-GAAP reconciliation:
Reconciliation of Segment Operating Profit to Adjusted EBITDA(14) ($Millions)

                                                           (14) Adjusted EBITDA is defined as net income, plus interest expense, net, including debt extinguishment charges, plus income tax expense, plus depreciation,

                                                           depletion and amortization expense, plus restructuring charges, plus acquisition-related costs, plus non-cash impairment charges, plus non-cash pension
                                                           settlement charges, less (gain) loss on disposal of properties, plants, equipment and businesses, net. However, because the Company does not calculate net
                                                           income by segment, this table calculates Adjusted EBITDA by segment with reference to operating profit by segment, which, as demonstrated in the table of
                                                                                                                                                                                                                           February 27, 2020 – P.20
                                                           Consolidated Adjusted EBITDA, is another method to achieve the same result.
GAAP to Non-GAAP reconciliation:
Net Income and Class A Earnings Per Share Excluding Adjustments
$Millions and $/sh

                                                                  February 27, 2020 – P.21
GAAP to Non-GAAP reconciliation:
Adjusted Free Cash Flow(15) and Projected 2020 Adjusted Free Cash Flow guidance

                                                                                  February 27, 2020 – P.22
You can also read