Avation PLC Investor Presentation - LSE: AVAP - Proactive Investors
←
→
Page content transcription
If your browser does not render page correctly, please read the page content below
LSE: AVAP

Avation PLC Investor Presentation
             June 2018
Company Overview
Publicly Listed Aircraft Leasing Business with Long Track Record
• Avation is a Singapore based aircraft lessor listed on the
London Stock Exchange (LSE: AVAP)
About Us
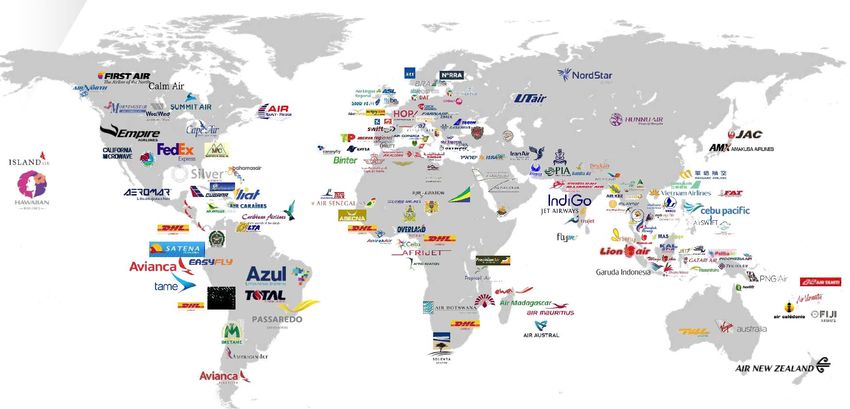
• Global participant in the broader commercial aviation sector
with earnings and assets denominated in US$
• Portfolio of 38 high demand aircraft (2 widebody, 17
Attractive Fleet narrowbody, 19 turboprop)
Profile • Weighted average aircraft age of 2.9 years(1)
• Weighted average remaining lease term 7.9 years.
• Diversified customer base of 14 airlines in 10 countries in the
Diversified
Asia Pacific and European aviation markets
Customer Base • Many of which are longstanding customers of Avation
• Access to equity (LSE listed for 8 years) and debt ($300M
bond issuer under current $1Bn MTN program; strong access
Good Access to
to bank market)
Liquidity • Rated BB- IDR (Fitch)(2), B+ CFR (S&P) and BB/BB (Egan
Jones/JCR) with improving credit metrics
• Experienced management team, led by Executive Chairman
Jeff Chatfield
Full Leasing
• Leasing platform with operational capability in OEM orders,
Platform aircraft acquisition & disposal, lease origination & extension,
transition, repossession and part out
Notes
1. Excluding finance leases (5 Fokker 100 leases as at 31 December 2017). Weighted average aircraft age is 3.1 years when including the 5 finance leases
2. Fitch upgraded Avation PLC’s long-term IDR from B+ (Stable) to BB- (Stable) on May 1, 2018
2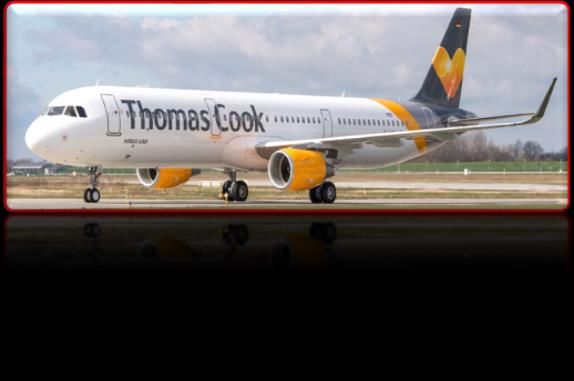
Snapshot of Avation
Vertically Integrated Platform with Diversified Customer Base and Fleet

                                                                                                                     24%/44%/32%
                   38                                                14 Airline                                          split of                                                 2.9 Years
                                                          Customers Operating                                     widebody/narrowbody/
                Aircraft                                                                                                                                                       Weighted Average
                                                               in   10 Countries                                   turboprop aircraft by
                                                                                                                          value
                                                                                                                                                                                Aircraft Age(1)

                                                                                                                                                                                                   2.9Y

      7.9 Years                                             US$1Billion                                                  US$859M                                            US$623M value
    Weighted Average                                         Fleet asset              value(2)                      unearned contracted
    Remaining Lease                                                                                                                                                        of aircraft on option(4)
                                                                                                                         revenue
         Term
                                                                                                                   US$79M in excess of net debt(3)

Notes
1. Excluding finance leases (5 Fokker 100 leases as at 31 December 2017). Weighted average aircraft age is 3.1 years when including the 5 finance leases
2. Includes US$970.1M of property, plant and equipment, and US$38.4M of assets held for sale, as at 31 December 2017
3. Calculated for illustrative purposes, and excludes consideration of operating expenses, financing cost and potential for lessees to not make contracted lease payments. Net debt calculated as total debt as at 31 December
   2017 (US$862.4M) minus total cash as at 31 December 2017 (US$82.8M)
4. As of Oct 2017. Includes Purchase Options and Purchase Rights                                                                                                                                                                 3
Historical Operational and Financial Performance(1)
   Continued Evolution to Younger Aircraft Portfolio and Track Record of Financial Expansion

                                                                                                     Total Assets                                                  Weighted Average Aircraft Age(2)
                                                                           US$M                                                                              Years
                                                                            1,200.0                                                1,120.0                    6.0
 ✓ Increased Scale and Portfolio Size
                                                                             1,000.0                             901.1
                                                                                              831.8                                                                     4.2
                                                                                                                                                             4.0
 ✓ Young, Attractive Fleet                                                     800 .0
                                                                                                                                                                                   3.3
                                                                                                                                                                                             2.9
                                                                               600 .0

 ✓ Long Average Lease Term                                                     400 .0                                                                        2.0

                                                                               200 .0
 ✓ Strong Profitability and Cash Flow
                                                                                  0.0                                                                        0.0
                                                                                              FY16               FY17               HY18                               FY16        FY17     HY18

        Weighted Average Remaining
                                                                                                  Lease Revenue                                                                  EBITDA
                Lease Term
Years                                                                        US$M                                                                            US$M
10.0                                                                         140 .0                                                                          140 .0

                                                   7.9                       120 .0                                                                          120 .0
 8.0                            7.5                                                                                                101.5
             6.8                                                                                                                                                                               98.7
                                                                             100 .0                              94.2                                        100 .0                  94.3

 6.0                                                                                          71.2                                                                        70.9
                                                                              80.0                                                                            80.0

 4.0                                                                          60.0                                                                            60.0

                                                                              40.0                                                                            40.0
 2.0
                                                                              20.0                                                                            20.0

 0.0                                                                            0.0                                                                            0.0
            FY16               FY17               HY18                                       FY16               FY17          LTM HY 2018                                FY16        FY17   LTM HY 2018
  Notes
  Note: Fiscal year-end is 30 June; half year-end is 31 December. LTM metrics for the 12 months ending 31 December 2017
  1. As of HY ending 31 December 2017
  2. Excluding finance leases (5 Fokker 100 leases as at 31 December 2017). Weighted average aircraft age is 3.1 years when including the 5 finance leases
                                                                                                                                                                                                          4
Operational Highlights

Growth, Fleet Diversification and Renewal

 •   Record growth with five aircraft added (>US$310 m)

 •   Annualized lease rental run rate >US$118 m

 •   Airbus A320 transitioned from Air Berlin to easyJet in Dec 2017

 •   First twin aisle (widebody) aircraft delivered into the fleet

 •   Customer diversification – Six airlines added in FY2018

 Funding

 •   GMTN issue US$300 m unsecured debt in May 2018

 Corporate

 •   Approval at AGM of share buyback
                                                                       5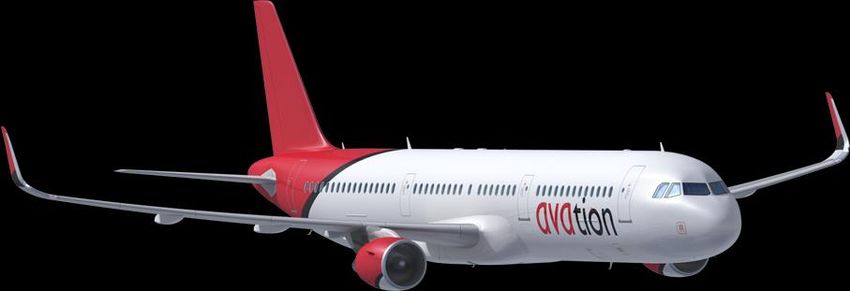
Operational Track Record
Dynamic Lessor with 12 Year Operating History

                                                   ✓ Purchased 58 aircraft with aggregate purchase price of approximately US$1.5Bn
               Purchasing                          ✓ 6 ATR aircraft on order with additional 30 delivery options
                                                   ✓ Total of 39 new aircraft deliveries from OEMs

                                                   ✓ Leased 56 aircraft to 18 airlines over operating history
               Leasing                             ✓ Total of 15 lease extensions on fleet assets

                                                   ✓ Sold 20 aircraft for aggregate price of US$339M
               Sales                               ✓ Converted 7 aircraft to finance lease
                                                   ✓ Part out of 1 aircraft

                                                   ✓ Total of 19 aircraft acquisitions in secondary market
               Trading                             ✓ Traded 4 aircraft purchase options with an aircraft value of US$110M

               Transition /                        ✓ Transitioned 2 aircraft between airlines and repossessed 2 aircraft
               Repossession                        ✓ Lease transition from Air Berlin to EasyJet in October 2017

               Equity                              ✓ Listed since 2006, and on the Main Market of the London Stock Exchange since 2010
               Financing                           ✓ Raised US$53M in equity versus balance sheet equity of US$207M at 31 December 2017

                                                   ✓ Access to secured debt with 15 active lenders
                Debt                               ✓ Unsecured 2021 debt (GMTN): US$300M (May 18)
                Financing                          ✓ Rated BB- IDR (Fitch)(1), B+ CFR (S&P) and BB/BB (Egan Jones/JCR) with improving credit metrics

Notes
1. Fitch upgraded Avation PLC’s long-term IDR from B+ (Stable) to BB- (Stable) on May 1, 2018                                                          6
Key Investment Highlights

                                               1

                                                     Attractive Industry
                                                       Fundamentals

5                                                                                           2

    Strong Management Team
                                                                                                Attractive Fleet Portfolio
    with Proven Track Record

                      4                                                    3

                          Improving Credit Metrics                             Established Customer
                               and Sustained                                     Relationships with
                                Profitability                                   Favorable Contracts

                                                                                                                             7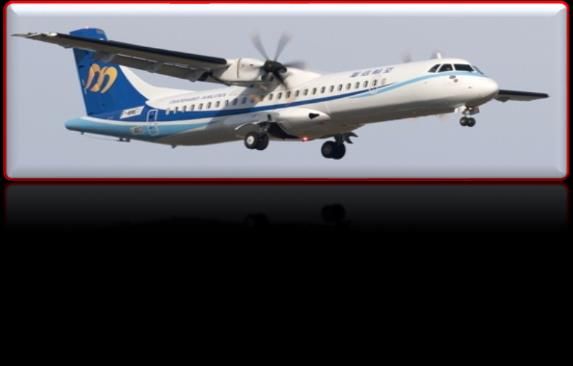
1   Attractive Industry Fundamentals
    Resilient Airline Traffic Growth Paired with Increasing Reliance on Lessors

                                                       Growing Air Travel Demand and Resiliency through Cycles
    (Revenue Passenger kilometers in Trillions)
    7.0                                                                                                                                         Asian            WTC                           Financial
                     Oil Crisis         Oil Crisis                                                                Gulf Crisis                   Crisis          Attack SARS                      Crisis
    6.0

    5.0

    4.0                                                                                                                                                                                                                         +60%

    3.0                                                                                                                                                                                                                       +110%

    2.0

    1.0

    0.0
                   1970                  1975                   1980                  1985                   1990                  1995                  2000                   2005                  2010                   2015

                                                                          Operating Lessor Fleet of Passenger Jets†
      Passenger jet fleet managed by operating lessors                                                                                                                                           Operating lessor fleet as % of total fleet
      10,000                                                                                                                                                                                                                          50%

       8,000                                                                                                                                                                                                                          40%

       6,000                                                                                                                                                                                                                          30%

       4,000                                                                                                                                                                                                                          20%

       2,000                                                                                                                                                                                                                          10%

             0                                                                                                                                                                                                                        0%
                   Jan Jan Jan Jan Jan Jan Jan Jan Jan Jan Jan Jan Jan Jan Jan Jan Jan Jan Jan Jan Jan Jan Jan Jan Jan Jan Jan Jan
                   90 91 92 93 94 95 96 97 98 99 00 01 02 03 04 05 06 07 08 09 10 11 12 13 14 15 16 17
                                                          Twin-aisle    Single -aisle   Share of fleet
    Notes
    Source: Airbus Global Market Forecast 2017; Flight Ascend Consulting Q2 2017 Commercial Operating Leasing Market Dynamics Report; Flight Fleets Analyzer (in-service and stored passenger single-aisle and twin-aisle types)
    † The information provided in this exhibit is a reproduction of an exhibit contained in Flight Ascend Analysis’ Q2 2017 report. Neither the Company nor any of the Dealers have independently verified the data contained on the slide and,

    therefore, none of them can assure you that such data is complete or reliable. Accordingly, neither the Company nor any of the Dealers make any representation as to the accuracy, adequacy or completeness of the data. Investors should not   8
    place undue reliance on, or base their investment decision on, the information presented on this page
2 Attractive Aircraft Portfolio
Balanced Fleet Consisting of Young Aircraft
Balanced Fleet with Orderbook and Options to
By Aircraft Value
Retain Expansion Flexibility
Aircraft Type Fleet Orders Options
Turboprop Aircraft
Turboprop
ATR 72-600 13 6 30 41%
FY2017
ATR 72-500 6 - -
Narrowbody Aircraft Narrowbody
59%
A321-200 8 - -
A320-200 3 - -
Bombardier CS300 1 1 -
Fokker 100 5 - - Widebody
Turboprop
24%
HY2018
32%
Widebody Aircraft
A330-300 1 - -
B777-300ER 1 - -
Narrowbody
44%
Total 38 7 30
Avation has built a diversified fleet with aircraft portfolio consisting of
approximately 24% widebody, 44% narrowbody and 32% turboprop aircraft by value
92 Attractive Aircraft Portfolio (Cont’d)
ATR Global Footprint
Notes
Source: ATR Marketing Materials 2017
102 Avation’s Latest Fleet Addition – Bombardier/Airbus CS300
Fuel efficient new technology aircraft
• Airbus majority owned and supported
• New generation – Inaugural commercial
flight December 2016 (airBaltic)
• Fuel efficient
• > 20 customers (airlines & lessors)
• 594 aircraft in service, ordered or
optioned (as at May 2018)
• Avation early mover – familiar to the
smaller fuel efficient aircraft space
• airBaltic carried it’s 1 millionth customer
on CS300 by April 2018 and had
completed over 10,000 flights
112 Attractive Aircraft Portfolio (Cont’d)
Fleet Metrics
FY 2016 FY 2017 HY 2018
Young fleet,
Fleet 38 35 37 reducing risk of
technology
Fleet additions (net) 9 (3) 2 obsolescence
Weighted average aircraft age 4.2 years 3.3 years 2.9 years(1)
Visibility of cash
flows due to
Weighted average remaining lease term 6.8 years 7.5 years 7.9 years
contracted nature
Weighted Average Aircraft Age (years)(1) Weighted Average Remaining Lease Term (years)
7-14 6-3
7.9
2.9 0-7 14-20 9-6 3-0
New Mid Old Long Mid Short
A young fleet with long remaining leases
Notes
Note: Fiscal year-end is 30 June; half year-end is 31 December
1. Excluding finance leases (5 Fokker 100 leases as at 31 December 2017). Weighted average aircraft age is 3.1 years when including the 5 finance leases 123 Established Customer Relationships with Favorable Contracts
Global Customer Relationships
14 Airline Customers from 10 Countries (including airBaltic and FAT)
No lessees based
in mainland China
133 Established Customer Relationships with Favorable Contracts (Cont’d)
…with New Relationships Driving Customer Diversification
By Monthly Rental
Run Rate Revenue
As at 31 December 2015 As at 31 December 2016 As at 31 December 2017
easyJet, 2% Fiji Airways, 2%
Fiji Airways, 2% Air France, 3%
Fiji Airways, 3% Condor, 3%
UNI Air, 5% Air Berlin, 4% VAA, 36% Condor, 3%
Condor, 5%
UNI Air, 4% Flybe, 4%
VAA, 26%
Air France, 5% VAA, 56% Air France, 4% Air India, 4%
Air India, 5% Mandarin, 4%
Air India, 7%
Thomas Cook, 8%
Thomas Cook, 9%
Thomas Cook, 9%
EVA, 10%
Flybe, 10% VietJet, 21%
Flybe, 10%
PAL, 13%
VietJet, 23%
Note: Flybe represented 9.46% of monthly rents
but is rounded to 10% for presentation purposes
Top 1 Customer Share – 56% Top 1 Customer Share – 36% Top 1 Customer Share – 26%
Top 3 Customers Share – 75% Top 3 Customers Share – 69% Top 3 Customers Share – 60%
Increased Customer Diversification –airBaltic & Far Eastern Air Transport added in 2018
144 Improving Credit Metrics and Sustained Profitability
Portfolio and Capital Structure Support Positive Credit Profile
• Fundamental long-term improvement in portfolio Improved Customer Diversity
and capital structure
✓ Reduction in customer concentration
Monthly Rental Run Rate VAA, 26%
✓ Utilization of unsecured funding
Top 1 Customer Share – 26%
✓ Favorable and improved credit metrics Top 3 Customers Share – 60%
VietJet, 21%
✓ Improvement in scale and age of fleet PAL, 13%
Increasing Reliance on Unsecured(1) Credit Metrics
EBIT Coverage FFO / Debt
34.1%
1.6x 7.1%
17.2%
0.0%
12/31/2014 12/31/2017 12/31/17 Pro Forma¹ LTM HY 2018 LTM HY 2018
Notes
Note: Fiscal year-end is 30 June; half year-end is 31 December. LTM metrics for the 12 months ending 31 December 2017
1. Ratios represent unsecured debt as a percentage of total debt. Pro Forma for the assumed issuance of US$300M of unsecured notes (balance sheet data as of 31 December 2017)
15Avation Summary
Record Fleet Growth
Attractive Industry Dynamics
Leading Fleet Metrics
Increased Airline and Aircraft Diversification
Transformation of Debt Capital Structure
Continued Growth Focus in FY2019
16Avation PLC (LSE: AVAP)
65 Kampong Bahru Road
Singapore 169370
Phone: + 65 6252 2077
www.avation.net
Jeff Chatfield
Executive Chairman
jeff@avation.net
Richard Wolanski
Finance Director
richard.w@avation.net
17Important Notice
NOT FOR RELEASE, PUBLICATION OR DISTRIBUTION, DIRECTLY OR INDIRECTLY IN, OR INTO THE UNITED STATES, AUSTRALIA, CANADA, JAPAN, SINGAPORE OR SOUTH AFRICA OR TO U.S. PERSONS
(AS DEFINED BELOW). This presentation and any accompanying management discussion of this presentation (the "Presentation") are confidential and being given by Avation PLC (the “Company”) solely for
your information and may not be reproduced in any form or further distributed to any other person or published in whole or in part for any purpose. Any failure to comply with this restriction may constitute a
violation of applicable securities laws.
United Kingdom
This Presentation has not been approved by an authorised person in accordance with Section 21 of the Financial Services and Markets Act 2000 ("FSMA") and therefore it is being delivered for information purposes only to a
very limited number of persons and companies who are persons who have professional experience in matters relating to investments in the United Kingdom: (i) that the Company reasonably believes are of a kind described in
either article 19(5) (investment professionals) or article 49(2)(a) to (d) (high net worth companies, unincorporated associations, etc) of the Financial Services and Markets Act 2000 (Financial Promotion) Order 2005; or (ii) to
whom it may otherwise be lawfully given, (in United Kingdom all such persons together being referred to as "relevant persons"). This Presentation must not be acted on or relied on by persons who are not relevant persons.
No offer or invitation or solicitation of any offer to acquire securities of the Company or any new company to be established at the Company's direction is being made at this time nor does this Presentation constitute or form a
prospectus or part of any invitation or inducement to engage in investment activity (within the meaning of section 21 of the FSMA). No recipient of or attendee at this Presentation should deal in or attempt to deal in or
otherwise engage in any behaviour which would or might constitute market abuse (as defined in section 118 of FSMA) in relation to any securities or other qualifying investments to which this Presentation relates. No individual
within the Company or its associates is, by virtue of making this Presentation, encouraging recipients of or attendees at this Presentation to deal in accordance with section 52(2)(a) of the Criminal Justice Act 1993.
Singapore
This presentation has not been registered as a prospectus with the Monetary Authority of Singapore. This presentation and any other document or material in connection with the offer or sale, or invitation for subscription or
purchase, of the securities may not be circulated or distributed, nor may the securities be offered or sold, or be made the subject of an invitation for subscription or purchase, whether directly or indirectly, to persons in
Singapore other than (i) to an institutional investor (as defined in Section 4A of the Securities and Futures Act (Chapter 289 of Singapore) (the “Securities and Futures Act”)) pursuant to Section 274 of the Securities and
Futures Act, (ii) to a relevant person (as defined in Section 275(2) of the Securities and Futures Act) pursuant to Section 275(1) of the Securities and Futures Act, or any person pursuant to Section 275(1A) of the Securities
and Futures Act, and in accordance with the conditions specified in Section 275 of the Securities and Futures Act, or (iii) otherwise pursuant to, and in accordance with the conditions of, any other applicable provision of the
Securities and Futures Act.
By viewing the contents of this presentation, you represent and warrant that you are entitled to view it in accordance with the restrictions set forth above and agree to be bound by the limitations contained herein. Any failure to
comply with these limitations may constitute a violation of law.
United States
This Presentation and the materials contained herein does not constitute an offer of securities for sale in the United States or to U.S. Persons (as such term is defined in "Regulation S" under the U.S. Securities Act of 1933
(the “Securities Act”)). Securities may not be offered or sold in the United States or to, or for the account or benefit of, U.S. Persons unless they are registered under the Securities Act or exempt from such registration
requirements. No public offering of securities is being made in the United States. This Presentation is being made only to qualified institutional buyers as defined in Rule 144A under the Securities Act and persons outside the
United States who are not U.S. Persons (all such persons together being referred to as “relevant persons”).
General
Some of the statements in this presentation constitute “forward-looking statements” that do not directly or exclusively relate to historical facts. These forward-looking statements reflect the Company’s current intentions, plans,
expectations, assumptions and beliefs about future events and are subject to risks, uncertainties and other factors, many of which are outside the Company’s control. Important factors that could cause actual results to differ
materially from the expectations expressed or implied in the forward-looking statements include known and unknown risks. Because actual results could differ materially from the Company’s current intentions, plans,
expectations, assumptions and beliefs about the future, you are urged to view all forward-looking statements contained in this presentation with caution.
Neither the issue of this Presentation nor any part of its contents is to be taken as any form of commitment on the part of the Company to undertake or proceed with any transaction. In no circumstances will the Company be
responsible for any costs, losses or expenses incurred in connection with any appraisal or investigation of the Company. No reliance may be placed for any purpose whatsoever on the information or opinions contained in or
given during this Presentation. The information and opinions contained in or given during this Presentation are provided as at the date hereof, are not necessarily complete and are subject to change without notice. No
representation, warranty or undertaking is given by or on behalf of the Company or its directors, officers, shareholders, employees, agents and advisors as to the accuracy, completeness or reasonableness of the information
or opinions contained in or given during this Presentation and no liability is accepted or incurred by any of them for or in respect of any such information or opinions, provided that nothing in this paragraph shall exclude liability
for any representation or warranty made fraudulently.
By agreeing to attend or receive this Presentation you: (i) represent and warrant that you are a relevant person; and (ii) agree to the foregoing (including, without limitation, that the liability of the Company and
its directors, officers, employees, agents and advisors shall be limited in the manner described above). IF YOU ARE NOT A RELEVANT PERSON OR DO NOT AGREE WITH THE FOREGOING, PLEASE IDENTIFY
YOURSELF IMMEDIATELY.
18You can also read