Killam Apartment REIT - Investor Presentation January 2017 - Killam Properties
←
→
Page content transcription
If your browser does not render page correctly, please read the page content below
Killam
Apartment
REIT
Investor
Presentation
January 2017

               1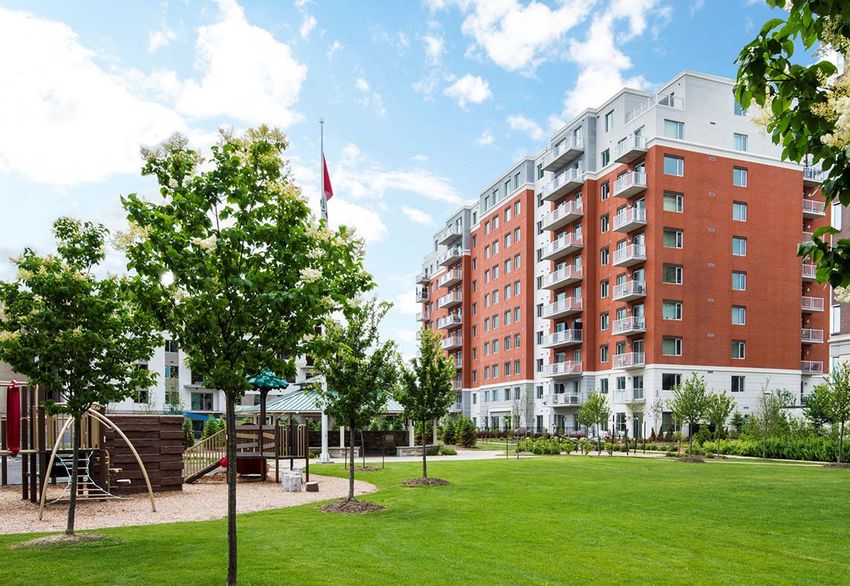
Cautionary
 CautionaryStatement
            Statement
 This presentation may contain forward‐looking statements with respect to Killam
 Apartment REIT and its operations, strategy, financial performance and condition.
 These statements generally can be identified by use of forward‐looking words such as
 “may”, ”will”, “expect”, “estimate”, “anticipate”, “intends”, “believe” or “continue”
 or the negative thereof or similar variations. The actual results and performance of
 Killam Apartment REIT discussed herein could differ materially from those expressed
 or implied by such statements. Such statements are qualified in their entirety by the
 inherent risks and uncertainties surrounding future expectations. Important factors
 that could cause actual results to differ materially from expectations include, among
 other things, general economic and market factors, competition, changes in
 government regulation and the factors described under “Risk Factors” in Killam'
 annual information form and other securities regulatory filings. The cautionary
 statements qualify all forward‐looking statements attributable to Killam Apartment
 REIT and persons acting on its behalf. Unless otherwise stated, all forward‐looking
 statements speak only as of the date to which this presentation refers, and the
 parties have no obligation to update such statements.

                                                                                         2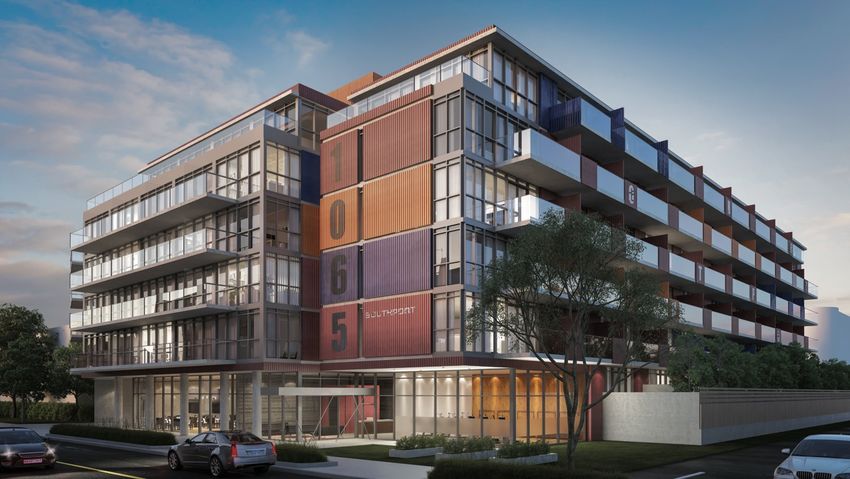
About
 KillamKillam Apartment
        Apartment  REIT REIT
Killam Apartment REIT is a growth‐oriented Canadian real estate investment trust. Killam owns,
manages and develops multi‐family residential properties in Atlantic Canada, Ontario and Alberta.
Killam's portfolio includes $1.9 billion in real estate assets, including 13,952 apartment units and
5,165 manufactured home community (MHC) sites.

Market cap1                      $860M
Annual distribution              $0.60                                                NOI By Province
Distribution yield               5.0%
Avg. daily volume                133K     Net Operating Income (NOI)                          3%
                                                  by Sector                            6%

                                                 9%    2%                        8%
                                                                                            Nova Scotia
                                                                                            New Brunswick
                                                                                                            43%
                                                      Apartments                            Ontario
                                                      MHCs                 18%              NFLD
                                                      Commercial                            PEI
                                                                                            Alberta

1) Includes exchangeable units                              89%                         22%

                                                                                                            3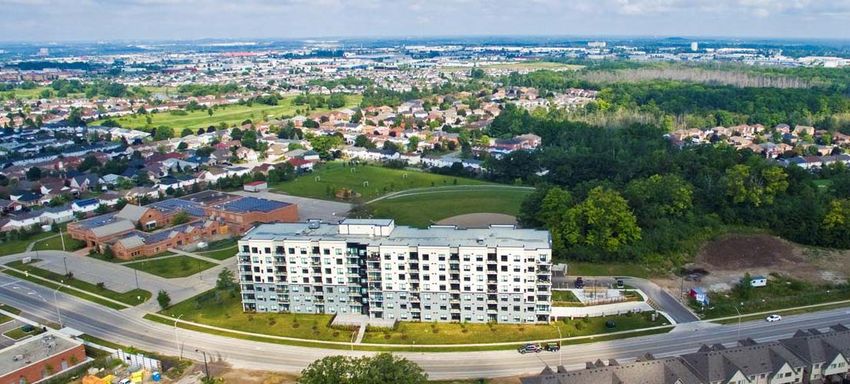
Why
Why Invest
Invest in
in Killam
Clearly defined strategy – growth from same
property portfolio, acquisitions and developments.
High‐quality portfolio with investment in newer
properties.
Growing funds from operations (FFO) & adjusted
funds from operations (AFFO) per unit.
Stable distributions with improving payout ratio.
Strengthened balance sheet with increased
flexibility.
Interest saving opportunities on refinancings.
Established development program with robust
development pipeline.
Positioned to benefit from economic growth in
Atlantic Canada and population growth in Central
Canada.
4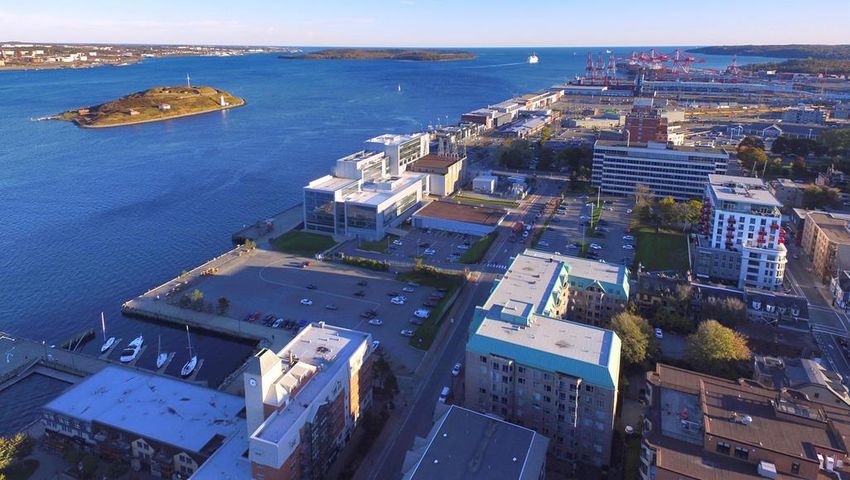
Clearly
 KillamDefined Strategy
        Apartment REIT
 Killam’s strategy is to maximize its value and long‐term profitability by concentrating on
 three key areas of growth:

              #1                               #2                               #3
  Increasing earnings from its    Expanding the portfolio and         Developing high‐quality
       existing portfolio          diversifying geographically     properties in its core markets
                                 through accretive acquisitions,
                                   with an emphasis on newer
                                            properties

                                                                                            5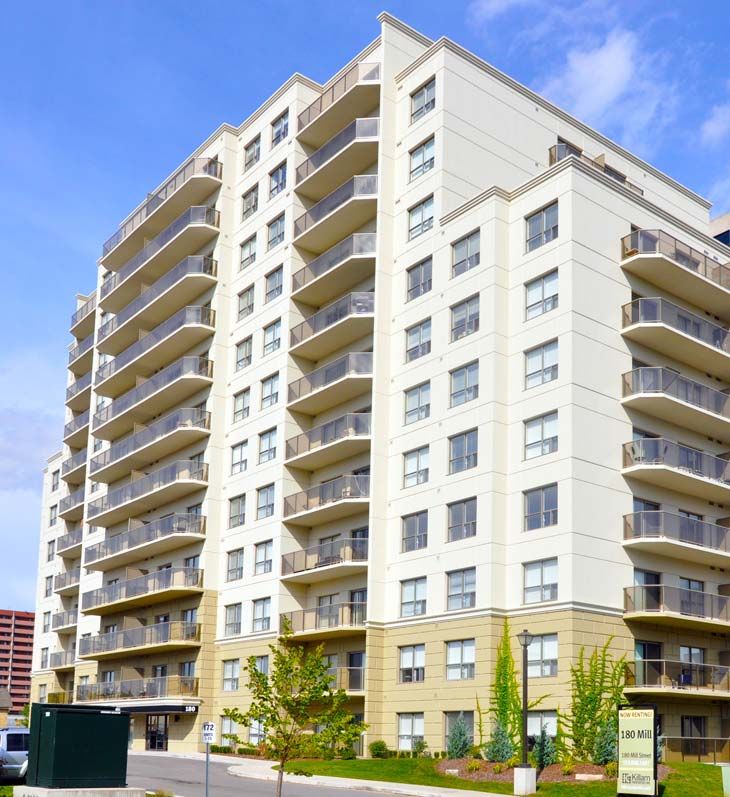
Clearly
 KillamDefined Strategy
        Apartment REIT
 #1) Increasing earnings from the existing portfolio.
                                                                                                                           Historic Same Property
                                                                                                                              Revenue Growth
   Revenue Growth            •           Improved occupancy

                                                                                                                    2.9%

                                                                                                                              2.6%
                             •           Growing rental rates

                                                                                                                                                                     2.2%
           +

                                                                                                                                         1.9%

                                                                                                                                                   1.8%

                                                                                                                                                                            1.8%
                                                                                                                                                            1.7%
       Expense               •           Reduced incentives
                             •           Capital upgrades
    Management
                             •           Quality product & service
           =
                             •           90% tenant satisfaction
    Increased Net                        rating
   Operating Income                                            Apartment Quarterly Occupancy
        (NOI)                                             $ occupancy as a % of gross potential rents 1

                                                                                            95.8%

                                                                                                                                                             95.8%
                                                                                                                                95.7%

                                                                                                                                           95.7%
                                                            95.6%

                                                                                                                                                    95.6%
                                                                                                    95.5%

                                                                                                                      95.3%
                                                                            94.9%

                                                                                                            94.8%
                                                                    94.7%

                                                                                    94.7%
                                                                                                                                        95.1% Average
                                 94.3%

                                                  94.2%
                                          93.6%

                           1. This measures dollar occupancy achieved and is typically ~1% lower than occupancy on a unit count basis at the
                           end of each quarter, but is better management information.                                                                                       6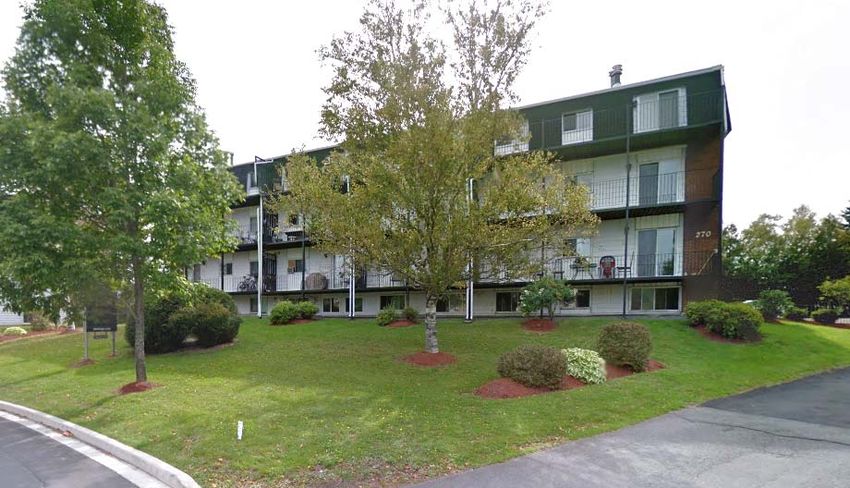
Clearly
 KillamDefined Strategy
        Apartment REIT
 #1) Increasing earnings from the existing portfolio.

   Revenue Growth             • Energy initiatives      • Employee training
          +                   • Water saving programs • Investment in technology
       Expense                • Maximizing economies of • Tenant education
                                scale
     Management
          =                        Same Property NOI Growth 2007-
                                               2016
    Increased NOI                                Average Growth of 3.0%
                                          8.4%

 Killam has increased
                           5.1%

                                                  4.8%

                                                                                                 4.7%
                                                                                          4.2%
 its same property NOI
 an average of 3.0%
                                   2.1%

                                                                 2.0%

 per year over the last
                                                         0.3%

                                                                                 (0.9%)
                                                                        (0.4%)

 10 years.

                          * Record high natural gas prices in Atlantic Canada impacted NOI
                          growth in 2013 & 2014.                                                        7
Clearly
 KillamDefined Strategy
        Apartment REIT
 #2) Expanding the portfolio and diversifying geographically through
 accretive acquisitions, with an emphasis on newer properties.
                              Apartment Units & MHC Sites                              Annual Apartment NOI
                     15,000                                                                      $ millions
                                                                           $100
                                 Apartment                                                Alberta
                                 Units                                      $80           Ontario
                     10,000                                                               Atlantic Canada
                                 MHC Sites
       Units/sites

                                                                            $60

                                                                            $40
                      5,000
                                                                            $20

                                                                             $‐
                         0

  Since its first acquisition in 2002, Killam’s portfolio has grown        Killam's strong operating platform can support a larger
  annually through acquisitions. Killam is expanding its portfolio by      and more geographically diverse portfolio. Increased
  acquiring centrally located buildings in urban markets, increasing its   investment in core markets outside Atlantic Canada
  ownership in Ontario and Alberta, and adding to its established          will enhance Killam's diversification and exposure to
  portfolio in Atlantic Canada.                                            urban centres in Canada that have higher population
                                                                           growth.

                                                                                                                                     8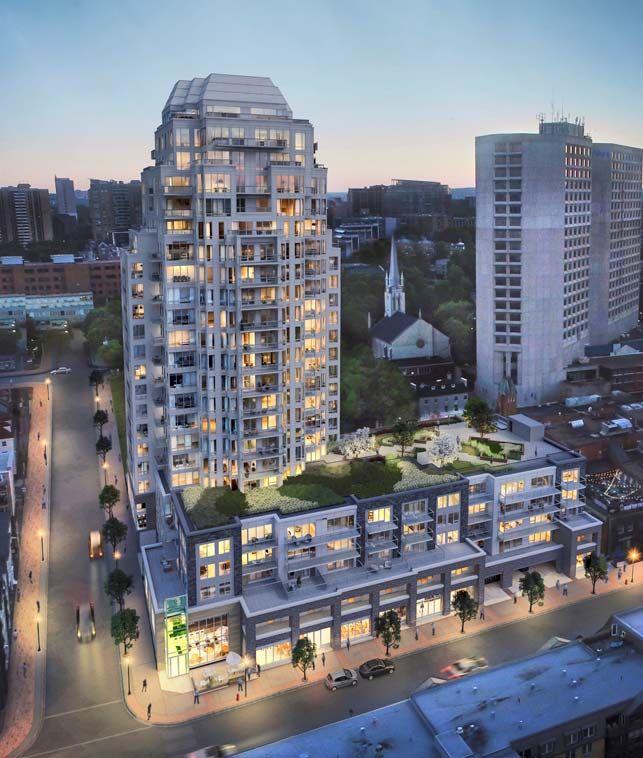
Clearly
 KillamDefined Strategy
        Apartment REIT
 #3) Developing high-quality properties in its core markets.
 Killam augments its external growth opportunities with                       Developments Completed Per Year
 developments. Killam has invested over $130 million in                                        $ millions
 developments since its first project was completed in 2011.           $80

 With an experienced team and a development pipeline of
 over 1,200 units, developments are an important                       $60            $17
 component of Killam’s growth.

                                                                       $40            $25

                                                                       $20                           $25
                                                                                      $19                         $35
                                                                                                                        $24
                                                                                               $14          $15
                                                                             $5           $8         $8
                                                                        $0

                                                                                                                  * forecast

                                    Killam can develop to yields higher than those
                                    achievable through acquisition, contributing to net
                                    asset value (NAV) growth per unit.                                                   9
Clearly
 KillamDefined Strategy
        Apartment REIT
 Over $130 million of developments completed.

 49 units ‐ Charlottetown, PEI     63 units ‐ Halifax, NS      101 units ‐ Fredericton, NB

 47 units – Charlottetown, PEI   71 units – St. John’s, NL                         102 units – St. John’s, NL

                                                                                                                10
                                   122 units ‐ Cambridge, ON     70 units – Halifax, NS
High‐Quality Portfolio
Killam has one of the newest apartment portfolios in Canada; 37% of
Killam’s apartment NOI comes from properties built in 2000 or later.
Apartment NOI by Year of
Construction Management believes that increasing Killam’s ownership in new,
high‐quality buildings will result in long‐term demand for its properties,
reduce annual capital requirements related to deferred maintenance, and
18% transform Killam’s portfolio into one of the highest quality portfolios in
23%
Canada.
2010 and newer
The annual capital spend
2000‐2009 Average Capital Spend Per Unit by per unit is lower
1990‐1999
1980‐1989 Building Age for newer properties. For
1970‐1979 19% For the years ended Dec 31 example, Killam’s
Pre 1970 average spend for
properties 0 to 10 years
23% $3,000
old was $700 per unit in
$2,000 2015 compared to
9%
$2,600 per unit for
8%
$1,000 buildings over 40 years
old.
$0
2013 2014 2015 Overall, Killam’s average
capital spend was $2,178
0 ‐ 10 years 11 ‐ 20 years 21 ‐ 30 years
per apartment unit in
31 ‐ 40 years 41 + years 2015.
Killam is growing its portfolio of high‐quality properties by focusing
on developments and acquiring newer properties.
11Growing FFOPer
9.7% FFO & AFFO
Shareper Unit 2015
Growth
FFO & AFFO YTD FFO & AFFO
FFO and AFFO per unit
Per Unit Per Unit
For the nine months ended Sept 30 growth has been
For the years ended Dec 31
attributable to:
FFO AFFO FFO AFFO • same property NOI
$0.79 growth
$0.65
$0.71 $0.72
$0.54
$0.59 $0.58 • interest expense
$0.51
$0.68 $0.46 savings
$0.60 $0.61 • accretive acquisitions
• developments
2013 2014 2015 2014 2015 2016
12Improving
88% AFFOAFFO Payout
Payout Ratio
Ratio in 2015
Killam’s Annual Dividend/Distribution & Payout
Ratio
Dividend/Distribution AFFO Payout Ratio
$0.61 98% 100%
$0.60
96%
95%
81%
$0.60 88% 90%
AFFO
$0.59 Payout
85%
$0.59 80% Ratio at
$0.58 75%
80% Sept 30,
$0.58 75% 2016
$0.58 $0.60 $0.60 $0.60 $0.60
$0.57 70%
2013 2014 2015 2016* 2017*
*The 2016 and 2017 adjusted funds from operations (AFFO) payout ratio represents the consensus estimate based on the current annual
distribution of $0.60.
13Financial & Operating Performance
Strengthened Balance
Stable Balance Sheet with Increased Flexibility
Sheet
Sept 30, Dec 31,
Debt as a % of Total Interest Coverage Ratio 2016 2015
Assets At Dec 31 Mortgage debt as a % of
2.81
50.9% 50.4%
At Dec 31 total assets
55.7%
2.34
55.2%
2.21
54.9%
2.09
Weighted average interest
1.98
3.08% 3.27%
53.2%
52.9%
rate on mortgage debt
51.6%
Weighted average term to
4.2 years 4.2 years
maturity
Debt service coverage ratio
1.52 1.35
(rolling 12 months)
Interest coverage ratio
2.81 2.34
(rolling 12 months)
CMHC‐insured apartment
76% 73%
mortgages
Killam completed a $98 million equity raise on June 2, 2016.
Credit Facility Expanded : Following the all cash
Part of the proceeds were used to redeem $57.5 million of
acquisition of Garden Park Apartments on June
convertible debentures on July 4, 2016. The interest
30, 2016, Killam established a new $30M demand
coverage estimate at July 4, 2016 normalizes for the impact
credit facility and increased its acquisition
of redeeming the $57.5 million of convertible debentures.
capacity to $100 million.
14Interest Saving Opportunities on Refinancings
Mortgage Maturities by Year
As at Sept 30, 2016
Mortgage Maturities Weighted Average Interest Rate (Apartments)
5 year rate 10 year rate
$200 8%
$180 7%
Mortgage Maturities ($M)
$160
6%
$140
Interest Rate
$120 5%
3.81% 3.69% 3.73%
$100 3.16% 3.28% 3.13% 4%
2.92% 2.70%
$80 2.59% 3%
$60
2%
$40
$20 1%
$0 0%
Current rate for 5‐year CMHC Current rate for 10‐year CMHC
insured debt is approximately insured debt is approximately
2.2%. 2.8%.
15Robust Development Pipeline
Development Opportunities
Development
Potential in
Property City Units Status
Developments Underway
The Alexander - Phase 1* Halifax, NS 121 Under construction - 2017 completion
Saginaw Phase II Cambridge, ON 93 Start in Q3-2016
Development Opportunities - 2017
Spring Garden Terrace Land Halifax, NS
The Governor (Phase 2 of the Alexander)* Halifax, NS
106
50
2014 &
Approved development agreement
As of right
Silver Spear* Mississauga, ON 64 In design and approval process
Future Development Opportunities - 2018 and beyond
Grid 5 Land* Calgary, AB 198
Q1 2015
Future development
Carlton Houses Halifax, NS 70 Future development
Medical Arts (Spring Garden) Halifax, NS 200 Future development
1335 Hollis Street Halifax, NS 30 Future development
Block 4 St. John's, NL 80 As of right
Topsail Road St. John's, NL 225 Approved development agreement
Total Development Opportunities 1,237
* Represents Killam's 50% interest in potential development units.
Killam is targeting yields of 5.5% ‐ 6.0% on developments, and cap rate values
upon completion of 4.5% ‐ 5.0%, contributing to NAV per unit growth. 16Investment Opportunity
Benefiting from Economic
Improved Economics Growth
in Atlantic in Atlantic Canada
Canada
(1) Commitment/
Province Project Term Estimated # of Jobs Comments
Size ($)
Nova Irving $25 billion 25‑year 1,000‑1,500 direct Irving finished a $350M modernization of the Halifax shipyard and began cutting
Scotia Shipbuilding contract. up to 11,500 indirect steel in September 2015 for phase I of the contract, 6 Arctic Offshore Patrol Ships.
Contract Started in The second and more significant phase of the contract, building ~15 surface
2015 combatant ships, is expected to begin in 2020.
Energy $2.1 billion 6 years Not available Shell drilled its first exploration well during 2015. BP expects to drill its first
Exploration off (British (exploration exploration well in 2017. This offshore oil activity has the potential for long‑term
NS Coast Petroleum and phase) investment and employment opportunities in the region.
Shell Canada) 2013‐2019
Various Halifax $1‑2 billion 3‑4 years Not available Investments underway include the new convention centre, two new military
Construction facilities, and various real estate projects in Halifax.
Projects
New Saint John Mill $450 million 3 years 600 direct The two‐phase upgrade began in 2014, corresponding with a 20% increase in the
Brunswick Upgrade 2014‐2017 NB softwood that will be made available to the forestry industry.
Energy East $12 billion 6 years 3,700 during Application submitted to National Energy Board in 2014. An estimated $2.8
Pipeline (proposed total (development development billion of GDP contribution for New Brunswick during the project.
project cost) phase)
Newfoundland Muskrat Falls $7 billion 5 years 1,500 direct with peak Construction of the 824 megawatt hydroelectric dam is underway, as well as the
and Labrador Hydro Project 2012‐2017 of 3,100. transmission line between Muskrat Falls and Churchill Falls.
Maritime Link $1.6 billion 4 years Average of 300 direct, Subsea cable designed to transport electricity from NL to NS. Construction began
2013‐2017 with a peak of 600 in 2014. First power is planned for delivery in 2017.
Hebron Oil $14 billion 10 years 3,000 ‑ 3,500 direct The reserve estimate for Hebron is over 700 million barrels of oil. The project
Project 2010‐2024 started in 2010 and will run until 2024. Suncor has reconfirmed its commitment
to Hebron (Jan 13, 2015) and expects it to come online in 2017. Development
drilling will continue until 2024.
(1) Project details including commitment, size, term and job growth are taken from various sources, such as company press releases, economic studies and related websites.
Halifax is expected to have one of the fastest growing economies in Canada, with 2.9%
growth expected in 2016, according to the Conference Board of Canada’s Winter 2016
Metropolitan Outlook. Approximately 36% of Killam’s NOI is generated in Halifax, the
17
largest city in Atlantic Canada.Benefiting from Improved Occupancy in Atlantic
Investment Opportunity
Improved Economics in Atlantic Canada
Canada
CMHC Vacancy in Atlantic Canada
2014 2015 2016
Atlantic Canada is
9.0%
8.6%
8.5%
8.5%
experiencing improved
7.9%
7.4%
apartment occupancy
6.0%
5.9%
5.7%
levels. In their Fall 2016
5.5%
4.7%
4.6%
4.4%
Rental Market Report,
4.2%
3.8%
3.7%
3.5%
CMHC reported lower 3.4%
3.0%
2.6%
vacancies in four of six
1.7%
of Killam’s core markets
in Atlantic Canada,
versus an overall
increase for Canada.
Source: CMHC Fall 2015 and Fall 2016 Rental Market Reports.
18Focus on Developments
Current Developments
Southport – Completed
Southport, August 2016
Halifax, NS
Rental Units: 70
Start Date: December 2014
Completion: August 2016
Move‐ins started in Sept 2016
Location: Downtown Halifax
Lease‐up: 100%
Cost: $14.7 million ($210,000/door)
Expected Yield: 5.5%
Expected Value: 4.75% cap rate
Average Unit Size: 636 sf
Average Rent: $1,400 ($2.20/sf)
19Focus on Developments
Current Developments
Southport – Completed
Southport, August 2016
Halifax, NS
20Focus on Developments
The Alexander ‐ 2017 Completion
Rental Units: 242 units, 6,500 sf of retail space
Ownership: Killam 50%, Partners 50%
Start Date: Q3‐2015
Projected Completion: Q4‐2017
Location: Downtown Halifax across from the
waterfront
Cost: $35 million (Killam’s cost) ($276,000/
residential door)
Expected Yield: 5.5%
Expected Value: 4.75% cap rate
Average Unit Size: 740 sf
Average Rent: $1,740 ($2.35/sf)
21Focus on Developments
The Alexander ‐ 2017 Completion
View from upper floors
22The Alexander, Halifax
23The Alexander, Halifax
24The Alexander, Halifax
25The Alexander, Halifax
26Future Developments
Focus on Developments
Saginaw
Saginaw Gardens II –ON
2, Cambridge, Started in Q3‐2016
Rental Units: 93 units
Start Date: Q3‐2016
Projected Completion:
Q1‐2018
Location: Adjacent Saginaw
Gardens, Saginaw Parkway,
Cambridge
Cost: $25.1 million
($269,000/door)
Expected Yield: 5.5%
Expected Value: 4.75% cap rate
Average Unit Size: 1,025 sf
Average Rent: $1,665 ($1.62/sf)
272016 Acquisitions
2016 Acquisitions
Garden
GardenPark
ParkApartments,
Apartments,Halifax
Halifax
Building Description:
246 apartment units
8,195 sf of commercial space
Location:
1472 Martello Street, Halifax
2016 Acquisition:
Remaining 51.0% interest
$23.7 million
June 2016 closing
282016 Acquisitions
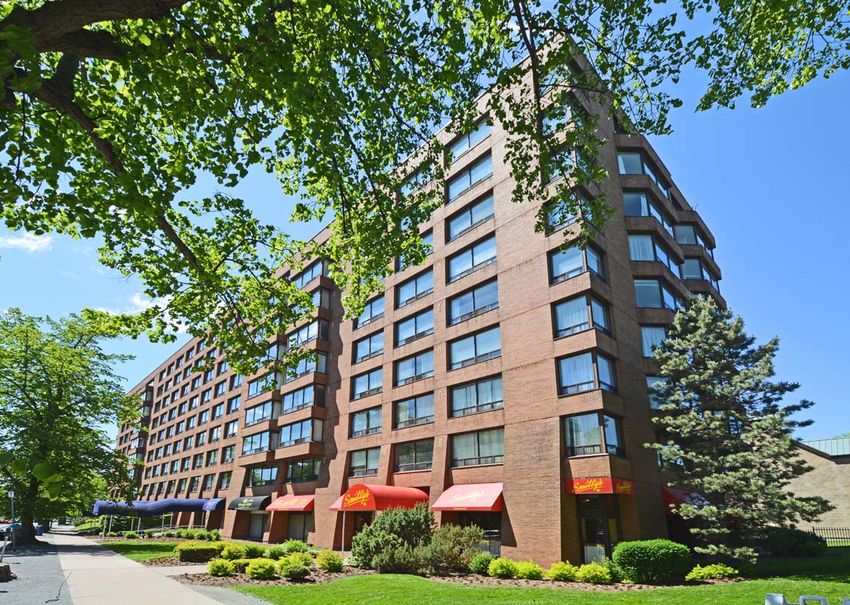
270 Parkside Drive, Fredericton
270 Parkside Drive is located in close
proximity to 355 Killam units in Fredericton,
and across from Killam’s regional office in
the city.
existing Killam properties
292016 Acquisitions
2016 Acquisitions
Kanata
KanataLakes
LakesApartments IIIOttawa
Apartments,
Building Description:
173 units
3rd of a five‐building portfolio with
a shared clubhouse
Location:
1047 Canadian Shield Ave, Kanata
2016 Acquisition:
50% of building III
$31.1 million
June 2016 closing
Previous Purchases:
2011 – 25% of building I
2014 – 50% of building II &
additional 25% of building I
302016 Acquisitions
Kanata Lakes Apartments III
31Well Positioned for Growth
Killam is well positioned for long‐term success with a focus on the follow key
initiatives:
• Attention to curb appeal and long‐term value enhancement with capital
programs and customer‐focused service.
• Cost management with ongoing process improvements.
• Growing the portfolio and expanding geographically with accretive
acquisitions.
• Augmenting the quality of the portfolio with developments in core markets.
• Strengthening its balance sheet with lower debt levels.
• Increasing capital flexibility with an expanded line‐of‐credit, growing portfolio
of unencumbered assets and improved AFFO payout ratio.
32Contact Information
Philip Fraser
President & CEO
902‐453‐4536
pfraser@killamreit.com
Robert Richardson, FCPA, FCA
Executive Vice President & CFO
902‐442‐9001
rrichardson@killamreit.com
Dale Noseworthy, CPA, CA, CFA
Vice President, Investor Relations &
Corporate Planning
902‐442‐0388
dnoseworthy@killamreit.com
33You can also read