PROJECT NEED AND JUSTIFICATION - Ottawa Confederation Line
←
→
Page content transcription
If your browser does not render page correctly, please read the page content below
3.0            PROJECT NEED AND JUSTIFICATION
The need for the DOTT project is based on the acknowledgment that the existing rapid transit system through Ottawa’s downtown is nearing its capacity, is increasingly affected by delays and does not
have sufficient additional capacity to meet future transit ridership demands.

Sections Include:

3.1    Overview of Current Situation
3.2    Policy Direction
3.3    Prior Planning Work
3.4    Ridership on the DOTT Line
3.5    Benefits of the DOTT Line

                                                                                                                                                                                                         3-1
                                                                                                                                                                                                         1-1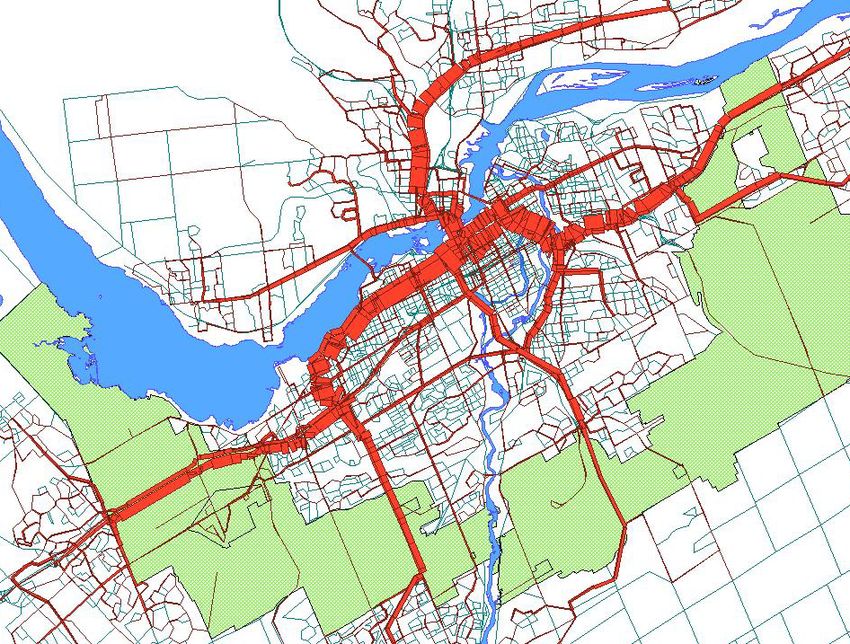
The priority project, identified in the TMP, is to convert the • A Green and Environmentally Sensitive City
3.1 Overview of Current Situation existing Bus Rapid Transit service to electric light rail transit • A City of Distinct, Liveable Communities
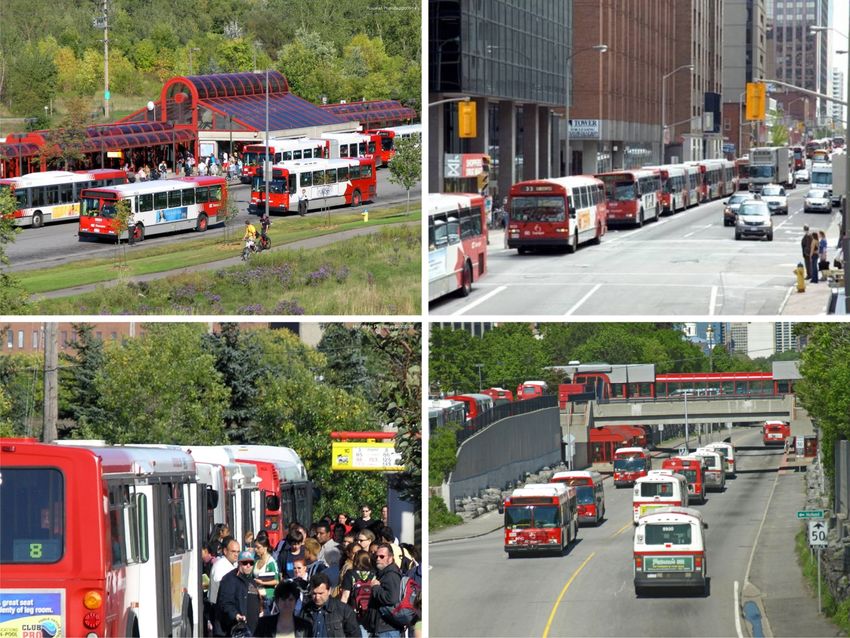
The existing OC Transpo Bus Rapid Transit service through between Tunney's Pasture Station to Blair Station using the • An Innovative City Where Prosperity is Shared Among
downtown accommodates over 10,000 riders, per direction, existing dedicated Transitway alignment east and west of All
during peak hours. Currently, this transit service is limited to downtown, and constructing a new transit tunnel underneath
approximately 180 buses an hour per direction as the on-street • A Responsible and Responsive City
the downtown core.
BRT operation in the downtown is limited by the capacity of the • A Healthy and Active City
signalized intersections along the corridor. These intersections 3.2 Policy Direction Specific to the “city of distinct, liveable communities” principles,
must satisfy competing demand for buses, vehicular traffic, Ottawa is Canada’s fourth-largest city and Ontario’s second- further development of the rapid transit system would
pedestrians and cyclists travelling along and across the corridor. largest city, with a population in mid 2009 of over 900,000 and encourage growth in new areas at higher densities and with a
Increasingly, downtown Ottawa’s transit system is plagued by an area of 2,796 square kilometres. In addition to being the greater mix of uses than has been typical of Ottawa’s suburbs in
delays due to general traffic, conflicts, accidents and emergency nation’s capital, Ottawa is also one of the urban centres most the past. New housing and other land uses will also be
response, inclement weather and special events. The favoured by immigrants leading it to become one of the encouraged to locate along rapid-transit corridors and in areas
unreliability of transit downtown ripples through the system, country’s most multi-cultural cities. The two universities plus that can be serviced with quality transit, creating a built-in
causing unpredictable traffic patterns, increased degradation of many other post-secondary educational institutions make ridership for transit and reducing the need for car travel.
journey times, increased pollution, and rider dissatisfaction. The Ottawa one of Canada’s high technology research hubs and one
2008 TMP concluded that the system will no longer be able to of the top five telecommunications research and development 3.3 Prior Planning Work
expand service to meet the projected demand for transit beyond centres in the world. Projections of Ottawa’s long-term growth As noted in Section 2.0, the new Provincial Regulation for
3-2 2018. are fundamental to the City’s planning of land use and Transit EA studies permits the City to rely on prior planning
infrastructure needs. In 2003, the City released Ottawa 20/20 work to focus the study and move forward with design and
In addition to OC Transpo service, Société de transport de as its growth management strategy “for managing growth over
l’Outaouais (STO) buses also use the road network in Ottawa’s construction. Prior planning work undertaken for this project
the next 20 years in ways that will reinforce the qualities most consists of the TMP update and the project planning phase for
downtown core and operate in mixed traffic on Wellington valued by the city’s residents: the availability of high-quality
Street and within exclusive bus and general traffic lanes on the DOTT Planning and Environmental Assessment Study,
services; its reputation for innovative economic development and which was initiated in June, 2008 and completed in January,
Rideau Street. This service currently amounts to approximately exciting job opportunities; liveable communities; diverse artistic
120 buses in the peak direction during the afternoon peak hour, 2010 with Ottawa City Council approval of the Recommended
and cultural life; varied housing forms; green and open spaces; Plan (functional design) for the project. The following section
carrying as many as 4,400 passengers per hour. Similar issues and the heritage landmarks and landforms that distinguish
with service levels and reliability have been reviewed by STO outlines the work undertaken as part of the TMP update, while
Ottawa from all other cities.” the remaining sections of this report deal with the work
staff and ridership continues to grow to fill any capacity created.
Based on the following principles, the Ottawa 20/20 vision undertaken as part of the project planning phase for the DOTT
A major part of the work completed during the City of Ottawa’s became the foundation of a series of growth management plans project.
2008 TMP update was the resolution of these existing and to guide the City’s growth in physical development (Official
future issues. The TMP outlines the transportation 3.3.1 Transportation Master Plan
Plan), economic development (Economic Strategy), people The Council-approved 2008 TMP update and its supporting
infrastructure needed to support the City's projected population development (Human Services Plan), cultural development (Arts
and employment levels for the year 2031. In the first phase of documents, addresses major issues such as project need, corridor
and Heritage Plan), and ecological development (Environmental development (including surface versus tunnel), and technology
the plan, which extends out to the year 2021, the City of Strategy):
Ottawa will invest in 40 km of new light rail transit (LRT) and assessment (such as bus versus train). The conclusions of this
vehicles to service these lines, as well as bus rapid transit work were based on an analysis of future travel demand to the
• A Caring and Inclusive City year 2031 based on project growth in population and
technology and additional bus lanes.
• A Creative City Rich in Heritage, Unique in Identity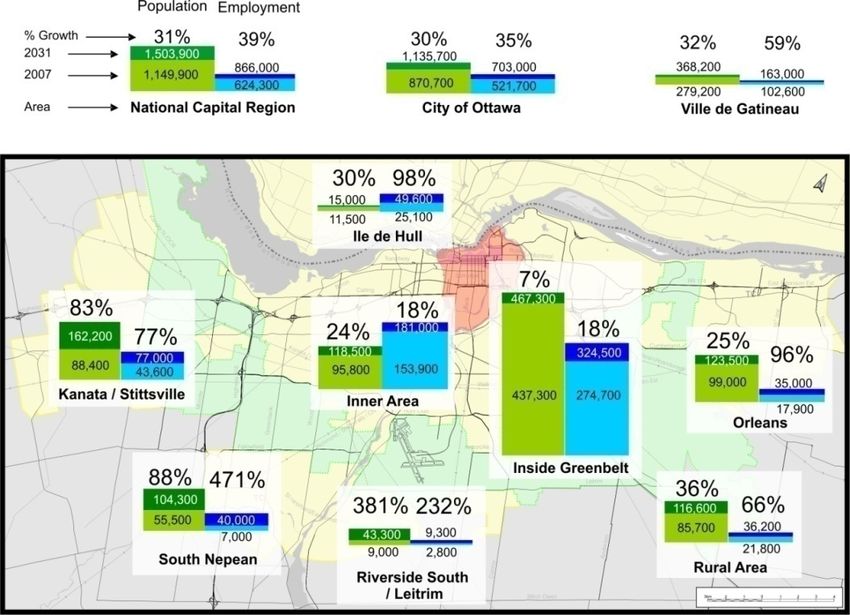
employment and policies designed to promote intensification                projected 2031 employment for Ottawa within the Inner         transit ridership is forecast to increase substantially. The major
and encourage transit use.                                                 Area and 30% of employment for Ile de Hull when               changes include increases in the mode split, or percentage of
                                                                           compared with all employment across the Outaouais in          motorized trips taken by transit, and growth in population and
Growth Projections                                                         2031).                                                        employment. For instance mode split is predicted to increase
As part of the 2008 Transportation Master Plan update,                                                                                   from:
extensive modelling of travel demand has been undertaken to          Figure 3-1: Major Growth Areas - 2031 Planning Horizon
develop projections out to the 2031 horizon year. The model                                                                                 • 28% to 36% of all trips originating in the City’s Inner
development begins with the City’s approved population and                                                                                    Area (the area bounded by the O-Train corridor, the
employment growth projections and the related land use                                                                                        Rideau River and the Ottawa River, including the CBD),
planning principles. Available serviced land, assumptions about                                                                             • 25% to 33% of all trips originating inside the Greenbelt,
in-fill development and the types of development allowed under                                                                                and
the Official Plan were used to create a distribution of population                                                                          • 24% to 29% of all trips originating outside the
and employment. This distribution is then used to forecast                                                                                    Greenbelt,
City-wide travel demands for 2031.                                                                                                          • 46% to 55% for trips destined to the Inner Area
                                                                                                                                            • 28% to 36% of all trips destined to inside the Greenbelt,
Population and Employment Growth Projections within the Downtown:
                                                                                                                                              and
2031
                                                                                                                                            • 9% to 19% of all trips destined outside the Greenbelt.
The City’s current 2031 growth projections considered the
Greater Ottawa-Gatineau Area and predicted a 2031 population                                                                             When these increases in mode split are combined with the              3-3
of 1,136,000, with employment levels projected to increase to                                                                            increases in population and employment overall transit ridership
703,000. Overall, the geographic distribution of the growth in                                                                           is expected to increase, over current ridership levels, by 76% and
both population and employment levels across the planning                                                                                85% percent for the National Capital Region (including travel
regions is depicted in Figure 3-1, and is summarized as follows:                                                                         to and from the Quebec side of the Ottawa River).
                                                                     Travel Demand Forecast: 2031
   • The population growth projected for areas inside the            Forecasting growth in travel requires a pattern of travel and a     Regional Travel Desire Lines
     Greenbelt (52,700 persons) will be relatively evenly split      set of assumptions about how people make travel choices. The        While the overall demand for travel is important, it is also
     between the Inner Area and the remaining urban areas            basic assumptions are tested using current population,              necessary to understand future regional travel patterns. These
     inside the Greenbelt. This suggests increasing                  employment and travel demand information and are then               patterns can be easily seen when looking at the major travel
     intensification within the Inner Area and reflects the          applied to the future population and employment pattern with        desire lines between sectors of the City. The figure below gives
     aging of the resident population and lower average              the assistance of the long-range planning model (TRANS              a graphical representation of travel demand based on future
     number of persons per household.                                Model). The travel behaviour used in the current model is based     demographic patterns, including projected increases in
                                                                     on the information identified in the 2005 Origin-Destination        employment and population. Travel desire lines between
   • Employment growth across the City will be split between         (O-D) Survey. This survey provides insight into how people          planning districts were identified and categorized based on their
     areas inside the Greenbelt (42%) and urban centres              make their travel decisions.                                        magnitudes as follows:
     outside the Greenbelt (50%). Both the Ottawa and
     Gatineau core areas will continue to accommodate, on a          A review of the forecast motorized travel demand for the City of    Primary Travel Desire Lines – those with a threshold of 1,700
     proportional basis, equal percentages of the total              Ottawa indicates that a significant portion of the growth will be   district to district trips per hour (a.m. peak hour person travel),
     employment located in each of the cities (26% of the            accommodated by public transit. City-wide growth in public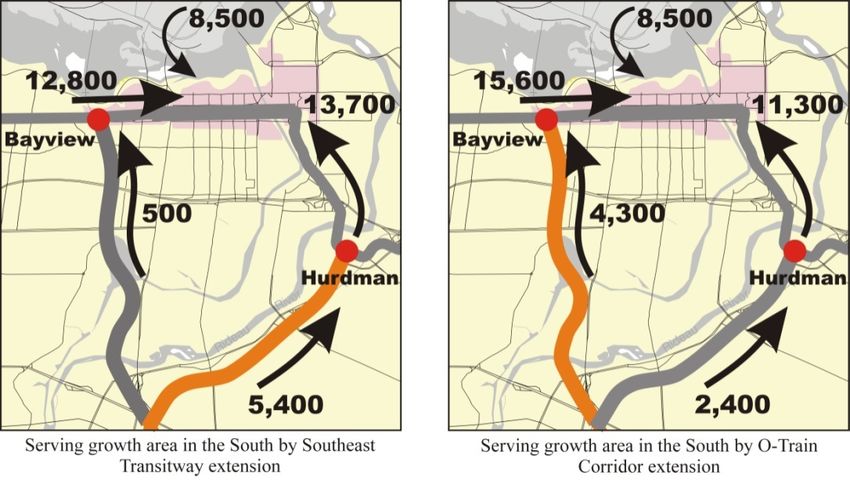
Secondary Travel Desire Lines – those which capture between                      complex in the Carling/Booth area. Just west of the Inner Area,     a.m. peak hour. Using the travel demand data discussed in the
      1,100 and 1,700 district to district trips per hour, and                         the federal employment node at Tunney’s Pasture and the             previous section, the two network options to serve the southern
      Tertiary Travel Desire Lines – those which capture between                       Ottawa Hospital Civic Campus also have a direct influence on        growth areas were analyzed separately. The results are outlined
      500 and 1,100 district to district trips per hour.                               Inner Area travel demands.                                          in Table 3-1, which identify that the extension of Light Rail in
                                                                                                                                                           the O-Train corridor to serve Riverside South shifts the peak
      Figure 3-2 illustrates the future major travel desire lines,                     Once the patterns are known, the model can assign those trips       passenger load point from east of Ottawa’s downtown to the
      highlighting both the number of trips between districts as well                  to the transit network. The bus routes, including the               west side (just west of the downtown) and shown in Figure 3-4,
      as the transit mode split. The width of arrow indicates the                      Transitway, are used to generate Figure 3-3, which is a graphical   which highlights the difference brought about by which corridor
      magnitude of travel (number of a.m. peak hour person trips) and                  representation of the a.m. peak transit travel demand generated     is chosen to carry the majority of customers from the southern
      the colour of the arrow indicates the transit mode split (higher                 by the TRANS model. The width of the line indicates the             growth communities.
      mode splits are represented by increased colour tones and                        number of trips, and illustrates that by 2031 the majority of
      shading).                                                                        transit trips converge in the downtown, being principally fed by    Table 3-1: Network Impacts on Downtown Peak
                                                                                       the East and West Transitways, as well as from Gatineau.                       Passenger Load Point Forecasts
      Figure 3-2: Future Growth in Primary Desire Lines
      (District to District OD pairs greater than 1,700 a.m. peak hour person trips)   Figure 3-3: 2031 Transit Trip Assignments                             Light Rail Services the South   West of CBD   East of CBD
                                                                                                                                                                                                                         From Gatineau
                                                                                                                                                                       Through                (LeBreton)   (Hurdman)
                                                                                                                                                             Southeast Transitway
                                                                                                                                                                                               12,800        13,700         8,500
                                                                                                                                                             Corridor extension

3-4                                                                                                                                                          O-Train Corridor extension        15,600        11,300         8,500

                                                                                                                                                           Figure 3-4: 2031 Downtown Transit Demands

      The assessment demonstrates that Ottawa’s Inner Area is the                      Future Transit Ridership in the Downtown
      most significant destination for travel during the a.m. peak.                    In order to determine the future transit service levels in the
      Major employment nodes located within Ottawa’s Inner Area                        downtown, it was first necessary to identify the peak passenger
      include not only the central business district (CBD) but also                    load points on those segments of the rapid transit network that
      Carleton and Ottawa Universities and the federal employment                      lead into the downtown. These peak load points identify the
                                                                                       maximum passenger volumes that must be carried during the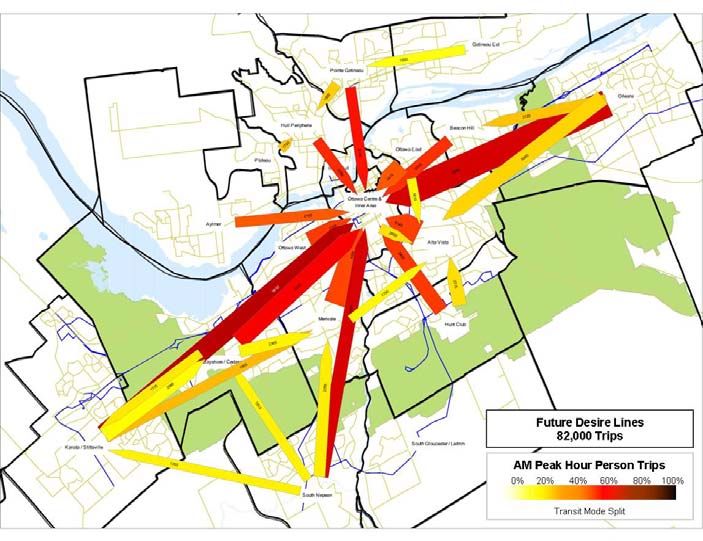
3.4 Ridership on the DOTT Line                                                o 4.6 million new trips in the opening year,
The project was designed to respond to the growth of the City,                o 29 million new trips per year in 2031, and
and provide increased transit capacity into the city core. The                o Cumulative 627.4 million new trips between an
need for the project is based on the Transportation Master Plan                 opening in 2019 and 2038.
analysis which indicates that over the planning period:
                                                                    More than 40% of all transit trips taken in the City will use the
                                                                    DOTT project for all or part of their journey, with the
   •   Population will increase 30%
                                                                    downtown stations predicted to handle more than 50 million
   •   Employment will increase by 35%
                                                                    annual trips in 2031.
   •   Mode split will increase from 23 to 30%, and
   •   Transit ridership will increase by 76%, or 91.5 million to   3.5 Benefits of the DOTT Line
       161 million annual trips.                                    While ridership and improved mobility are the prime benefits of
                                                                    the project, there are additional benefits as the project is forecast
By providing greater transportation choice, and adding more
                                                                    to reduce carbon dioxide emissions by approximately 38,000
capacity, riders will see:
                                                                    tonnes in 2031. It will also reduce criteria air contaminant
                                                                    emissions by approximately 1750 tonnes in the same year.
   •   Reduced travel times,
                                                                    Similarly vehicle kilometres of travel will be reduced, reducing
   •   Reduced congestion downtown,                                                                                                         3-5
   •   More efficient transit operations, and                       overall vehicle operating costs, accident costs and road network
   •   Improved levels of comfort and convenience.                  congestion. Section 10.2 provides more detail on the benefits of
                                                                    the DOTT project.
The DOTT project will provide a substantial increase in carrying
capacity through the core and will contribute to significant        The DOTT project will also allow for redevelopment and
ridership increases. Ridership estimates from the Transportation    transit-integrated development in the downtown. This will help
Master Plan indicate that:                                          the City achieve its targets for increased reurbanization and
                                                                    intensification and the protection of agricultural and sensitive
   • Total system ridership is expected to increase from 91.5       environmental areas against urban population and expansion
     million to 161 million trips per annum,                        pressure.
   • Ridership on the DOTT line is estimated at;
        o 51 million trips in 2021, and
        o 76 million trips in 2031.

   • The TMP model indicates that there will be a ridership
     uplift of 9% through the introduction of LRT. This
     translates to;
You can also read