Frasers Centrepoint Trust - Investor Presentation at SGX REIT Day Imperial Hotel, Tokyo, Japan 27 October 2016 Presented by: Dr Chew Tuan Chiong ...
←
→
Page content transcription
If your browser does not render page correctly, please read the page content below
Frasers Centrepoint Trust
Investor Presentation at SGX REIT Day
Imperial Hotel, Tokyo, Japan
27 October 2016
Presented by:
Dr Chew Tuan Chiong
CEO, Frasers Centrepoint Asset Management Ltd

27 October 2016

Important notice

Certain statements in this Presentation constitute “forward-looking statements”, including forward-looking financial information. Such
forward-looking statement and financial information involve known and unknown risks, uncertainties and other factors which may
cause the actual results, performance or achievements of FCT or the Manager, or industry results, to be materially different from any
future results, performance or achievements expressed or implied by such forward-looking statements and financial information. Such
forward-looking statements and financial information are based on numerous assumptions regarding the Manager’s present and future
business strategies and the environment in which FCT or the Manager will operate in the future. Because these statements and financial
information reflect the Manager’s current views concerning future events, these statements and financial information necessarily
involve risks, uncertainties and assumptions. Actual future performance could differ materially from these forward-looking statements
and financial information.

The Manager expressly disclaims any obligation or undertaking to release publicly any updates or revisions to any forward-looking
statement or financial information contained in this Presentation to reflect any change in the Manager’s expectations with regard
thereto or any change in events, conditions or circumstances on which any such statement or information is based, subject to
compliance with all applicable laws and regulations and/or the rules of the SGX-ST and/or any other regulatory or supervisory body or
agency.

This Presentation contains certain information with respect to the trade sectors of FCT’s tenants. The Manager has determined the
trade sectors in which FCT’s tenants are primarily involved based on the Manager’s general understanding of the business activities
conducted by such tenants. The Manager’s knowledge of the business activities of FCT’s tenants is necessarily limited and such tenants
may conduct business activities that are in addition to, or different from, those shown herein.

This Presentation includes market and industry data and forecast that have been obtained from internal survey, reports and studies,
where appropriate, as well as market research, publicly available information and industry publications. Industry publications, surveys
and forecasts generally state that the information they contain has been obtained from sources believed to be reliable, but there can be
no assurance as to the accuracy or completeness of such included information. While the Manager has taken reasonable steps to
ensure that the information is extracted accurately and in its proper context, the Manager has not independently verified any of the
data from third party sources or ascertained the underlying economic assumptions relied upon therein.

                                                                                                                                           2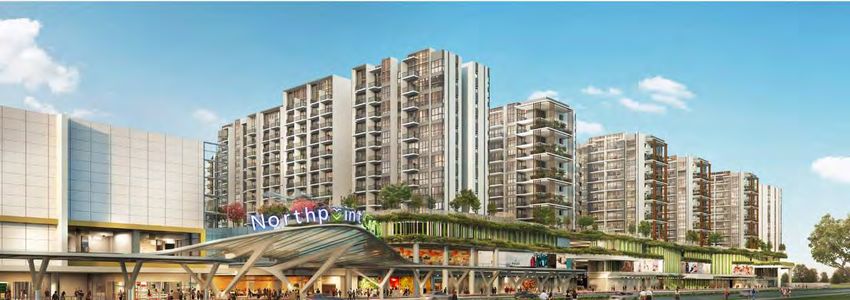
Contents
Section Slide number
FCT Overview 4
Financial Performance Overview 12
Unit Price Performance 17
Growth Strategy 20
Conclusion 26
3
Causeway Point

FCT Overview

FCT Overview
Frasers Centrepoint Trust (FCT)
S$2bn 6 7.5%
Market Suburban Retail DPU CAGR since IPO in
Capitalisation1 Properties in Singapore, 2006
total NLA 1.1 m sq ft
1. Based on closing price of $2.20 on 30 Sep 2016
DPU: Distribution per Unit
CAGR: Compounded Annual Growth Rate 5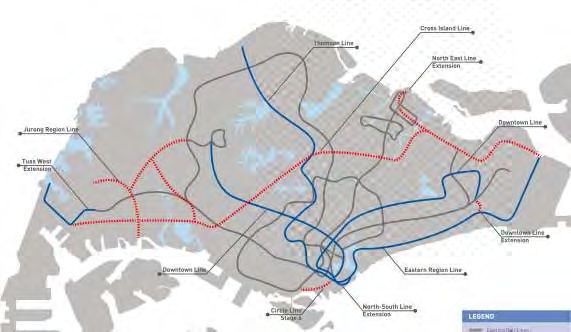
FCT Overview
Located near MRT stations / Bus interchanges
In high population residential areas in Singapore
Woodlands
BUS
Yishun
YewTee BUS
Expo
Bedok
BUS
Queenstown
Map source: URA Master Plan 2014
Illustration not to scale
6 FCT Overview
Focused on daily shopping, dining and services
Fashion wear Supermarket Pharmacy
Food Court Specialty F&B Services
7 FCT Overview
Destination for family, events and social activities
Public Library Play Area Mini-Concerts
Performances
Festive celebrations Community and Family events
8 FCT Overview
F&B, Fashion and Services accounts for 66% of
total rental income
% of Total Rental By Trade Sector
(30 June 2016) 0.0% 5.0% 10.0% 15.0% 20.0% 25.0% 30.0% 35.0% 40.0%
Food & Restaurants 35.4%
Fashion 21.4%
Services/Education 8.9%
Beauty, Hair, Cosmetics, Personal Care 7.9%
Household 7.2%
Supermarket 4.3%
Healthcare 4.0%
Department Store 3.5%
Sports Apparels & Equipment 3.2%
Books, Music, Art & Craft, Hobbies 2.8%
Leisure/Entertainment 1.3%
9 FCT Overview
Healthy shopper traffic from local catchment
FY2015 Shopper Traffic at FCT’s 3 largest malls
24.9m 41.3m 10.6m
shoppers per year shoppers per year shoppers per year
2.1m per month 3.4m per month 0.9m per month
Rest of 3 smaller malls: 20.4m
FY2015 Total portfolio shopper traffic: 97.2m
Source: Shopper Traffic data for FY2015 (Oct 2014 – Sep 2015)
10 FCT Overview
Milestones
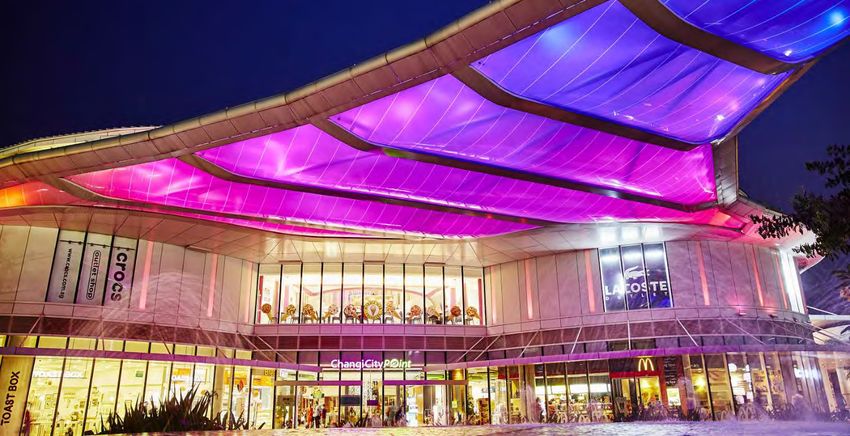
Northpoint 2 YewTee Point Bedok Point Changi City Point
IPO
5 July 2006
Properties: 3
Total Assets: • Acquired: 5 Feb 2010 • Acquired: 23 Sep 2011 • Acquired: 16 Jun 2014
$983m • Purchase price: $290.2m • Purchase price: $127.0m • Purchase price: $305.0m
June 2016
Properties: 6
Total Assets:
$2,553m
Anchorpoint AEI Northpoint AEI Causeway Point AEI
• Completed: May 2008 • Completed: Mar 2010 • Completed: Dec 2012
• Capex: $12.8m • Capex: $38.6m • Capex: $71.8m
• ROI: 14.1% • ROI: 10.7% • ROI: 17%
• Net Value Creation: $18.5m • Net value creation: $32.7m • Net value creation: $204m
11Changi City Point Financial Performance Overview
Financial Performance Overview
Steady and consistent growth through economic cycles
Gross Revenue (S$ million) Net Property Income (S$ million)
200 189.2
180 168.8
158.0
160
147.2
140 140 131.0
117.9 118.1
120 114.7 120 111.6
104.4
100 100
84.7 86.6 82.6
77.5 80.1
80 80
56.6 59.9
60 60 51.7
40 40
20 20
0 0
FY2007 FY2008 FY2009 FY2010 FY2011 FY2012 FY2013 FY2014 FY2015 FY2007 FY2008 FY2009 FY2010 FY2011 FY2012 FY2013 FY2014 FY2015
Note: FCT Financial year ends 30 Sep
13 Financial Performance Overview
Delivering steady and growing distributions
Nine consecutive years of DPU growth since listing
Distribution per Unit (S cents)
CAGR FY2006 – FY2015: 7.5%
11.608
10.93 11.187
10.01
8.20 8.32
7.29 7.51
6.55
6.03*
FY2006 FY2007 FY2008 FY2009 FY2010 FY2011 FY2012 FY2013 FY2014 FY2015
(IPO)
Note: FCT Financial year ends 30 September
FY2006 DPU of 6.03 cents is derived by annualising 4QFY06 DPU
14
CAGR: compound annual growth rate. Financial Performance Overview
Stable and healthy gearing level
Gearing level1 Key financial position indicators
As at 30 Jun 16 30 Sep 15
Gearing level1 28.5% 28.2%
31.3%
29.2% 29.9% 30.3% 30.1% 29.3% Interest cover2 7.07 times 7.09 times
28.1% 27.6% 28.2% 28.3% 28.3% 28.5%
Total borrowings $729m $718m
% of borrowing on
fixed rates or hedged 78%3 75%
via interest rate swaps
All-in average cost of
2.259% 2.404%
borrowings
S&P: BBB+/Stable
Corporate credit rating
Moody’s: Baa1/Positive
30/9/07 30/9/08 30/9/09 30/9/10 30/9/11 30/9/12 30/9/13 30/9/14 30/9/1531/12/1531/3/16 30/6/16
1. Calculated as the ratio of total outstanding borrowings over total assets as at stated balance sheet date.
2. Calculated as earnings before interest and tax (EBIT) divided by interest expense for the quarters ended Jun 2016 and Sep 2015, respectively
3. FCT refinanced $136m of secured bank borrowing on 4 July 2016. Following this refinancing, the percentage of borrowing on fixed interest
rates is approximately 59%.
15 Financial Performance Overview
Weighted average debt maturity @ 30 June 2016: 2.0 years
Type of borrowings Aggregate amount
Unsecured bank borrowings: S$173 million (23.7%)
Medium Term Note: S$270 million (37.1%)
Secured bank borrowings: S$286 million (39.2%)
Total Borrowings: S$729 million (100.0%)
$190m
(26.1% of total
$159m borrowing)
(21.8% of total $130m
borrowing) $120m (17.8% of total
$30m
(16.5% of total borrowing)
$23m borrowing)
$60m $70m
$90m (8.2% of total (9.6% of total
$50m
borrowing) $60m borrowing)
*$136m
$70m $70m $80m
$60m $60m
FY2016 FY2017 FY2018 FY2019 FY2020 FY2021
* The $136m Secured Bank Borrowing has been refinanced on 4 July 2016
Details of the respective borrowings can be found in the appendix section of this presentation deck
BPT: Bedok Point, NPT: Northpoint, ACP: Anchorpoint
16Artist’s impression
Causeway Point
Unit Price Performance Unit Price Performance
FCT unit price performance versus the FTSE REIT Index
Period: July 31, 2006 to September 30, 2016
31 Jul 2006 = Base 100
FCT: 207.5
FTSE REIT: 113.8
Source: Bloomberg
18 Unit Price Performance: Research Coverage on FCT
Firm name (alphabetical order) Analyst
Analyst’s Calls
1. BNP Paribas Lim Wee Liat Buy/Outperform: 13
2. Bank of America Merrill Lynch Ong Choon Keong Hold/Neutral: 4
3. CIMB Lock Mun Yee Sell/Underperform: 1
4. Citi Research Adrian Chua Total: 18
5. CLSA Tan Xuan
6. Credit Suisse Nicholas Teh
7. Daiwa David Lum
8. DBS Vickers Derek Tan
9. HSBC Pratik Ray
10. JP Morgan Brandon Lee
11. KGI Team Coverage
12. Maybank Kim Eng Team Coverage
13. OCBC Investment Research Andy Wong
14. Phillip Research Tan De Hong
15. Religare Pang Ti Wee
16. RHB Vijay Natarajan
17. UBS Michael Lim
18. UOB Kay Hian Vikrant Pandey
* As at 30 September 2016
19Artist’s impression: Northpoint City Growth Strategy
Growth Strategy
Clear growth strategy
Strategy Key drivers
1
Acquisition growth • Sponsor’s pipeline assets
• 3rd party asset acquisition, including in
Singapore and overseas
2 • Enhance configuration of floor plates / layout
Enhancement growth to achieve better asset yield and sustainable
income growth
• Value creation through better income-
producing capability after Asset Enhancement
Initiative (AEI)
3
Organic growth • Positive rental reversions and maintaining
healthy portfolio occupancy
• Annual rental step-ups provide steady growth
21 Growth Strategy: Acquisition Growth
Sponsor’s retail assets in Singapore
Northpoint Retail Component of
Northpoint City (2)
Causeway Point
(under development)
YewTee Point
The Centrepoint Artist’s impression
Waterway Point (1)
Opened Jan 2016
Bedok Point Eastpoint
Anchorpoint Changi City Point
Robertson
Walk
FCT malls (6) Valley Point
FCL-owned and managed malls (5) (include properties held through joint ventures)
FCL-managed mall (1) (owned by 3rd party)
Illustration is not to scale
(1): FCL owns 1/3 proportionate share of Waterway Point, the commercial component of a mixed development in Punggol.
(2): FCL is developing a mixed commercial and residential site under the Government Land Sale programme, of which the
commercial component can be developed into a retail mall 22 Growth Strategy: Enhancement Growth
Summary of past Asset Enhancement Initiatives (AEIs)
Anchorpoint Northpoint Causeway Point
(completed Nov 2007,
(completed Mar 2010) (completed Dec 2012)
relaunched in May 2008)
Change in average rent Before AEI : $5.32 Before AEI : $11.00 Before AEI : $10.20
per sq ft / mth before After AEI : $7.50 41% After AEI : $13.20 20% After AEI : $13.50 32%
and after AEI
Before AEI : $1.7m Before AEI : $13.9m Before AEI : $42.2m
Change in mall’s NPI After AEI : $3.5m 106% After AEI : $18.0m 30% After AEI : $54.5m 29%
Capex for AEI $12.8m $38.6m $71.8m
Return on investment
14.1% 10.7% 17.1%
of AEI
Net value creation $18.5m $32.7m $204m
23 Growth Strategy: Enhancement Growth -> Northpoint AEI
Asset Enhancement Initiative (AEI) for Northpoint Shopping Centre
The AEI at Northpoint is part of the
overall strategy to periodically
upgrade our malls to provide
sustainable income growth for FCT
18-month AEI commenced in March
2016, expected completion is in
September 2017
AEI Capex budgeted at $60 millionThe
net lettable area of Northpoint is
projected to be reduced by about 4%
due to reconfiguration of the mall
FCAM aims to improve the average
gross rental rate of Northpoint by
approximately 9% upon the
completion of the AEI
24 Growth Strategy: Organic Growth
Maintaining healthy rental reversions
FCT rental reversions1 (FY2007 – 9MFY2016)
15.0%
14.0%
12.8%
12.1%
10.9%
8.6%
7.2% 7.7%
6.5% 6.3%
FY2007 FY2008 FY2009 FY2010 FY2011 FY2012 FY2013 FY2014 FY2015 9MFY2016
1. Change between the average rental rates between the new lease and the preceding lease contracted typically 3 years ago
25Conclusion
Conclusion
Takeaways
Track-record of consistent performance and steady returns
Focused on Singapore suburban retail sector: stable and resilient
Prudent capital management
Transparency in Corporate Governance and disclosure
Well-positioned for future growth
27Thank you Analyst & media contact: Chen Fung-Leng Frasers Centrepoint Asset Management Ltd Tel: (65) 6277-2657 Email: fungleng.chen@fraserscentrepoint.com Website: www.fct.sg
You can also read