Company Overview August 2021 - The pathway to possible - Crown Castle
←
→
Page content transcription
If your browser does not render page correctly, please read the page content below
Company
Overview
August 2021

              The pathway to possible.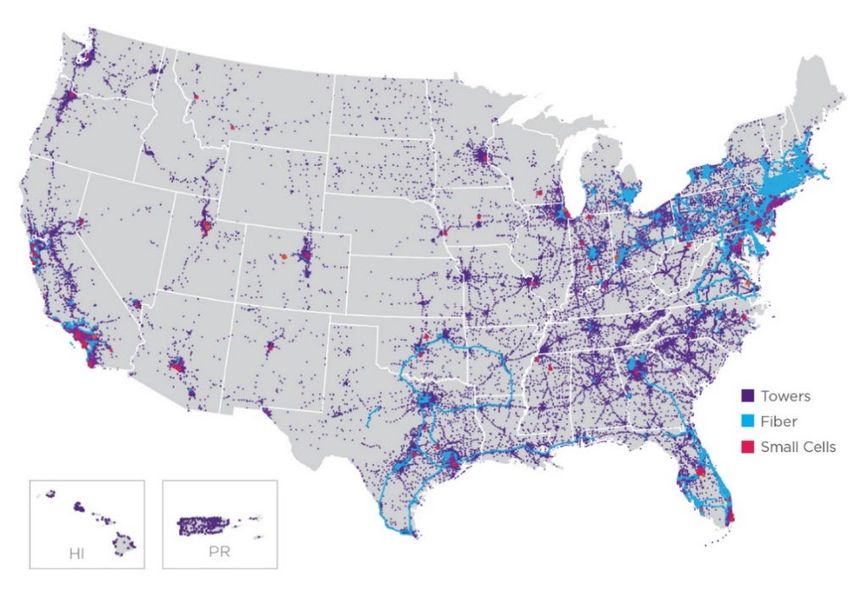
Cautionary Information
This presentation contains forward-looking statements and information (“Forward-Looking Statements”) that are based on our management's
current expectations. Statements that are not historical facts or third-party statistics are hereby identified as Forward-Looking Statements. In
addition, words such as "estimate," "see," "anticipate," "project," "plan," "intend," "believe," "expect," "likely," "predicted," "positioned,"
"continue," "target," and any variations of these words and similar expressions are intended to identify Forward-Looking Statements. Such
statements may include our plans, projections, and estimates regarding (1) our business, strategy (including small cell strategy), strategic
position, business model and capabilities, and the strength thereof, (2) potential benefits, growth, returns, opportunities and shareholder return
and values which may be derived from our business, strategy (including small cell strategy), assets (including yields therefrom), investments,
acquisitions and dividends, (3) data demand, (4) growth in carrier network investment, including drivers thereof, and potential benefits derived
therefrom, (5) mobile data traffic, speed and growth in demand for, and consumption of, mobile data, (6) dividends, dividend yield (including
on an annualized basis), and dividend per share growth rate, including its driving factors, (7) demand for our sites and services, (8) access to
capital and capital allocation, (9) our long-and short-term prospects and the trends, events and industry activities impacting our business, (10)
our small cell footprint, and growth thereof, and small cell market opportunity, including the number of on-air small cell nodes in the U.S., small
cell node densities and number of small cell tenants, and benefits expected therefrom, (11) 5G deployment and the potential value thereof to our
business and strategy (including small cell strategy), (12) debt maturities and (13) AFFO per share growth. All future dividends are subject to
declaration by Crown Castle’s board of directors.

This presentation also contains modeling and information (“Hypotheticals”), which are presented for illustrative purposes only. Such
Hypotheticals are not guarantees or otherwise indicative of future performance.

Forward-Looking Statements and Hypotheticals are subject to certain risks, uncertainties and assumptions, including prevailing market
conditions and other factors. Should one or more of these risks or uncertainties materialize, or should any underlying assumptions prove
incorrect, actual results may vary materially from those expected or illustrated in this presentation. Such Forward-Looking Statements and
Hypotheticals should be considered in light of all relevant risk factors included in our filings with the Securities and Exchange Commission.
Trading in securities involves a high degree of risk, and losses can be substantial. Crown Castle assumes no obligation to update publicly any
Forward-Looking Statements and Hypotheticals, whether as a result of new information, future events or otherwise. None of the information
provided in this presentation constitutes investment recommendation or investment advice.

This presentation includes certain non-GAAP financial measures, including AFFO per share growth, Segment Net Invested Capital and Segment
Cash Yield on Invested Capital. Definitions and tables reconciling such non-GAAP financial measures are set forth in the Supplemental
Information Package and Non-GAAP Reconciliations for the quarter ended June 30, 2021 (“Supplemental Information Package”), which is
posted in the Investors section of Crown Castle's website at investor.crowncastle.com. As used in this presentation, the term "including" and
any variations thereof, means "including without limitation."

                                                                                                                                          PAGE 2
                                                                                                                                        PROPRIETARY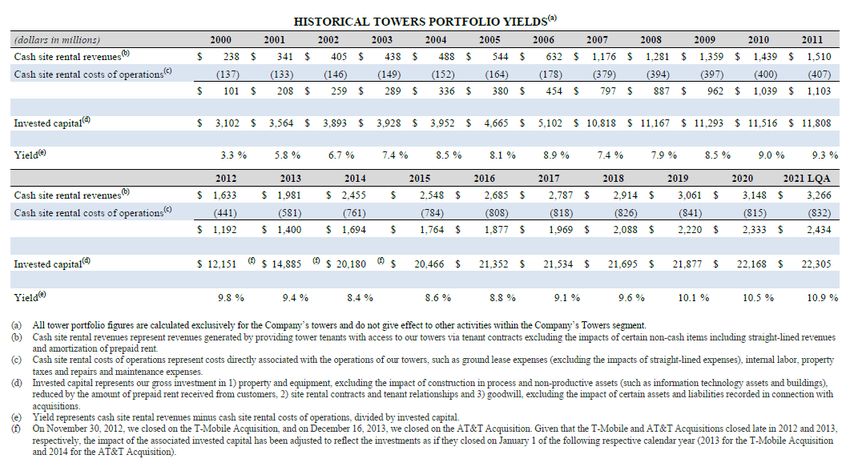
Overview of
Crown Castle

                 PAGE 3
               PROPRIETARY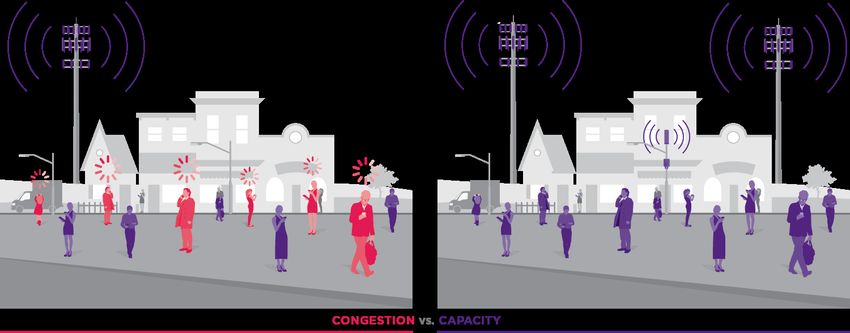
Crown Castle At A Glance
                                                                                                                           Asset Overview   (1)

    Dividend per Share(1,2)                                     $5.32

    Dividend Yield(1,2)                                          2.7%
                                                                                                  > 40K                     ~ 80K Small     ~ 80K Route
    Enterprise   Value(1)                                     $104BN                              Towers             (3)
                                                                                                                               Cells
                                                                                                                                    (4)
                                                                                                                                            Miles of Fiber
    Weighted Average Remaining
    Tenant Contract Term(1,5,6)                                6 Years

    Remaining Contracted
    Tenant Receivables(1,6)                                    $32BN

•      5G deployment is driving highest level of Tower activity in
       our history, supporting our expected 12% AFFO per share
       growth for full year 2021(7).

•      Since expanding fiber and small cell strategy in 2017, we
       have grown dividends per share at a compounded annual
       rate of 9%.

•      Diverse offering of towers, small cells, and fiber solutions
       uniquely positions Crown Castle to capitalize on 5G
       deployment and extends our opportunity to deliver dividend
       per share growth of       7-8% per year.

•      Compelling total return opportunity complemented by lower
       (see Earnings Release) risk profile with 100% focus on U.S.
       market and a high-quality investment grade balance sheet.

                            1.   As of 6/30/21 close.
                            2.   Based on Q2 2021 dividend per share annualized, declared on 5/21/21.
                            3.   Number of towers and other structures, such as rooftops (collectively, “towers“).                                  PAGE 4
                            4.   Number of small cell nodes on air or committed in backlog.
                            5.   Weighted by site rental revenues.                                                                                PROPRIETARY
                            6.   Excludes renewal terms at tenants’ option.
                            7.   On an as adjusted basis (see Earnings release)
Leading Portfolio of Shared Communication
Infrastructure Assets(1)
2 ~80K
1 >40K Small Cells
Towers Enable additional network
Provide the critical foundation densification by offloading
for coverage and capacity traffic and bolstering
capacity in the areas of the
network where data
demand is the greatest
3 ~80K
Route Miles of Fiber
Increase returns on fiber investments by
sharing the same fiber assets across
thousands of fiber solutions customers
1. As of 6/30/21 close. PAGE 5
PROPRIETARYMaximizing Shareholder Value by Focusing on
Growing Long-Term, High-Quality Dividends
Drive organic growth by
leasing our existing portfolio
of >40K well-located towers
and ~80K route miles of high-
capacity fiber
Allocate capital to accretive
discretionary investments
that support our long-term
dividends per share growth
target of 7-8% annually
Maintain a strong investment
grade balance sheet to ensure
consistent access to capital
PAGE 6
PROPRIETARYBalanced Approach to Capital Allocation
($ in billions)
Cumulative Discretionary Capital Allocated from FY 2011 to Q2 2021(1) Total Enterprise Value(2)
$104
Equity
Net Debt
Fiber
Acquisitions
$11
$23 External
Financing
29% 26%
Tower
Acquisitions
$9
$84
Fiber Capex $6
9%
21% Tower Capex $4
15% Cash Flow
Common $19 From Operations (3)
$20
Stock
Dividends &
Share
$12 $13
Buybacks
$20
$7
(4)
2011 2021
1. FY Cumulative Discretionary Capital as of 6/30/21.
2. Enterprise values as of close on 12/31/10 and 6/30/21. PAGE 7
3. Excludes impacts related to our previously owned subsidiary that operated towers in
Australia (“CCAL"), which was sold in 2015. PROPRIETARY
4. Net debt includes $0.3 of preferred stock.Combination of Stability and Growth Provides
Compelling Total Return Opportunity
Attractive Dividend Yield Long-Term Growth Tailwinds
Dividends supported by high quality, long-term Embedded growth tied to contracted escalators
contracted lease payments on majority of revenue
Weighted average 6-years of remaining Data growth expected to drive continued
contracted lease payments totaling $32 billion(1) network investment
Investment grade balance sheet Well-positioned to capture network densification
with portfolio of towers, small cells and fiber
Provider of mission critical shared
communication infrastructure assets Proven track record of generating growth
through execution and capital allocation
100% focused on attractive U.S. communications
infrastructure market
1. As of 6/30/21; weighted by site rental revenues. Excludes renewal terms at tenants' option. PAGE 8
PROPRIETARYAttractive Industry
Growth Trends
PAGE 9
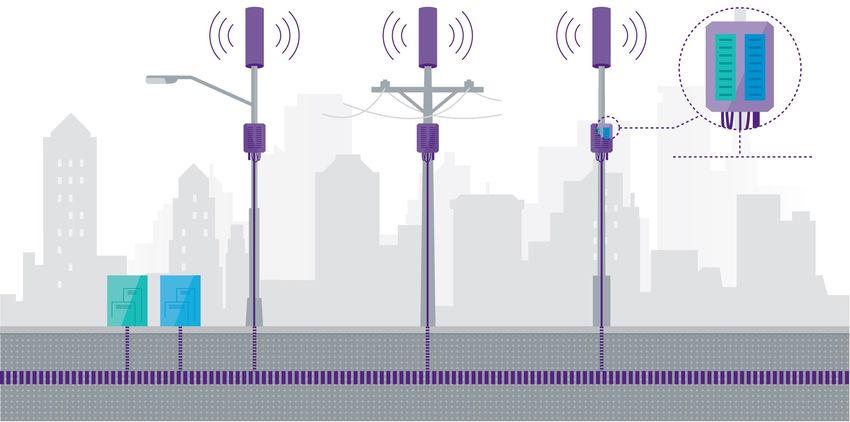
PROPRIETARYPositive Fundamentals Drive Significant Wireless
Infrastructure Investment in the U.S.
U.S. Wireless Capital Investment Mobile Data Usage Growth (MBs in trillions)
• ~$140bn since 2016 with $30bn in 2020 42.2
Capital Invested in U.S. U.S. Population as a %
as a % of Invested of Global Population
Capital Globally in 2020 in 2020
4%
18% 0.4
2010 2020
Cell Site Growth Spectrum Available (MHz)
> 80% of current spectrum is millimeter wave
~417k sites
~6,000
~150k sites
~300
2010 2020 2007 2020E
Source: CTIA 2021 Annual Survey Highlights and Wall Street research. PAGE 10
PROPRIETARYIncreasing Data Consumption is Driving the
Need for Denser Networks of Towers and Small
Cells
Wireless congestion
happens when too In addition to
many people try to use macro cell sites,
the same cell site at The best way to carriers are adding
once. relieve wireless more capacity in
congestion is to high traffic areas
add new with small cells.
infrastructure.
With increased data
usage, all that extra
demand can quickly
overload a cell site’s
capacity.
PAGE 11
PROPRIETARYWhat Are Small Cells?
Fiber fed small cells enable wireless carriers to add much needed coverage and
capacity to relieve congestion on their networks
Streetlights Utility Poles Slim Line Poles
Crown Castle assets
Wireless operator assets
Collocation of multiple
tenants on shareable
fiber asset drives high
incremental margin
and yields
Carriers enter into
long-term, renewable
leases to access fiber
and pole
PAGE 12
PROPRIETARYTowers And Small Cells Business Model Comparison
Towers Small Cells
Business Model Highlights:
Underlying Demand Driver Wireless data growth Wireless data growth and density
Customer Base Wireless carriers Wireless carriers
• Nationally negotiated contracts • Nationally negotiated contracts
Buying Decisions • Individual decisions made at market • Local market pricing conditions
level
Significant Demand Drivers 2G to 3G to 4G to 5G 4G to 5G
• High initial investment • High initial investment
• Lease-up over time • Lease-up over time
Business Model
• Shared infrastructure reduces cost • Shared infrastructure reduces cost
of ownership of ownership
• First mover • First mover at scale
Barriers to Entry
• Municipal regulations • Municipal and utility regulations
Unit Economics:
Initial Investment per Opportunity ~$500K - $1MM $10MM - $500MM
Initial Asset Yield 3-4% 6-7%
2-Tenant Asset Yield High single digits Low double digits
3-Tenant Asset Yield Mid-teens Mid-teens
Pace of Lease Up 1 tenant every 10 years 1 tenant every 10 years
Maintenance CapexCompelling Strategy
with Towers,
Small Cells and Fiber
PAGE 14
PROPRIETARYSnapshot of Towers and Fiber Segments(1) Towers
Fiber
11.0%
2.2
$22.9b
12 Yrs
7.3%
$15.1b
(3)
4 YrsSmall Cell Market Opportunity and Economics
Illustrative Small Cell Asset Yields:
Business Case and Market Estimates: Increasing Ratio of Small Cells per Fiber Mile
(Density) Results in Higher Asset Yields(4)
• Third party estimates for number of US ~15%
outdoor small cells on-air by 2025 range from
500K to 1 million, equating to a ~15% to ~30% 10-12%
CAGR(1)
6-7%
• We underwrite adding approximately one
additional small cell tenant (2-3 small cell
nodes per mile) every 10 years across our ~80K
fiber miles to achieve our targeted long-term
2-3 Small Cell 4-6 Small Cell 6-9 Small Cell
returns Nodes Per Mile Nodes Per Mile
Nodes Per Mile
(One Tenant) (Two Tenants) (Three Tenants)
• Underwriting one additional tenant every 10 Cash Yield and Tenancy By Segment(2,3)
years is consistent with both our underwriting
for towers and our experience to date
Tenancy
11.0%
• The addition of one small cell tenant, or 2-3
small cell nodes per mile, supports our long- 7.3%
term target growth rate in dividends per share 2.2
of 7-8% annually
< 1.0(3)
Fiber Towers
1. CTIA Annual Survey Highlights
2. Figures are as of 6/30/21.
PAGE 16
3. See Supplemental Information Package for further information on “Segment Cash Yield on Invested Capital.” PROPRIETARY
4. Small Cell 4G tenant is equivalent to 2-3 nodes per mile of fiber. Excludes contribution from Fiber Solutions tenants.High Quality, Low Risk Balance Sheet Strategy
($ in billions)
Debt Maturity Overview(1,2,3,4)
Balance Sheet Improvement:
12/31/15 6/30/21
Weighted Average Coupon 3.8% 3.2%
Weighted Average Life (yrs) 5.4 9.6
Fixed % 68% 93%
Unsecured % 53% 86%
$8.5
Fixed
Variable
$8.5
$3.6
$1.0
$2.1
$1.8
$0.1 $1.5
$1.3
$0.8 $0.1 $2.7
$2.0 $1.8
$0.1 $1.2 $1.5
$0.0 $0.8
2022 2023 2024 2025 2026 2027 2028 Thereafter
1. Except as otherwise noted, information is as of 6/30/21.
2. Gives effect to the use of net proceeds from the June 2021 senior notes offering to repay the Senior Secured Tower
Revenue Notes, Series 2015-1, in July 2021.
PAGE 17
3. Where applicable, maturities reflect the Anticipated Repayment Date, as defined in the respective debt agreement;
excludes finance leases and other obligations; amounts presented at face value, net of repurchases held at CCIC. PROPRIETARY
4. Debt maturities exclude outstanding commercial paper notes. Amounts available under the commercial paper program
may be borrowed, repaid and re-borrowed from time to time.Supplemental Definitions, Calculations, and
Additional Detail
PAGE 18
PROPRIETARYYou can also read