AUSTRALIAN PHARMACEUTICAL INDUSTRIES - 2018 HALF YEAR RESULTS PRESENTATION THURSDAY 19 APRIL 2018
←
→
Page content transcription
If your browser does not render page correctly, please read the page content below
AUSTRALIAN
PHARMACEUTICAL
INDUSTRIES
2018 HALF YEAR RESULTS PRESENTATION
THURSDAY 19 APRIL 2018

Important Notice

The material in this presentation is of general information about API’s activities current at the
date of the presentation. It is information given in summary form and does not purport to be
complete. Nothing in this presentation should be construed as a recommendation or forecast
by API or an offer to sell or a solicitation to buy or sell shares. It does not take into account the
investment objectives, financial situation or needs of a particular investor. These should be
considered with or without professional advice when deciding if an investment is appropriate.

This presentation contains certain non‐IFRS measures that API believes are relevant and
appropriate for the understanding of the business. Refer to Appendix 1 for further
information.

2018 HALF YEAR RESULTS PRESENTATION                                                                     2
GROUP PERFORMANCE
RICHARD VINCENT
CEO & MANAGING DIRECTOR

2018 HALF YEAR RESULTS PRESENTATION   3

Management Overview
BUSINESS FOCUS
Delivered slightly ahead on revised earnings
guidance with steady business performance
Management priorities are to deliver
Strong customer propositions in an evolving
market
Profitable organic growth from core assets
Sustained improvements on balance sheet
Assess prudent scalable acquisitions
2018 HALF YEAR RESULTS PRESENTATION 4
Business Progress
BUSINESS UPDATE
1. Develop stronger customer propositions in an evolving market
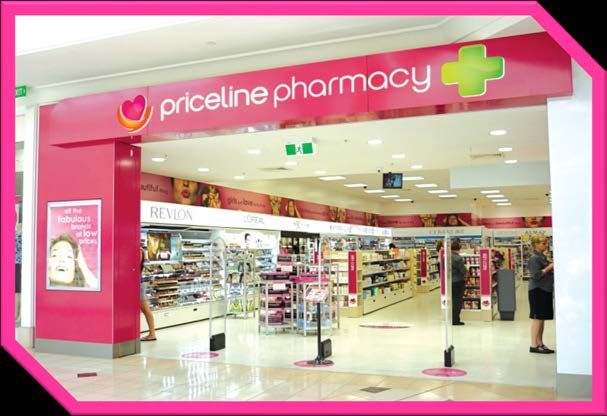
New Priceline Pharmacy leadership and restructure with increased focus on differentiating product offer and
building loyalty program
Investment in banner brands and independent pharmacy services to maintain market position and returns
2. Profitable organic growth from core assets
Cost base adjusted with re-engineered support service teams
Consumer Brands product portfolio investment beginning to realise value
Industry focus on Government reform to allow CSO wholesalers to deliver on the National Medicines Policy
Consumer Brands product portfolio investment beginning to realise value
3. Sustained improvements on balance sheet
Ongoing working capital and debt improvements on the pcp
4. Assess prudent scalable acquisitions
Using API’s existing capabilities and balance sheet to provide higher growth, higher return opportunities for
shareholders
2018 HALF YEAR RESULTS PRESENTATION 5
Financial Highlights

                                      1H17       1H18
                                                            MODERATED    PROGRESS IN PREVAILING
Revenue                               $2015.4m   $2009.3m   CONDITIONS

Underlying1 EBITDA                    $62.3m     $58.7m        Challenges in retail environment will
                                                               persist through 2018
Underlying1 NPAT                      $29.1m     $26.8m
                                                               Store network growth to continue with
Underlying1             ROCE           15.23%     15.41%       pipeline strong for CY18

Underlying1 ROE                        10.56%     9.22%        Requirement to address exclusive
                                                               distribution in pharmacy
Underlying1 EPS                         6.0¢       5.4¢
                                                               Financial management focus to
Dividends                               3.5¢       3.5¢        further improved debt and balance
                                                               sheet
1   Refer Appendix 1 for definition

2018 HALF YEAR RESULTS PRESENTATION                                                                    6
FINANCIAL RESULTS
PETER MENDO
CHIEF FINANCIAL OFFICER

2018 HALF YEAR RESULTS PRESENTATION   7

Financial Overview
  Underlying1 NPAT $m                                                                   Underlying1 EBIT $m          Underlying1 CODB2 (% of revenue)

                                                                                                                       10.3%
                                29.1                                                              48.6
     25.3                                               26.8                            44.6                  44.6

                                                                                                                                                9.4%
                                                                                                                                    9.2%

    1H16                       1H17                    1H18                             1H16      1H17        1H18     1H16        1H17         1H18

FOCUS ON FUNDAMENTALS
             Business performance was down on 1H17 as flagged; benefits of continued balance sheet improvements
             assisted net profit result
             Re-engineering business structure will take further costs out over time; investments and underlying costs led
             to a slight increase in CODB
             Further opportunity to refine cost management to combat constrained retail environment
1Refer   to Appendix 1 for definition; 2 Cost of doing business excludes depreciation

         2018 HALF YEAR RESULTS PRESENTATION                                                                                                            8
Financial Management

COST MANAGEMENT    CHANGES
    Underlying adjustments of $2.6m relate to business restructuring and costs for strategic business growth
    (Retail, IT & Finance)
    Overall salaries and wages were down compared to the pcp, with rationalisation of support office
    structures
    IT infrastructure is moving to operating expenses; accounts will reflect a commensurate reduction in
    capex and depreciation
    Significant opportunity for growth in NZ business has been secured with investments in product
    development - pay back within 12-24 months
    Priceline Pharmacy network cost increased as we increased corporate store numbers in well-located
    cluster
    Further cost-out initiatives in place to address constrained retail environment in near term

 2018 HALF YEAR RESULTS PRESENTATION                                                                           9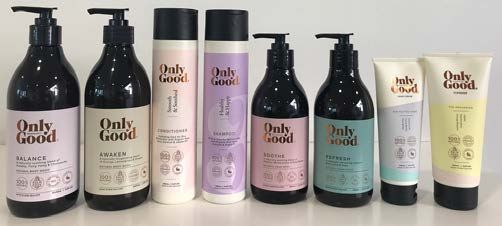
Working Capital

Summary $m              HY17        FY17       HY18        Key Metrics                HY17   FY17   HY18
Trade Receivables         631        682        609        Trade Debtors Days         33.9   40.6   36.0
Inventories               363        399        404        Inventory Days             33.7   37.2   37.7
Trade Payables            653        805        702        Trade Payables Days        40.6   55.8   49.6
Net Working Capital       340        276        311        Cash Conversion Days       26.9   22.1   24.0

  CASH CONVERSION      REMAINS STRONG

         Cash conversion remains the focus and is more than 10% better than the pcp

         Continued trend for cash conversion cycle to be in the low-to-mid 20 days

         Inventory increased on pcp due to increases in PBS volumes and major sales events

         Inventory trend through the year is similar to FY17 level

   2018 HALF YEAR RESULTS PRESENTATION                                                                     10
Cash Flow & Debt
Key Metrics HY17 FY17 HY18 $m HY17 FY17 HY18
Reported net debt $m 57.4 (7.2) 25.1 Cash generated from
21.1 129.8 22.8
Net debt¹/(net debt + operations
9.5% (1.3)% 4.3%
equity)
Net capital expenditure 12.4 27.8 8.0
Net debt²/EBIT 1.2x (0.1)x 0.6x
EBIT/interest 7.6x 6.9x 7.0x Free cash 8.7 102.0 14.8
Debt increase/(dec)
42.4 (18.8) 19.6
REPORTED NET DEBT REDUCES FURTHER ON PCP including leasing
Reported net debt reduced by $32.3m on pcp Dividend (17.1) (34.3) (17.2)
Net debt coverage remains strong on all metrics
Net movement in cash
Cash from operations was in line with 1H17 34.0 48.9 17.1
before interest & tax²
Capex to ramp up in second half
1 Net debt includes annual insurance premium funding and finance leasing liabilities
² As per the Appendix 4D Consolidated Statement of Cash Flows, excluding interest and tax
2018 HALF YEAR RESULTS PRESENTATION 11Capital management
Underlying1 ROCE% Underlying1 ROE% Dividend paid $’m
69%
53%
15.23 15.41 10.56 17.1 17.2
9.54 9.22
12.51
12.2
1H16 1H17 1H18 1H16 1H17 1H18 1H16 1H17 1H18
RETURNS TO SHAREHOLDERS
Underlying ROCE trending up; underlying ROE in line with change in NPAT
Confidence in business performance means dividend in line with last year
Payout ratio has consistently improved year-on-year reflecting sustained performance
1Refer to Appendix 1 for definitions
2018 HALF YEAR RESULTS PRESENTATION 12OPERATIONAL SUMMARY RICHARD VINCENT CEO & MANAGING DIRECTOR 2018 HALF YEAR RESULTS PRESENTATION 13
Retail Results
Retail register sales² $m                  Retail GP $m

                                                          126
                595
                             593             121                     121

   583

  1H16         1H17         1H18             1H16         1H17       1H18

 TOUGH CONDITIONS       SLOW SALES
 Total network retail sales¹ up 2.1%, retail register sales² -0.3%
 Comparable store growth at -1.7%                                               ¹ All network retail sales recorded at register,
                                                                                    stated on a financial period basis including
                                                                                    dispensary
 Network up to 466 stores from 450 in the pcp
                                                                                ²   Retail register sales stated on a financial
 Footfall strong – conversion and basket size focus to tackle price deflation       period basis but excludes dispensary sales.
                                                                                    Retail sales made by franchise stores do not
 Overall market share stable; positive trend in health categories                   form part of API’s financial results.

2018 HALF YEAR RESULTS PRESENTATION                                                                                                14
Customer Priorities
REINVESTMENT IN SALES DRIVING ACTIVITIES
Increased emphasis on key promotional programs while enhancing
margins for franchise and company stores
Key promotional tactics with high customer volumes
extended in duration
More selective product, range and category choices to
deliver improved margin
Marketing tactics to highlight exclusive product and sales
opportunities
LOYALTY PROGRAM LEVERAGE
Sister Club database continues to grow and remains major
source of customers – accounting for more than 50% of sales
Loyalty communications emphasise brand value and sales
opportunities 15
Digital transformation program continues through FY18-19
2018 HALF YEAR RESULTS PRESENTATION 15Retail Market Position
STABLE HEALTH AND BEAUTY SHARE - CATEGORY MAT GROWTH1 %
1.0%
0.1% 0.3% 0.5%
OTC Colour
Haircare Skincare
Health Cosmetics
Merchandise position improving through the period, last quarter
market share steady and product developments continue.
In stock position improved 130 basis points from pcp
New product pipeline strong with key trends covered
New developments to expand range with key brands
through calendar 2018
1 AC Nielsen to 04/03/18
2018 HALF YEAR RESULTS PRESENTATION 16Pharmacy Distribution Results
Distribution Revenue $m Distribution GP $m
1450 109
1446
107
105
1230
Pharmacy Distribution results
1H16 1H17 1H18 1H16 1H17 1H18
FY17 GAINS CONTINUE INTO 1H18
Underlying¹ growth was strong at 9.8%
Independent pharmacy gains made in FY17 have flowed into 1H18
Reinvestment in independent pharmacy and banner brands assisting
with market gains and ongoing growth
¹ Refer Appendix 1 Definitions
2018 HALF YEAR RESULTS PRESENTATION 17Pharmacy Distribution Market
MARKET DYNAMICS
Improved financial results achieved through a
more competitive trading period
Expect ongoing volume growth in future
Efficiency of network to be reassessed and
scoped for future requirements
Exclusive distribution on selected PBS-funded
pharmaceuticals
Constructive dialogue with government
Preparations starting for 2020 funding agreements
Continuing move to services requires further
assistance for pharmacies
2018 HALF YEAR RESULTS PRESENTATION 18Consumer Brands
POSITIVE MOMENTUM WITH CONTRACT GROWTH
Established as one of the most significant OTC health suppliers to
local market
Earnings growth back on track
Investments in product range and developing stronger supply
relationships
Profitable growth in contract manufacturing volumes in place with
capacity allocated for the remainder of 2018
Branded toiletry products (eg Only Good) performing well in NZ
and promising opportunity in major grocery market in Australia
Further growth expected in Consumer Brands as contracted
volumes grow and opportunities for expanded role in supplying
broader markets developed
2018 HALF YEAR RESULTS PRESENTATION 19FY18 Outlook
TRADING CONDITIONS
Current trading conditions expected to persist through FY18
Sales-generating focus for Priceline Pharmacy network;
overall store number growth to continue
Working capital and cash focus with further cost-out
initiatives in 2H18
Scalable acquisitions are achievable
FY18 underlying result expected to be marginally above
FY17, assuming the current trading conditions do not
deteriorate further
2018 HALF YEAR RESULTS PRESENTATION 20Appendix 1 ASIC
ASIC Regulatory Guide 230 Disclosing non-IFRS financial information
In December 2011 ASIC issued Regulatory Guide 230. To comply with this Guide, Australian Pharmaceutical Industries Limited is required to make a
clear statement about the non-IFRS information included in the Profit announcement and Half Year presentation for the period ending 28
February 2018.
In addition to statutory report amounts, the following non-IFRS measures are used by management and the directors as the primary measures of
assessing financial performance of the Group and Individual Segments:
Underlying Earnings before interest tax (EBIT)
Underlying Earnings before interest, tax, depreciation, amortisation (EBITDA)
Free cash
Comparable Store Growth
Underlying Return on capital employed (ROCE)
Underlying Return on Equity (ROE)
Pharmacy Growth
Underlying Pharmacy Revenue Growth
Retail register sales
Cost of Doing Business (CODB)
Underlying Cost of Doing Business (Underlying CODB)
Underlying NPAT
Underlying Earnings per share
The directors consider that these performance measures are appropriate for the purpose of presenting meaningful information on the underlying
drivers of the continuing business.
Many of the measures used are common practice in the industry within which Australian Pharmaceutical Industries Limited operates. The Profit
Announcement and Full Year presentation has not been audited or reviewed in accordance with Australian Auditing Standards.
2018 HALF YEAR RESULTS PRESENTATION 21Appendix 1 Definitions
EBITDA - Result from operating activities before Depreciation and Amortisation
EBIT – Result from operating activities
Underlying EBITDA – EBIT calculated as above without including one-off impairment or other one-off charges
Underlying NPAT – NPAT calculated with the same exceptions as underlying EBIT
Free Cash – Cash generated from operations less capital expenditure. It does not include financing costs and tax paid
Comparable Store Growth - Sales performance compared to last period for stores trading in the retail network greater than one year
Interest Cover – Result from operating activities divided by net financing costs
Net Debt or Net Cash – Borrowings less cash on hand
Underlying Return on Capital Employed (ROCE) – Underlying EBIT/Total Capital Employed
Underlying Return on Equity (ROE) – Underlying NPAT/Equity
Retail network – franchise and company stores in the Priceline/Priceline Pharmacy brand
Retail register sales – Sales recorded at the register of all network stores which excludes dispensary sales. Register sales made by
franchisees do not form part of the result of the consolidated entity
Cost of Doing Business (CODB) – total operating expenses, excluding cost of sales, depreciation and amortisation as a percentage of
total revenue for the period
Underlying Cost of Doing Business (Underlying CODB) – total operating expenses as above, without including one-off impairment or
other one-off charges, as a percentage of total revenues for the period
Underlying Pharmacy Revenue growth – revenue computated on volumes before PBS price changes that occur on 1 April and 1
October each year and it is also excluding Hepatitis C medicines revenue
Underlying Earnings per Share – underlying NPAT/weighted average number of shares on issue during the period
2018 HALF YEAR RESULTS PRESENTATION 22AUSTRALIAN PHARMACEUTICAL INDUSTRIES 2018 HALF YEAR RESULTS PRESENTATION THURSDAY 19 APRIL 2018
You can also read