Common Metrics-PRISM User's Guide - May 2021 - clic-ctsa.org
←
→
Page content transcription
If your browser does not render page correctly, please read the page content below
Common Metrics-PRISM
                         User’s Guide
                                                     May 2021

 The University of Rochester Center for Leading Innovation and Collaboration (CLIC) is the coordinating center for the Clinical and
Translational Science Awards (CTSA) Program, funded by the National Center for Advancing Translational Sciences (NCATS) at the
                                     National Institutes of Health (NIH), Grant U24TR002260.
Contents
Entering Common Metrics Data and Program Summaries into CM-PRISM ........................................... 4
   Purpose ......................................................................................................................................................4
      How to use this document .................................................................................................................................... 4
      Supplemental Materials ........................................................................................................................................ 4
      About CM-PRISM .................................................................................................................................................. 4

CM-PRISM Accounts .......................................................................................................................... 5
      User Access ........................................................................................................................................................... 5
      User Registration .................................................................................................................................................. 5
      Creating a password ............................................................................................................................................. 5
      Accessing the CM-PRISM Database ...................................................................................................................... 7

CM-PRISM Navigation ....................................................................................................................... 8
      Launching CM-PRISM ............................................................................................................................................ 8
      Record Status Dashboard ..................................................................................................................................... 8
      Status Icon Legend ................................................................................................................................................ 9
      Tool Tip Icon ......................................................................................................................................................... 9
      Saving and Exiting Forms ...................................................................................................................................... 9
      Blank Fields and NDR ............................................................................................................................................ 9
      Error Messages ................................................................................................................................................... 10
      Completion Status .............................................................................................................................................. 10
      Viewing Line Graphs ........................................................................................................................................... 10
      Exporting Data .................................................................................................................................................... 11
      Blank Field vs Zero .............................................................................................................................................. 11
      Accessing Previous Year’s Data ........................................................................................................................... 11

Program Summaries ........................................................................................................................ 12
   Program Summary Content .....................................................................................................................12
      Careers in Clinical & Translational Research Program Summary........................................................................ 12
      Informatics Program Summary ........................................................................................................................... 12

Careers in Clinical and Translational Research Metric ....................................................................... 14
   Accessing the Careers in Clinical and Translational Research Metric .....................................................14
   Entering Data for KL2 ...............................................................................................................................15
      KL2 Graduates Currently Engaged ...................................................................................................................... 15

                                                                                                                                                                            2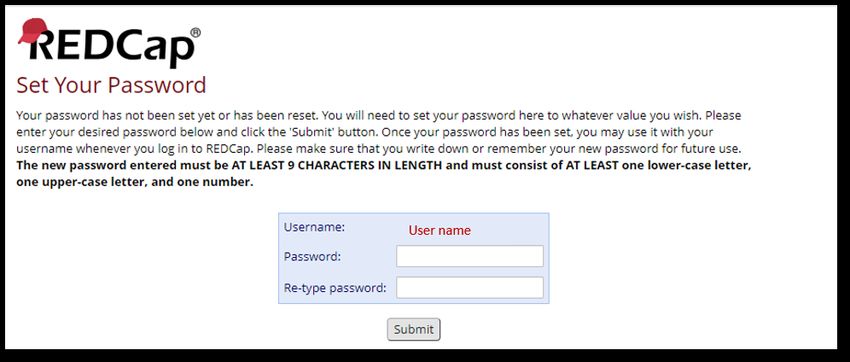
Calculations ......................................................................................................................................................... 15
   Entering the Program Summary for Careers in Clinical and Translational Research – KL2 .....................16
      Entering the Program Summary ......................................................................................................................... 16
   Entering Data for TL1 ...............................................................................................................................17
      Number of TL1 Graduates Currently Engaged .................................................................................................... 17
      Calculations ......................................................................................................................................................... 18
   Entering the Program Summary for Careers in Clinical and Translational Research – TL1 .....................20
      Entering the Program Summary ......................................................................................................................... 20

Informatics Metric ........................................................................................................................... 22
   Accessing the Informatics Metric ............................................................................................................22
      Data Models ........................................................................................................................................................ 22
   Age Domain: ............................................................................................................................................22
   Gender Domain: ......................................................................................................................................22
   Labs - LOINC Domain: ..............................................................................................................................23
   Medications – RxNorm/NDC Domain: .....................................................................................................23
   Diagnosis – ICD9/10 Domain: ..................................................................................................................23
   Diagnosis – SNOMED Domain: ................................................................................................................23
   Procedures – ICD 9/10 PCS Domain: .......................................................................................................23
   Procedures – HCPCS or CPT Domain: ......................................................................................................23
   Procedures – SNOMED Domain:..............................................................................................................23
   Free Text Data Domain: ...........................................................................................................................23
   Observations Domain: .............................................................................................................................23
   Behavioral and/or Social Determinants of Health Domain: ....................................................................23
   Entering Informatics Data ........................................................................................................................24
      Data Upload Feature ........................................................................................................................................... 24
      Calculations ......................................................................................................................................................... 25
      Manually Entering Data ...................................................................................................................................... 25
      Calculations ......................................................................................................................................................... 25
   Entering the Program Summary for Informatics .....................................................................................25
      Entering the Program Summary – last 12 months .............................................................................................. 25
      Entering the Program Summary – next 12 months ............................................................................................ 26

Resources ....................................................................................................................................... 28

                                                                                                                                                                            3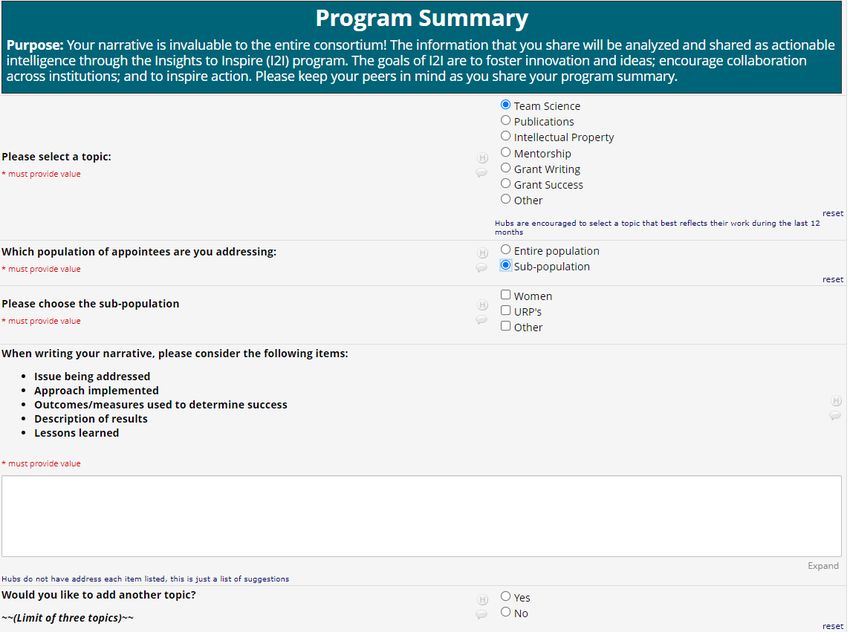
Entering Common Metrics Data and Program Summaries into CM-PRISM
Purpose
This document includes the steps and examples to assist hubs as they enter their numerical data
and Program Summaries into CM-PRISM. The goal is to increase the consistency and comparability
of hub data to enhance the quantitative and qualitative analysis in the annual report.
Hubs upload their data annually – reported data is from January 1st through December 31st of the
previous calendar year. CLIC conducts analyses on both the quantitative and qualitative data. The
quantitative data is used to create a de-identified, aggregated data report for NCATS. It is also
used to create individual hub-specific Multi-Year Reports. Qualitative analysis is conducted on the
Program Summary sections. The summaries include information that are metric specific – the
summary for the Informatics metric differs from that of the Careers in Clinical & Translational
Research metric.
The narratives for each metric are analyzed and shared with the consortium as part of the Insights
to Inspire (I2I) program. For more information regarding I2I, visit the CLIC website: https://clic-
ctsa.org/common-metrics-initiative/i2i.
How to use this document
This document is designed to provide detailed step-by-step guidance, screen shots and examples
for entering numerical data and Program Summaries in CM-PRISM.
Supplemental Materials
Supplemental materials are available to assist hubs in the reporting of the Common Metrics. A list
of these materials is shown below. Links for all of these tools are available on the CLIC website.
   ♦ Common Metrics Operational Guidelines
   ♦ Common Metrics CM-PRISM User’s Guide
   ♦ Careers in Clinical & Translational Research Program Summary Guide
   ♦ Informatics Program Summary Guide
   ♦ Careers Data Collection Template
   ♦ Common Metrics Numeric and Program Summary Checklist
About CM-PRISM
CM-PRISM was developed specifically for the CTSA Program hubs to enter their data and Program
Summaries. REDCap forms are the foundation for the CM-PRISM database. Fields are included for
all data values and all of the components of the Program Summaries. The REDCap platform is
familiar to many hubs and was chosen based on its flexibility regarding the number of users and
ease of reporting new metrics.

                                                                                                4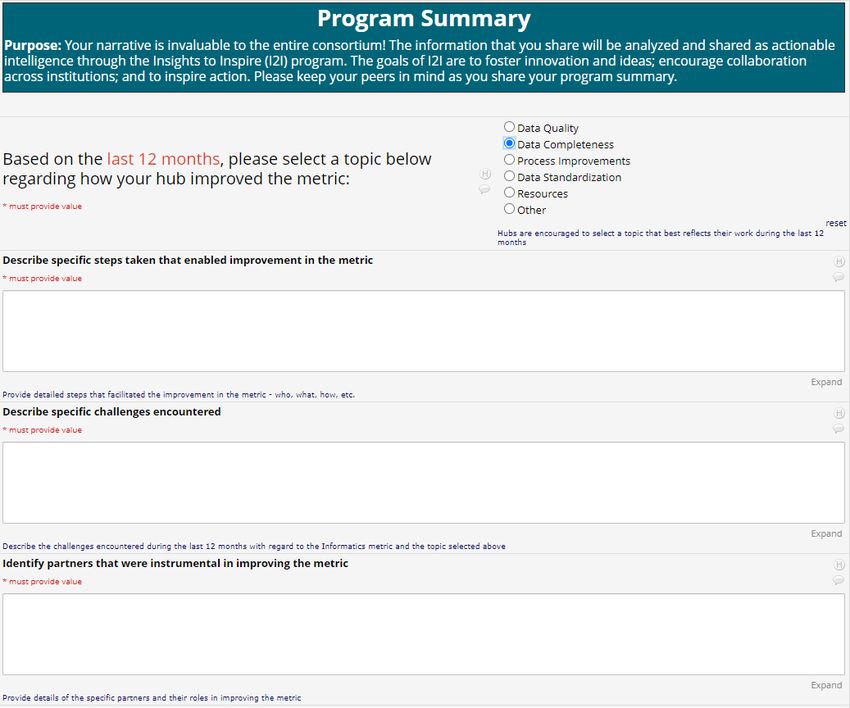
CM-PRISM Accounts
User Access
Two types of users can access CM-PRISM:
   Editor – individual who can enter, edit and view the data.
   Viewer – individual who can only view the data.
User Registration
Only registered users can access CM-PRISM. To register for a CM-PRISM account, complete the
form on the website. You will need to enter the following information:
   ♦ First Name
   ♦ Last Name
   ♦ Email – a first-time log in password will be sent to a new user at this email address.
   ♦ Type of User – Editor or Viewer
   ♦ Metrics – Careers, Informatics or Both (which metric the user will be able to access)
CLIC creates new user accounts based on the information provided in the registration form.
Creating a password
   1. When a CM-PRISM account is created, the user receives an email from REDCap with a
       username.
   2. Click Set your new REDCap password.

   3. Enter the desired password in the Password: text box.
   4. Enter the same password in the Re-type password: text box.
   5. Click Submit.

                                                                                              5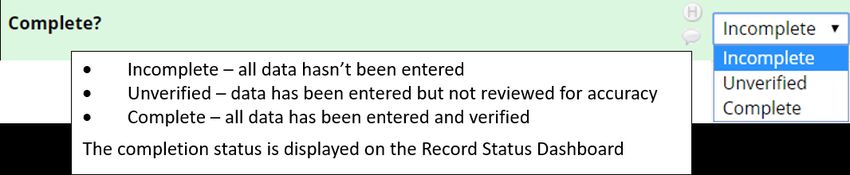
6. The Set Up Password Recovery Question dialog box displays.

7. Click the down arrow beside Select a question and click on the desired question.

                                                                                      6
8. Click in the Provide answer to question text box and enter the response to the question
that was chosen.
9. Review the information in the Please confirm your email address text box. If it is not
correct, please edit appropriately.
10. Click Save.
11. The Set Up Password Recovery Question message displays.
12. Click Close.
Accessing the CM-PRISM Database
1. When a user has been assigned to a project, the user will receive an email from REDCap
with the database link.
2. Click the link to access the project: https://clicredcap.urmc.rochester.edu/index.php
7CM-PRISM Navigation
Launching CM-PRISM
Launch the reporting software platform using https://clicredcap.urmc.rochester.edu/index.php to
open the Introduction page.
Record Status Dashboard
The Record Status Dashboard in REDCap includes the Careers Metric data since 2012 and the
Informatics data since 2019. Data for the previous year is reported in the current year.
To access a common metrics form, scroll to the appropriate year, and the click the status
icon below the desired metric – TL1 Careers, KL2 Careers or Informatics. The form that is
displayed includes all of the fields that need to be completed for the selected metric.
8Data for 2012-2019 was imported from Clear Impact’s Scorecard software.
Status Icon Legend
Record is complete
Record is unverified
Record is incomplete
Record is blank or no data saved
Tool Tip Icon
Click this icon to receive assistance for a specific field.
Saving and Exiting Forms
Users have a variety of options to save and close a form.
Data entered is not saved – user is returned to the Dashboard
Data is saved – user is returned to the Dashboard
Save & Stay Data entered is saved – user stays on the current form
Save & Go To Next Form Data entered is saved – user is taken to the next form
Save & Exit Record Data entered is saved – user is returned to the Dashboard
Save & Go To Next Record Data entered is saved – user is sent to the next record
Blank Fields and NDR
Fields should be left blank if hubs do not collect data for a particular measure. Blank fields will be
reported as No Data Reported (NDR) in the multi-year report.
Zeros should be placed in data fields if the data collected for a particular measure is 0 (zero).
Zeroes will be used in trend analysis calculations.
9Error Messages
Some fields in the forms require a value/text. If these fields are not complete when a user exits a
form a message box will display listing what values are missing. Users need to click on one of the
three buttons at the bottom of the message box.
Completion Status
Users set the completion status for each form. This field is at the bottom of each form
Viewing Line Graphs
Line graphs can be viewed for each measure. After the data has been entered, save and stay on
the form, then click the View Chart button. The line graph is displayed in a separate browser
window. The graph can be copied or saved using the browser’s functionality.
You must save the data before clicking the View Chart button or the graph will not display.
10Exporting Data
Data can be exported to a variety of file formats. On the left side of the main menu, click on Data
Exports, Reports, and Stats to display the My Report & Exports window.
REDCap data can be exported into the following formats:
♦ CSV/Microsoft Excel both raw data and with labels
♦ SPSS Statistical Software
♦ SAS Statistical Software
♦ R Statistical Software
♦ Stata Statistical Software
♦ CDISC ODM (XML)
Blank Field vs Zero
Data fields that are left blank will be reported as No Data Reported (NDR) in the Multi-Year Report.
Data fields that include zeroes will be included in the calculations for trend analysis.
Accessing Previous Year’s Data
Data is submitted each year at the end of August. In September, the database is locked down so
that values cannot be changed. If you need to update your data, please contact:
common_metrics@clic-ctsa.org.
11Program Summaries
The Program Summary includes information pertaining to the topics and strategies that hubs
implemented in the past year that impacted the metric. This information is analyzed by CLIC and is
shared as actionable intelligence through the Insights to Inspire (I2I) program. The goals of I2I are
to foster innovation and ideas; encourage collaboration across institutions; and to inspire action.
The requirements for the Program Summaries vary by metric.
Program Summary Content
The Program Summaries are not intended to be burdensome. The goal is to include information
that can be used to improve the metric across the consortium. The lessons learned by individual
hubs can help others to address the challenges that they face in improving the metrics.
Careers in Clinical & Translational Research Program Summary
Hubs are only required to enter one Program Summary for the Careers Metric. For hubs that have
both KL2 and TL1 awards – hubs will need to determine whether to write a Program Summary for
the KL or TL award. Hubs may choose to write a Program Summary for each award.
The Careers in Clinical & Translational Research Program Summary includes the following
components:
♦ Topic – choose the topic that best reflects the work of the last calendar year.
♦ Population – select the population addressed during the previous year’s work.
♦ Narrative – include information that describes the work performed during the previous
year.
♦ Hubs may include as many as three different topics in the Program Summary section.
Note: There is no word count limit for the narrative text.
Informatics Program Summary
Hubs are only required to enter one Program Summary.
The Informatics Program Summary includes the following components:
Last 12 Months:
♦ Topic – choose the topic that best reflects the work of the last 12 months.
♦ Steps taken – list specific steps that led to improvement in the metric.
♦ Challenges – describe the specific challenges faced in improving the metric.
♦ Partners – provide details regarding individuals that were instrumental in improving the
metric.
12Next 12 Months:
♦ Topic – choose the topic that indicates what will be addressed in the next 12 months.
♦ Steps that will be taken – list specific steps that will be taken to improve the metric.
♦ Challenges – describe the anticipated challenges for improving the metric.
♦ Partners - provide details regarding the partners that will be instrumental in improving the
metric.
♦ Hubs may include as many as three different topics in the Program Summary section.
Note: There is a 200 word count limit for the narrative text.
13Careers in Clinical and Translational Research Metric
Accessing the Careers in Clinical and Translational Research Metric
The Careers in Clinical and Translational Research metric collects data on two
educational programs:
♦ KL2: This award supports mentored research career development for clinical investigators
who have recently completed professional training and who are commencing basic,
translational and/or clinical research.
♦ TL1: This award supports students seeking a practical introduction to clinical and
translational research by providing full-time research training support for pre-doctoral
candidates and combined health-professional doctorate-master’s candidates as well as
postdoctoral fellows seeking additional training in clinical research
Refer to the Operational Guideline to ensure accurate reporting for the metric. Hubs that receive
both KL2 and TL1 funding are required to enter numerical data for both programs. If hubs are
funded for both metrics (KL2 and TL1) they are only required to enter a Program Summary for one
of the metrics. It is at the hub’s discretion to determine whether they will enter IPs for the KL2 or
TL1 metric.
1. Open REDCap: https://clicredcap.urmc.rochester.edu/index.php
2. Enter the Username and Password
3. Click the Log In button
4. From the menu on the left, click on Record Status Dashboard
5. The Record Status Dashboard in REDCap includes the Careers Metric data since 2012 and
the Informatics data since 2019.
Please Note: Data for the previous year is reported in the current year. For example, hubs report
2020 data during calendar year 2021.
14Entering Data for KL2
KL2 Graduates Currently Engaged
1. From the Record Status Dashboard, scroll to the desired year. (Data for 2012-2019 was
imported from Clear Impact’s Scorecard software.)
2. Click the status icon for the Careers in Clinical and Translational Research KL2 for
the desired year to display the form.
3. Under Denominator, enter the denominator for the total number of KL2 scholars.
4. Press [Tab] or click in the text box for URP + Engaged and Male.
5. Under KL2, enter the values for URP + Engaged Males, Females and Others.
6. Press [Tab] or click in the appropriate text box.
7. Enter the remaining values for each category.
Calculations
CM-PRISM automatically calculates the percentages based on the data entered.
15To view the line graph, save the form and then click the View Chart button.
Entering the Program Summary for Careers in Clinical and Translational Research – KL2
Note: Hubs are only required to enter one Program Summary for the Careers Metric. For hubs that
have both KL2 and TL1 awards – hubs will need to determine whether to write a Program
Summary for the KL or TL award. Hubs may choose to write a Program Summary for each award.
♦ Hubs may include as many as three different topics in the Program Summary section.
Note: There is no word count limit for the narrative text.
Entering the Program Summary
1. Scroll to the bottom of the form.
2. Under the Program Summary heading, select the topic that best reflects the work of the
prior calendar year.
3. Select the population that was addressed on the topic selected above (entire population or
sub-population.
If selecting sub-population, select all that apply – Women, URP, and/or Other.
If selecting Other – please specify the population.
4. Click in the narrative text box and enter the information that describes the work performed
during the previous year. Note: There is no word count limit for the narrative text.
166. To add another topic, click Yes to display another topic and narrative section.
7. Select the appropriate save option.
8. Address any error messages.
9. Select the appropriate completion status.
Entering Data for TL1
Number of TL1 Graduates Currently Engaged
1. From the Record Status Dashboard, scroll to the desired year. (Data for 2012-2019 was
imported from Clear Impact’s Scorecard software.)
2. Click the status icon for the Careers in Clinical and Translational Research TL1 for
the desired year to display the form.
171. Under Denominator, enter the denominator for the total number of TL1 trainees.
2. Press [Tab] or click in the text box for URP + Engaged and Male.
3. Under TL1 Pre-docs, enter the values for URP + Engaged Males, Females and Others.
4. Press [Tab] or click in the appropriate text box.
5. Enter the remaining values for TL1 Pre-docs for each category.
6. Under TL1 Post-docs, enter the values for URP + Engaged Males, Females and Others.
7. Press [Tab] or click in the appropriate text box.
8. Enter the remaining values for TL1 Post-docs for each category.
Calculations
CM-PRISM automatically calculates the percentages based on the data entered.
18To view the line graph, save the form and then click the View Chart button.
The Summary section combines the values for all TL1 trainees (pre-docs and post-docs).
19Entering the Program Summary for Careers in Clinical and Translational Research – TL1
Entering the Program Summary
1. Scroll to the bottom of the form.
2. Under the Program Summary heading, select the topic that best reflects the work of the
prior calendar year.
3. Select the population that was addressed on the topic selected above (entire population or
sub-population.
If selecting sub-population, select all that apply – Women, URP, and/or Other.
If selecting Other – please specify the population.
4. Click in the narrative text box and enter the information that describes the work performed
during the previous year. Note: There is no word count limit for the narrative text.
5. To add another topic, click Yes to display another topic and narrative section.
206. Select the appropriate save option.
7. Address any error messages.
8. Select the appropriate completion status.
21Informatics Metric
Accessing the Informatics Metric
The Informatics Metric collects data on twelve data domains and requires only
one Program Summary. Specific details regarding what data is required are listed
in the Operational Guideline [link]. Hubs are encouraged to work with their in-
house Informatics team to collect the required data.
Data Models
Four data models have been approved for the Informatics metric:
♦ PCORNet
♦ OMOP
♦ i2b2/ACT
♦ TriNetX
Scripts are available for hubs using PCORNet, OMOP, or i2b2/ACT data models. The scripts create
the output file for the metric data and are available on GitHub. The output file that can be
automatically uploaded to CM-PRISM. Hubs that use TriNetX should send an email to
ctsa@trinetx.com to request a report. This report can also be automatically uploaded into CM-
PRISM.
Note: If a hub does not use one of the approved data models, the data will need to be manually
entered into CM-PRISM.
Informatics data for 2020 inclues three denominators:
♦ Total unique patients in the data warehouse
♦ Total unique encounters in the data warehouse
♦ Total unique patients > age 12 in the data warehouse
Calculations for the percentage values are automatically calculated.
Note: There are 12 data domains for the Informatics Metric. Data values need to be uploaded or
entered for each of the domains and their associated measures:
Age Domain:
A1 – Unique patients with an age or date of birth value
A2 – Unique patients with an age < 0
A3 – unique patients with one or more ages >120 years
Gender Domain:
B1 – Unique patients with an asserted (administrative) gender value
22Labs - LOINC Domain:
C1 – Unique patients with a lab test coded in LOINC
C2 – Unique encounters with at least one lab test coded in LOINC
Medications – RxNorm/NDC Domain:
D1 – Unique patients with a medication coded in RxNorm/NDC
D2 – Unique encounters with at least one medication coded in RxNorm/NDC
Diagnosis – ICD9/10 Domain:
E1 – Unique patients with a diagnosis coded in ICD 9/10
E2 – Unique encounters with at least one diagnosis coded in ICD 9/10
Diagnosis – SNOMED Domain:
F1 – Unique patients with a diagnosis coded in SNOMED
F2 – Unique encounters with at least one diagnosis coded in SNOMED
Procedures – ICD 9/10 PCS Domain:
G1 – Unique patients with a procedure coded in ICD 9/10 PCS
G2 – Unique encounters with at least one procedure coded in ICD 9/10 PCS
Procedures – HCPCS or CPT Domain:
H1 – Unique patients with a procedure coded in HCPCS or CPT
H2 – Unique encounters with at least one procedure coded in HCPCS or CPT
Procedures – SNOMED Domain:
I1 – Unique patients with a procedure coded in SNOMED
I2 – Unique encounters with at least one procedure coded in SNOMED
Free Text Data Domain:
J1 – Unique patients with a free text note and/or report in the data warehouse
J2 – Unique encounters with at least one free text note and/or report in the data
warehouse
J3 – Does your hub have NLP solutions (Yes/No)
Observations Domain:
K1 – Unique encounters with at least one vital sign coded (height, weight, BP, BMI or temp)
Behavioral and/or Social Determinants of Health Domain:
L1 – Unique patients with a smoking status coded at least once
L2 – Unique patients with opioid use disorder coded
L3 – Unique patients with an insurance provider
L4 – Unique patients with an insurance status (Private, Medicare, Medicaid, TriCare/VA, or
Uninsured)
23Entering Informatics Data
1. Open REDCap: : https://clicredcap.urmc.rochester.edu/index.php
2. Enter the Username and Password
3. Click the Log In button
4. From the menu on the left, click on Record Status Dashboard
5. The Record Status Dashboard displays the Informatics data since 2019.
Note: Data for the previous year is reported in the current year. For example, 2020 data is
entered during the 2021 calendar year.
6. From the Record Status Dashboard, scroll to the desired year.
7. Click the status icon for the Informatics Metric for the desired year to display the form.
Data Upload Feature
1. If your hubs uses one of the approve data models, click Yes.
2. If you want to use the upload feature, click Yes.
3. If your hub ran one of the scripts from the GitHub site or had TriNetX run your report, click
Yes.
244. If your data output is available in CSV file format, click Yes.
5. If you have direct access to the CSV file, click Yes.
6. Click the Choose File button to display an Open window.
7. Select the CSV file and click Open.
8. Click the Upload button. This following message displays
9. Click OK
10. Select the appropriate save option.
11. Address any error messages.
12. Select the appropriate completion status.
Note: Fields that are left blank will be reported as No Data Reported (NDR) in the multi-year
report. Zeros will be used in trend analysis calculations.
To view the line graph, save the form and then click the View Chart button.
Calculations
CM-PRISM automatically calculates the percentages based on the data entered.
Manually Entering Data
1. For hubs that are not able to upload data, all of the data values will need to be entered
manually. Press [Tab] or click in the appropriate fields and then enter the value.
2. Select the appropriate save option.
3. Address any error messages.
4. Select the appropriate completion status.
Calculations
CM-PRISM automatically calculates the percentages based on the data entered.
Entering the Program Summary for Informatics
Entering the Program Summary – last 12 months
1. Scroll to the bottom of the form.
2. Under the Program Summary heading, select the topic that best reflects the work
completed during the previous year.
253. Click in the text box below Describe specific steps taken that enabled improvement in the
metric – enter your hub’s narrative – there is a 200 word count limit.
4. Click in the text box below Describe specific challenges encountered – enter your hub’s
narrative – there is a 200 word count limit.
5. Click in the text box below Identify partners that were instrumental in improving the
metric – enter you hub’s partners – there is a 200 word count limit.
Entering the Program Summary – next 12 months
1. Click in the text box below Describe specific steps that will be taken to improve the metric
– enter your hub’s narrative – there is a 200 word count limit.
2. Click in the text box below Describe anticipated challenges– enter your hub’s narrative –
there is a 200 word count limit.
263. Click in the text box below Identify partners that will be instrumental in improving the
metric – enter you hub’s partners – there is a 200 word count limit.
4. To add another topic, click Yes to display another topic and narrative section.
5. Select the appropriate save option.
6. Address any error messages.
7. Select the appropriate completion status.
27Resources
Below is a list of resources available to all hubs for the Common Metrics Initiative. For questions
regarding Common Metrics, please email: common_metrics@clic-ctsa.org
Resources Available through the CLIC Common Metrics Initiative Webpage:
♦ Common Metrics Website link
♦ All Common Metrics link
♦ Common Metrics Reporting Page link
28You can also read