AUSTRALIAN PHARMACEUTICAL INDUSTRIES LIMITED - 2016 FULL YEAR RESULTS PRESENTATION THURSDAY 20 OCTOBER 2016
←
→
Page content transcription
If your browser does not render page correctly, please read the page content below
AUSTRALIAN PHARMACEUTICAL INDUSTRIES LIMITED
2016 FULL YEAR RESULTS PRESENTATION
THURSDAY 20 OCTOBER 2016
HALF YEAR RESULTS 2016
Important Notice

The material in this presentation is of general information about API’s
activities current at the date of the presentation. It is information given
in summary form and does not purport to be complete. Nothing in this
presentation should be construed as a recommendation or forecast by
API or an offer to sell or a solicitation to buy or sell shares. It does not
take into account the investment objectives, financial situation or
needs of a particular investor. These should be considered with or
without professional advice when deciding if an investment is
appropriate.

This presentation contains certain non‐IFRS measures that API believes
are relevant and appropriate for the understanding of the business.
Refer to Appendix 1 for further information.

                                                                                             2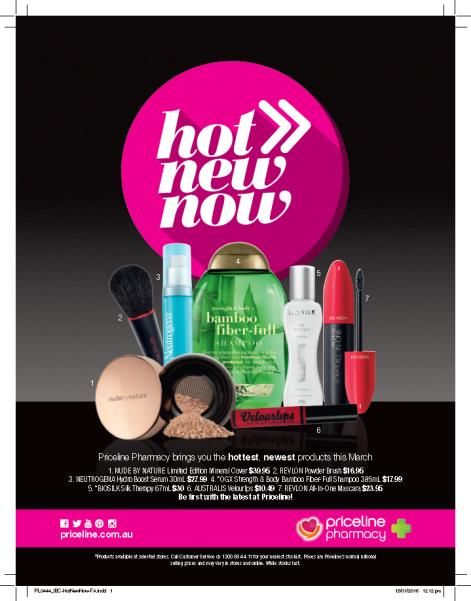
GROUP PERFORMANCE & STRATEGIC PRIORITIES
STEPHEN ROCHE
CEO & MANAGING DIRECTOR
FULL YEAR RESULTS 2016
GROUP PERFORMANCE
       REPORTED
       NPAT $51.7m                                      STRATEGY DELIVERING
                               19.8%
                                                         SUSTAINED SUCCESS
       UNDERLYING*
       NPAT $51.4m
                              18.0%                        GROWTH CONTINUES FROM CORE
                                                                    ASSETS

       REPORTED                                                  OPERATIONAL EXECUTION
       EBITDA $113.6m                                                 MAINTAINED
                               20.3%

                                                            CEO SUCCESSION IMPLEMENTED
      REPORTED
      EBIT $87.1m
                17.7%

*Refer to Appendix 1 and 2 for definitions and reconciliations                                         4
FULL YEAR RESULTS 2016
GROUP PERFORMANCE
       BASIC EPS
       10.6¢                                            STRATEGY DELIVERING
                             20.5%
                                                         SUSTAINED SUCCESS
      FINAL
      DIVIDEND
      3.5¢     40.0%                                               FINANCIAL STRENGTH
                                                                 DEMONSTRATED IN CAPITAL
                                                                        RETURNS
      UNDERLYING*
      ROCE 15.5%                                             STRONG POSITION FOR FUTURE
                           204 bp                             DEVELOPMENT & LEVERAGE

      UNDERLYING*
      ROE 9.6%
                              96 bp

*Refer to Appendix 1 and 2 for definitions and reconciliations                                           5
GROUP FINANCIALS
PETER MENDO
CHIEF FINANCIAL OFFICER
FULL YEAR RESULTS 2016
FINANCIAL OVERVIEW Underlying NPAT CAGR – 27.3%
EBIT CAGR – 15.7%
87.1
90 74.0
STRONG PROFIT AND $m 80 65.1
70
BALANCE SHEET POSITION 60 43.6
51.4
50 31.7
Disciplined operational management 40
30
Working capital brought back to 20
expected levels 10
0
Reported debt at record lows FY14 FY15 FY16
Sustainable shareholder returns with Underlying NPAT * EBIT#
focus on capital metrics
CAGR – 27.7% 10.6
12
OPERATING COSTS CONTROLLED
8.8
10
6.5
Overall costs have been held in line 8
with last year & inflation 6
4
SAP benefits continue to drive
2
efficiencies, particularly in supply
0
chain cost management FY14 FY15 FY16
Basic earnings per share (EPS) (cents)
*Refer Appendix 1 and 2 for definitions and reconciliations
#EBIT for FY14 & FY15 as per Appendices 1 &2 in FY15 ASX investor presentation 7
FULL YEAR RESULTS 2016
WORKING CAPITAL
A$m FY16 1H16 FY15
Trade & other receivables 689 533 592
Inventories 414 383 364
Trade & other payables 799 528 666
Net Working Capital 304 388 290
Trade debtors days 39.5 34.6 39.9
Inventories days 41.0 40.9 40.2
Trade payables days 56.6 38.0 54.1
Cash Conversion Cycle 23.9 37.4 26.1
Following SAP implementation the seasonal period working
capital has returned to expected levels
Cash conversion cycle further improved from FY15
8
FULL YEAR RESULTS 2016
CASHFLOW
A$m FY16 FY15
Cash generated from trading operations 96.6 101.8
Net capital expenditure (13.0) (29.9)
Free cash 83.6 71.9
Debt increase/(reduction) (48.4) (26.2)
Dividend (24.4) (19.5)
Net movement in cash 10.8 26.2
Cash generation from operations comparable to FY15
2H16 focus on using cash to pay down debt
9
FULL YEAR RESULTS 2016
DEBT METRICS
117.4
99.3
120.0
100.0
STRONG BALANCE SHEET
70.8
80.0 Favourable refinancing of
corporate debt facility in FY16
60.0
25.9 Debt metrics and interest cover
40.0 all improved from FY15
20.0
0.0
FY13 FY14 FY15 FY16
Reported net debt - $m
A$m FY16 1H16 FY15
Net Debt#/(Net Debt + Equity) 4.6% 21.0% 12.2%
Net Debt#/Underlying* EBIT 0.3x 1.8x 1.0x
Underlying* EBIT/Interest 5.5x 5.4x 5.2x
# Net debt includes annual insurance premium funding and finance lease liabilities
*Refer Appendix 1 and 2 for definitions and reconciliations. EBIT for FY14 & FY15 as per Appendices 1 &2 in FY15 ASX investor 10
presentationFULL YEAR RESULTS 2016
CAPITAL METRICS
RETURNS LEVERAGING SCALE
Returns reflect reaching critical scale and focus
on maximising asset strength
CAGR – 22.9% 15.49 CAGR – 32.8% 9.58
13.45 8.62
16 10
11.93
14 9
6.57
8
12
8.34
7
10
6 4.09
8 5
6 4
3
4
2
2
1
0 0
FY13 FY14 FY15 FY16 FY13 FY14 FY15 FY16
Underlying ROCE* % Underlying ROE* %
* Refer Appendix 1 for definitions 11FULL YEAR RESULTS 2016
CAPITAL MANAGEMENT SUMMARY
Working • Normalised in-line with forecast as expected
Capital • Managed high-cost Hep C introduction
• Capex spend of $20.7m for FY16
Capex • Primarily stay-in-business capex of $17m for FY17,
additional capex to meet IRR hurdles
• Debt will continue to be paid down in FY17 and,
Debt subject to capital management plans, expect to be
cash positive within the next 12 months
Dividends • Base payout ratio to move towards 60% in FY17
12OPERATIONAL SUMMARY STEPHEN ROCHE CEO & MANAGING DIRECTOR
FULL YEAR RESULTS 2016
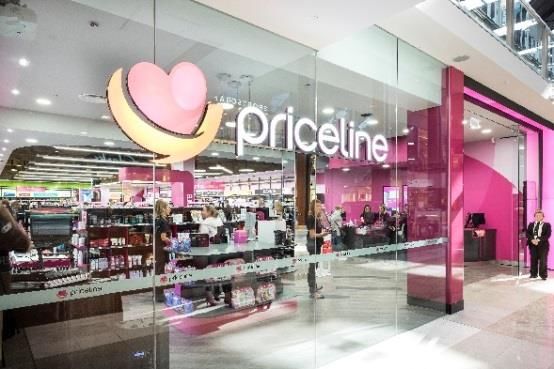
RETAIL GROWTH PROFILE
1147 237
1049 218
1200 950 250 197
871 185
1000 200
800
150
600
100
400
50
200
0 -
FY13 FY14 FY15 FY16 FY13 FY14 FY15 FY16
Retail register sales* - $m Gross profit - $m
KEY INDICATORS
Total retail network sales up 11.7%#
Retail network sales up 7.6%*
Comparable store retail sales +2.8%*
Dispensary LFL volume growth +4.4%1
GP $ margin growth +8.7%
442 stores at 31 August 2016
# Retail network sales and all dispensary sales
*Retail network sales at register but excludes dispensary sales. Retail sales made by
franchise stores do not form part of the financial results of the consolidated entity.
recorded at register
1 Dispensary volumes adjusted for delisted
14
Refer to the 2016 Appendix 4E lodged with the ASX for recorded segment revenue
products from PBSFULL YEAR RESULTS 2016
KEY DRIVERS
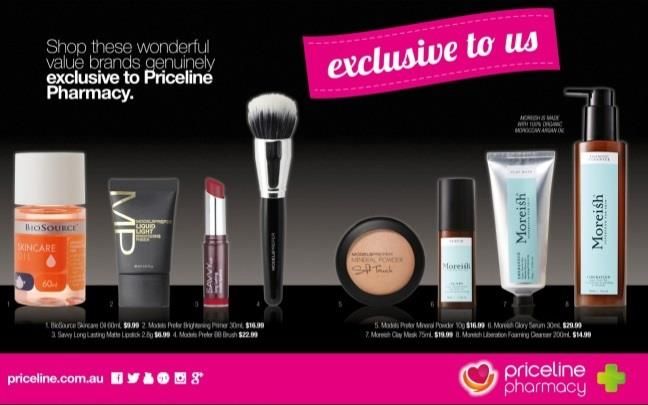
#1 health • Further build position in beauty
& beauty • Continue taking market share in health
position • Destination for new and exclusive
Maximise • Continuing to build brand recognition
brand • New brand campaign launched
reach • Broadening presence with women
Build • Deepen unique customer service proposition
customer • Build loyalty program and value
loyalty • Deliver innovative store experiences
National • Maintain at least 20 stores/year growth
network • Only 5% of total footprint taken
expansion • Grow franchise partner advocacy
15FULL YEAR RESULTS 2016
HIGH GROWTH CATEGORIES
Key to core business:
• Unrivalled range and choice
• First to market
• Exclusive product launches
• Disruptive tactics
Core Categories Growth
Colour cosmetics 12.9%
Skincare 13.5%
Medicinal health 14.2%
Vitamins 7.1%
# Nielsen data to 29 July 2016 – MAT market share pharmacy & grocery.
16FULL YEAR RESULTS 2016
BUILDING BRAND ASSETS
SISTER CLUB
6.4 million total members
2.9 million email addresses
Represent 46% total sales and spend 46% more than non-members
CATALOGUES & MEDIA
Over 7 million/month reaching 4 million women
Dedicated national TV campaigns reaching 89% of women 18+
SPONSORSHIPS
Taking a primary position in women’s sports – netball, AFL
Leveraging sponsorships across all assets
SOCIAL MEDIA
Facebook 248k; Instagram 217k
More than 1 million views/month and broadening engagement
ONLINE
Monthly visits 1.9 million targeted at ready-to-buy audience
Average monthly page impressions 12.4 million
MAJOR CAMPAIGNS
Own major health and beauty media campaigns including; Festival
of beauty, Beauty School, Health Tracker, Biggest Blood Pressure
Check, Virgin Australia Melbourne Fashion Festival
AMBASSADORS
Align iconic talent across health and beauty
Maximises each major campaign 17FULL YEAR RESULTS 2016
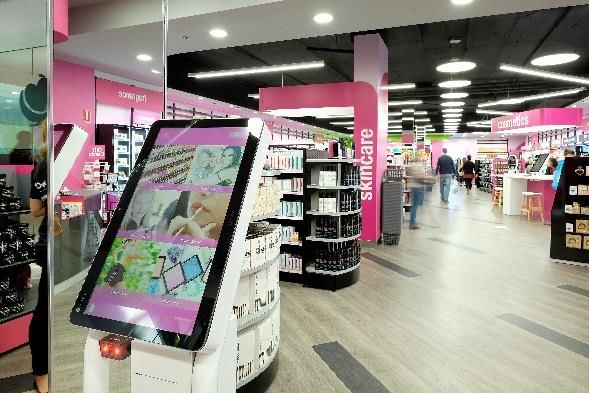
NEXT GENERATION STORE LAUNCHED
Next Generation store delivers for
franchise partners
• Costs held constant with prior format
• More efficient use of stock
• Accentuates difference in the market
Next Generation store delivers for our
customers
• Dedicated “playground” areas
• Improved lighting, directional flow
and signage
• Broader aisles and easier access
18FULL YEAR RESULTS 2016
PHARMACY DISTRIBUTION STEADY
2,754
217
2,800 220 214
213
2,700 215
2,600 2,488 210
2,476
2,500 2,395 200
205
2,400 200
2,300 195
2,200 190
FY13 FY14 FY15 FY16 FY13 FY14 FY15 FY16
Revenue - $m Gross profit $m
KEY INDICATORS
Top line growth due to new Hep C medications –
added $289m in revenue
Underlying Pharmacy Distribution revenue
growth* of 4.8%
GP $ margin growth of 1.9%
Independent pharmacy offer remains strong
*Refer Appendix 1 for definition 19FULL YEAR RESULTS 2016
STRONG INDEPENDENT OFFER
INTEGRATED BUSINESS DRIVING VALUE
Club Premium maintained as one of the most
popular independent offerings in the market with
more than 770 customers
Supporting broadening of service-based
community pharmacy model through active
development of Soul Pattinson and Pharmacist
Advice models
KEY INDUSTRY ISSUES
API submitted as part of the NPSA to the Review
of Pharmacy Remuneration and Regulation
Review to have final report in 2017
20FULL YEAR RESULTS 2016
NEW ZEALAND SUMMARY
BUILDING A STRONGER
PORTFOLIO
Improvements continue year-on-year
following restructure in prior years
Capitalising on naturals and place of
manufacture
Contract manufacturing to Australian
retailers maintained
Sustaining local position as key supplier in
domestic New Zealand market
21FULL YEAR RESULTS 2016
OUTLOOK
MANAGEMENT FOCUS
Strategic plan ongoing; substantial scope to further build
Priceline Pharmacy network while Pharmacy Distribution will
continue its long term sustainability to generate a return on
assets
FY17 OUTLOOK POSITIVE
API’s organic growth to continue
Expect to have 462 stores in retail network at the end of FY17
Further improvement in capital metrics and shareholder returns
Balance sheet strength and debt position to provide flexibility
* Outlook is subject to:
no material change in consumer or customer demand
a stable economic climate
no unforeseen adjustments to the regulatory environment or reforms to the Pharmaceutical
Benefits Scheme 22AUSTRALIAN PHARMACEUTICAL INDUSTRIES LIMITED THANK YOU
FULL YEAR RESULTS 2016
Appendix 1
ASIC Regulatory Guide 230 Disclosing non-IFRS financial information
In December 2011 ASIC issued Regulatory Guide 230. To comply with this Guide, Australian Pharmaceutical Industries
Limited is required to make a clear statement about the non-IFRS information included in the Profit announcement and Full
Year presentation for the period ending 31 August 2016.
In addition to statutory report amounts, the following non-IFRS measures are used by management and the directors as the
primary measures of assessing financial performance of the Group and Individual Segments:

Non-IFRS measures used in describing the Business Performance include:
     •   Earnings before interest tax (EBIT)
     •   Earnings before interest, tax, depreciation, amortisation (EBITDA)
     •   Free cash
     •   Comparable Store Growth
     •   Interest cover
     •   Return on capital employed (ROCE)
     •   Return on Equity
     •   Underlying Pharmacy Growth
     •   Retail register sales

In addition to the above the following non-IFRS measures are used by management and the directors to assess the
underlying performance of the Group during the period.
      •   Underlying NPAT
      •   Underlying EBIT
The directors consider that these performance measures are appropriate for their purposes and present meaningful
information on the underlying drivers of the continuing business.
Many of the measures used are common practice in the industry within which Australian Pharmaceutical Industries Limited
operates. The Profit Announcement and Full Year presentation has not been audited or reviewed in accordance with
Australian Auditing Standards.

                                                                                                                                      24
FULL YEAR RESULTS 2016
Appendix 1 - Definitions
• EBITDA - Result from operating activities before Depreciation and Amortisation
• EBIT – Result from operating activities
• Free Cash – Cash generated from operations less capital expenditure. It does not include
financing costs and tax paid
• Comparable Store Growth - Sales performance compared to last period for stores
trading in the retail network greater than one year
• Interest Cover – Result from operating activities divided by net financing costs
• Net Debt – Borrowings less cash on hand
• Return on capital employed (ROCE) – underlying EBIT / Equity plus Net Debt
• Return on equity (ROE) – underlying NPAT/Equity
• Underlying Pharmacy Revenue Growth – Revenue computated on volumes before PBS
price changes that occur on 1 April and 1 October each year
• Retail register sales – Sales recorded at the register of all franchise and company owned
stores which exclude dispensary sales. Register sales made by franchisees do not form
part of the result of the consolidated entity
• Retail network – franchise and company stores in the Priceline/Priceline Pharmacy brand
• Underlying EBIT – EBIT calculated as above without including one-off impairment or other
one-off charges
• Underlying NPAT – NPAT calculated with the same exceptions as underlying EBIT. Refer
page 25 for prior comparable period.
25FULL YEAR RESULTS 2016 Appendix 2 – FY16 Income Statement $M AUD FY16 FY15 Change Revenue 3,840.0 3,457.4 11.1% Gross Profit 477.9 453.8 5.3% Less Operating Costs net of Other Income 390.8 379.8 2.9% EBIT* 87.1 74.0 17.7% Less Net Financing Costs 15.8 14.1 12.1% Less Associates 2.4 0.4 - Less Tax Expense 17.2 16.3 5.5% NPAT pre adjustment 51.7 43.1* 19.8% Add back CH2 2.4 0.4 - Tax adjustment to prior year debtor provision (2.7) - - Underlying NPAT 51.4 43.6* 18.0% *Rounding discrepancy adjusted 26
AUSTRALIAN PHARMACEUTICAL INDUSTRIES LIMITED
2016 FULL YEAR RESULTS PRESENTATION
THURSDAY 20 OCTOBER 2016
You can also read