Staples, Inc. (Nasdaq: SPLS) - Alpha Challenge
←
→
Page content transcription
If your browser does not render page correctly, please read the page content below

2012 UNC Alpha Challenge

Staples, Inc. (Nasdaq: SPLS)
Taylor Davis, Richard Hunt, Stephen Lieu

Do not think

     “brick and mortar”or “back to school”…

                     think

“B2B contract and direct relationship selling”
                                                 2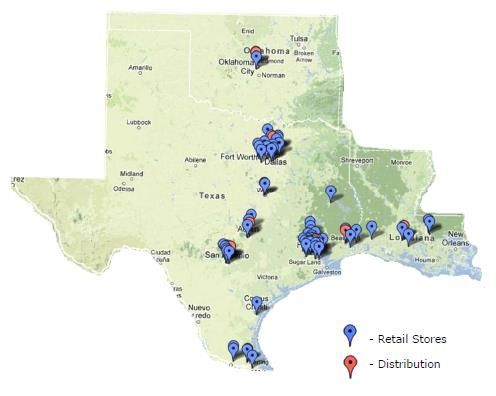
Investment Recommendation
Recommendation: Buy common shares of SPLS with
a target share price of $18.00, which represents 57%
upside to the current share price
We believe SPLS presents an attractive investment
opportunity for the following reasons:
North American Delivery segment alone is worth
the current share price;
Threat from Amazon is misunderstood;
Shift to smaller stores will reduce costs without
sacrificing sales;
Push into high-growth, high-margin categories
offsets slow declines in paper, ink, and toner
3
Company Overview
Revenue By Category and Segment
World’s largest office supplies company
Industry leader in sales (more than 2x closest competitor) and profitability (more than 5x
closest competitor)
Second-largest internet retailer: Staples.com is the Amazon.com of office supplies
80% of sales are B2B
Categories Segments North American Delivery
20%
44% 40% 49%
Office Supplies
North American 15%
Delivery Staples.com
Office Machines and Related
Products North American Retail
Computers and Related Quill.com
30% Products 39% 65%
Services 45% International
Operations Staples Advantage
Office Furniture
15%
21%
6%
5% 6%
2011 Sales 2011 Sales 2011 Operating Income 2011 Sales
4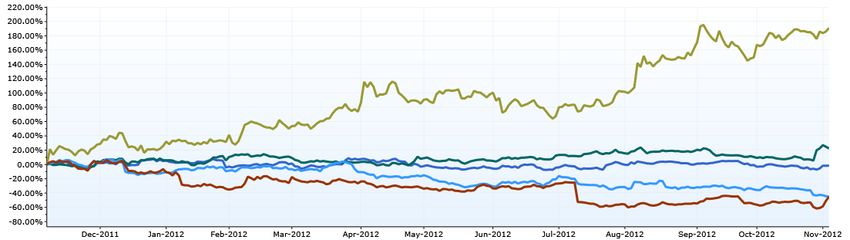
Share Price Performance
SPLS vs. Peers
SPLS has underperformed its peers over the past twelve months
90.%
70.%
50.% OfficeMax: +48%
30.%
10.% Office Depot: +10%
-10.%
Staples: (22%)
-30.%
-50.%
May-12
Feb-12
Mar-12
Jul-12
Nov-11
Dec-11
Oct-12
Jun-12
Sep-12
5Comparable Companies
Office Depot & OfficeMax
Office Depot (NYSE: ODP) and OfficeMax (NYSE: OMX) are Staples’ closest competitors
Shares Market Enterprise
Net Debt
Price ($) Oustanding Capitalization Value EV/EBITDA P/E
($mm)
(mm) ($mm) ($mm)
LTM NTM LTM NTM
Office Depot, Inc. 2.51 285.2 715.9 251.9 1,349.3 3.8 4.1 8.7 41.8
OfficeMax Inc. 7.44 86.6 644.3 1,262.9 1,907.2 10.0 8.6 16.2 9.7
Staples, Inc. 11.57 682.4 7,895.4 1,058.9 8,954.3 4.4 4.6 8.6 8.1
North American 3-Year
Gross Operating Net Income Estimated
Distribution CAGR
Margin Margin Margin Sales/sf ($)
Centers (a) Sales
LTM LTM LTM
Office Depot, Inc. 30.3% 0.3% 1.0% 13 466.5 -7.5%
OfficeMax Inc. 25.4% 1.2% 0.6% 27 391.6 -4.9%
Staples, Inc. 26.8% 6.5% 3.7% 70 596.3 2.7%
(a) As of FY 2011
6Valuation
Based on a sum-of-the-parts analysis, the North American Delivery segment alone is
worth the current share price
The current free cash flow yield of 13% is at an all-time high
Sum-of-the-Parts Valuation Free Cash Flow Yield
$16,000 14%
$14,000 12%
$12,000 NA Retail 10%
$5.0B
$10,000 8%
$8,000 6%
$6,000
Total
NA 4%
Current
$4,000 Delivery
EV 2%
$8.9B
$2,000 $8.9B
0%
$0
Estimated Segment E/V Current E/V
7Principal Reason Why SPLS Is Cheap…
Investors hate SPLS because of the
Amazon Threat
But, they misunderstand…
81 B2B Selling (Contract/Direct Relationship)
Thesis: The market completely misunderstands Amazon’s threat to B2B. B2B requires
complex sales relationships with custom service levels. Amazon does not have this sales base
B2B B2C
High-Touch Low-Touch
Sales Sales
Free
Free 2-day
next/same-
delivery
day delivery
92 Good Game Plan for Retail
Thesis: While Amazon is a threat to this segment, stores are profitable and will continue to
be as Staples shrinks its store size without sacrificing sales
High
Decrease
Maintain incremental
store size
sales returns on
by 32%
capital
By 2015, Staples will be saving Percentage of U.S. Store
$250mm/year relative to today Lease Renewals:
$14,200 9.6%
~40% over next 3 years
$14,100 13.0%
9.4%
$14,000 9.2% Invested
$13,900 Capital 12.5%
9.0% (Left-Hand
$13,800
8.8% Scale)
$13,700 12.0%
8.6%
$13,600 ROIC (Right-
$13,500 8.4% Hand Scale) 11.5%
$13,400 8.2%
$13,300 8.0% 11.0%
2009 2010 2011 2012 2013 2014
103 Significant Growth Opportunities in New Categories
Thesis: New categories– Facilities & Breakroom in particular– are plug-and-play, have
material growth opportunities, and have higher margins than Office Supplies
Services • EasyTech
Copy & • 5%-7% growth
Print
Facilities & • $0 in 2005, $1.5B today
Breakroom • 20% growth in FY 2012
2x or better margins relative to Office Supplies
11Investment Risks and Mitigating Factors
International business is not as strong as the North American business, and continued macro
and company-specific problems could significantly drag down the stock
Management is being proactive:
> Staples has announced plans to close 45 unprofitable stores and sell off its
unprofitable printing systems business
> John Wilson, Staples’ respected former CFO and Gap’s former COO, has been
brought on to lead this turnaround
Ink/Paper/Toner declines more than expected
1%-2% decline in paper sales offset by price increases resulting from decreased mill
capacity
Paper is a “basket-starter” with low margins—decreases in sales will not materially affect
profitability
Amazon makes a U-turn and decides to invest heavily in the office supply/B2B space
Staples’ world-class logistics and massive scale in office supplies give it an advantage
12Appendix
Table of Contents
A Additional Upside
B Near-Term Value Realization
C Summary Financials
D Discounted Cash Flow Analysis
E Research Process
13A Additional Upside
Participation in Employment Rebound
Staples’ North America Delivery sales are highly correlated with white-collar employment.
More office workers means more office supply sales
As white-collar employment bounces back, we expect Staples’ North American Delivery sales
to increase
We expect operating margins to increase up to 75bps as the company leverages its fixed costs
Staples North America Delivery Sales
Correlated with White Collar Employment
Source: Pzena Investment Management
14B Near-Term Value Realization
Possibility of Buyout
The possibility of a buyout increases the probability of near-term value realization
Staples is an attractive buyout candidate:
Strong and stable free cash flow
Low valuation – 13% free cash flow yield at all-time high
Under-leveraged balance sheet – lowest leverage since 2008
Strong brand and market leadership
High-quality management
There have been rumors of a Bain-led buyout
“Could Staples go private?”, Dan Primack, CNNMoney, 9/13/12
15C Summary Financials
Staples Summary Financials
Segment Margins 2008 2009 2010 2011
($mm) 2008 2009 2010 2011 North American Delivery 9.0% 8.2% 8.5% 8.7%
Revenue $23,084 $24,276 $24,545 $25,022 North American Retail 8.1% 8.3% 8.1% 8.3%
% Growth - 5.2% 1.1% 1.9% International Operations 3.3% 2.3% 3.2% 1.8%
Gross Profit $6,247 $6,474 $6,606 $6,742
% Margin 27.1% 26.7% 26.9% 26.9%
SG&A $4,631 $4,907 $4,913 $5,048
% of Revenue 20.1% 20.2% 20.0% 20.2%
% Growth - 6.0% 0.1% 2.8%
EBIT $1,616 $1,567 $1,693 $1,693
% Margin 7.0% 6.5% 6.9% 6.8%
D&A $549 $552 $499 $482
% of Revenue 2.4% 2.3% 2.0% 1.9%
EBITDA $2,165 $2,119 $2,192 $2,175
% Margin 9.4% 8.7% 8.9% 8.7%
% Growth - (2.1%) 3.4% (0.7%)
CapEx $378 $313 $409 $384
% of Revenue 1.6% 1.3% 1.7% 1.5%
16D Discounted Cash Flow Analysis
17E Research Process
Resources Used People Contacted
10-Ks, 10-Qs Staples investor relations
Last 10 quarters earnings transcripts Staples salespeople
Sell-side research reports Competitors
Investor presentations OfficeMax investor relations
Primary research Amazon customer support
Sell-side Analysts
Caris & Company
Credit Suisse
Customers
Columbia University purchasing manager
Small financial services firm
Suppliers
United Stationers, Inc.
Publicly-traded supplier with $80mm in
sales to Staples
Buy-side Analysts
Lead analyst of major Staples shareholder
182012 UNC Alpha Challenge Conn’s, Inc. (Nasdaq: CONN) Taylor Davis, Richard Hunt, Stephen Lieu
Investment Recommendation
Recommendation: Short common shares of CONN
with a target share price range of $9.00 to $13.00,
which represents a 50% to 65% discount to the
current share price
We believe CONN presents an attractive short
opportunity because the company:
1 Operates in an industry in secular decline;
2 Has deteriorating underwriting standards that
have led to a high risk credit portfolio that will
eventually result in substantial write-offs;
3 Has aggressive accounting practices;
4 Has misleading same-store sales growth; and
5 Is trading at an extraordinarily high valuation on
all metrics
20Company Overview
Revenue By Segment / Geographic Locations
Brick-and-mortar retailer of home appliances, 65 brick-and-mortar locations
furniture, mattresses, and consumer electronics in three states
57 in Texas
6 In Louisiana
2 in Oklahoma
21Company Overview
Credit Offering
Offers consumers a credit product not available at
traditional retailers
88% of sales were financed in FY Q2 2013
Financing is offered through three different means:
In-House Credit (69% of sales)
For customers with credit scores that
are generally between 550 and 650
Receivables carried on balance sheet
GE Capital’s Promotional Credit (16% of sales)
For customers with credit scores that are
typically above 650
Cash received upfront, no risk to CONN
Rent-A-Center’s Acceptance (3% of sales)
For customers denied financing by CONN
Cash received upfront, no risk to CONN
22Investment Thesis
We believe CONN is a highly attractive short candidate for several reasons:
1 Secular Decline in Brick-and-Mortar Specialty Retail Industry
2 Deteriorating Underwriting Standards High Risk Credit Portfolio
3 Aggressive Accounting Practices
4 Misleading Same-Store Sales Growth
5 Extraordinarily High Valuation
231 Secular Decline in Brick-and-Mortar Specialty Retail Industry
Amazon brick-and-mortar specialty retailers sales decline
Amazon = lower SG&A = lower prices
Brick-and-mortar sales decrease high operating leverage = difficult to cover fixed costs
Circuit City bankruptcy
Best Buy struggling
Many believe that it is only a matter of time before the entire industry moves online
and brick-and-mortar specialty retailers cease operations
242 Deteriorating Underwriting Standards High Risk Credit Portfolio
Percentage of Sales Financed by In-House Credit Offering
Over the past six quarters, the percentage of sales financed by CONN’s in-house credit offering
has steadily increased and is at its all-time high
72.0%
70.0% 69.4%
68.0% 66.9%
66.5%
66.0%
64.0%
62.1%
62.0%
60.0%
58.0%
56.4%
56.0% 55.0%
54.0%
FY12 FY12 FY12 FY12 FY13 FY13
Q1 Q2 Q3 Q4 Q1 Q2
252 Deteriorating Underwriting Standards High Risk Credit Portfolio
Average Down Payment
The average down payment has been decreasing and is at its all-time low
9.0%
8.0%
8.0%
7.0%
6.0% 5.7%
5.0% 4.6% 4.5%
4.0% 3.8%
3.0%
3.0%
2.0%
FY12 FY12 FY12 FY12 FY13 FY13
Q1 Q2 Q3 Q4 Q1 Q2
262 Deteriorating Underwriting Standards High Risk Credit Portfolio
Weighted Average Origination Credit Score of Sales Financed
The weighted average origination credit score of sales financed has been decreasing and is at
its all-time low
628
626
625
624
623
622
620
619
618
617
616
615 615
614
FY12 FY12 FY12 FY12 FY13 FY13
Q1 Q2 Q3 Q4 Q1 Q2
272 Deteriorating Underwriting Standards High Risk Credit Portfolio
Promotional Receivables as % of Total Outstanding Receivables
Promotional receivables (0% financing) has increased to its all-time high as CONN attempts to
boost sales
22.0%
21.0%
20.0%
18.0% 17.7%
16.0%
14.8%
14.0%
12.0% 11.2%
10.0% 9.7%
9.2%
8.0%
FY12 FY12 FY12 FY12 FY13 FY13
Q1 Q2 Q3 Q4 Q1 Q2
282 Deteriorating Underwriting Standards High Risk Credit Portfolio
Current Credit Business Trends Will Lead to a Substantial Increase in Write-offs
1. Percentage of Sales
Financed Increasing
2. Down Payments Decreasing
High Risk Substantial
Credit Future
Portfolio Write-offs
3. Credit Scores Decreasing
4. Promotional Receivables
Increasing
292 Deteriorating Underwriting Standards High Risk Credit Portfolio
Write-Offs (net of recoveries) as a % of Average Outstanding Receivables Balance (annualized)
As expected from the fundamentals of the portfolio, write-offs have been increasing and we
expect them to get worse in future quarters
11.0%
10.4%
10.0%
9.0%
8.5% 8.4%
8.0%
8.0%
7.0% 6.8%
6.0%
4.9%
5.0%
4.0%
FY12 FY12 FY12 FY12 FY13 FY13
Q1 Q2 Q3 Q4 Q1 Q2
302 Deteriorating Underwriting Standards High Risk Credit Portfolio
With the industry facing secular headwinds, CONN has decreased its credit standards to
sustain its sales figures. This has resulted in:
Inflated sales figures
Deteriorating quality of receivables portfolio
Higher expected future write-offs
CONN’s accounting policy allows delinquent receivables to stay on the company’s balance
sheet for 209 days before any write-offs
For comparison, AAN’s policy is to write off lease receivables that are 60 days or more past
due while RCII writes off delinquent accounts that are 90 days past due
CONN’s increasingly risky practices and deteriorating quality of the portfolio will be
exposed through substantial write-offs in its receivables portfolio in future quarters
313 Aggressive Accounting Practices
Provision for Bad Debt
Year-to-date FY Q2 2013, the company estimated Provision for Bad Debt to be 9% of sales
financed by in-house credit. Given CONN’s loose underwriting standards, we believe this
should be at least at the 13% level experienced in FY 2012, if not greater
At the 13% level, operating margin would decrease from 19% to 4%
324 Misleading Same-Store Sales Growth
CONN vs. Competitors
Over the past four quarters, CONN has displayed impressive same store growth, while other
brick-and-mortar competitors have struggled
334 Misleading Same-Store Sales Growth
Store Count Growth
A closer look at the numbers reveals reason for concern. CONN's same-store numbers are
misleading for two reasons:
CONN has been closing its weakest stores, and therefore, the same store comps
include only the most profitable stores
344 Misleading Same-Store Sales Growth
Store Density in Key Markets
CONN's stores are densely located and to some extent cannibalize sales from each other.
Thus, closing a store will result in an increase in sales at nearby stores
Houston: 20 CONN stores within a 25 mile radius Dallas / Fort Worth:
13 CONN stores within a 30 mile radius
355 Extraordinarily High Valuation
Share Price Performance
Over the past twelve months, CONN has significantly outperformed its peers
CONN +191%
AAN +22%
RCII (2%)
BBY (45%)
HGG (45%)
365 Extraordinarily High Valuation
Comparable Company Analysis
On a multiples basis, CONN trades at a significant premium to its peers
375 Extraordinarily High Valuation
Estimated Fair Value
Comparable Company Analysis
We believe CONN should be valued at a blended average multiple of the four comps
Based on price-to-earnings and EV/EBITDA multiples, this would imply a price range of
$9.00 to $14.00 per share
Discounted Cash Flow Analysis
Based on our discounted cash flow analysis (Appendix C), we estimate the intrinsic value of
CONN to be $10.00 to $12.00 per share
Valuation Range
Based on our valuation methodologies, we estimate the fair value of CONN shares to be in
the $9.00 to $13.00 per share range, which represents a 50% to 65% discount to the current
share price
38Investment Risks and Mitigating Factors
High Short Interest Short Squeeze
In 2012, insiders have sold 1.5 million shares for $27 million, which has increased the
public float by 10%
In addition, CONN has filed an S-3 to issue up to $150 million in primary shares and sell
up to $100 million in secondary shares in the near future
– Assuming shares are issued at a 10% discount to the current share price, this would
increase the public float by 68%, from 16 million to 27 million shares
Improvement in Credit Standards
If the company were to tighten its underwriting standards, this would negatively impact
sales by shrinking the potential customer base
Improvement in Delinquency Rates
39Appendix
Table of Contents
A Financials: Retail Segment
B Financials: Credit Segment
C Discounted Cash Flow Analysis
D Research Process
40A Financials: Retail Segment
41B Financials: Credit Segment
42C Discounted Cash Flow Analysis
43D Research Process
Resources Used People Contacted
10-Ks, 10-Qs CONN investor relations
Earnings transcripts Competitors
Sell-side research reports Best Buy investor relations
Investor presentations Hhgregg investor relations
Company press releases Aaron’s investor relations
Glassdoor employee reviews Rent-A-Center investor relations
Sell-side analysts
Canaccord Genuity
Caris & Company
44You can also read