Sales are down -26.8% month-over-month. The year- over-year comparison is up
←
→
Page content transcription
If your browser does not render page correctly, please read the page content below
Permission is granted only to ARMLS® Subscribers for reproduction with attribution on to “ARMLS® COPYRIGHT 2021. For questions regarding this publication contact Brand@ARMLS.com.

    DATA FOR           JANUARY 2021                                    Published February 17, 2021

                                                                                                                                                         Sales are down
                                                                                                                                                         -26.8% month-over-
                                                                                                                                                         month. The year-
                                                                                                                                                         over-year
                                                                                                                                                         comparison is up
                                                                                                                                                         +11.8%.

Closed MLS sales with a close of escrow date from 1/1/21 to 1/31/21, 0 day DOM sales removed

                                                                                                                                      ARMLS STAT                  JANUARY 2021
1
New inventory is
                                                                                                                      up +26.0% month-
                                                                                                                      over-month while
                                                                                                                      the year-over-
                                                                                                                      year comparison
                                                                                                                      decreased by
                                                                                                                      -15.5%.

    New MLS listings that were active for at least one day from 1/1/21 to 1/31/21, 0 day DOM sales removed

                                                                                                                      Total inventory
                                                                                                                      has a month-over-
                                                                                                                      month decrease of
                                                                                                                      -3.3% while year-
                                                                                                                      over-year reflects
                                                                                                                      a decrease of
                                                                                                                      -41.0%.

    Snapshot of statuses on 1/31/21

2                                                                                                            ARMLS STAT   JANUARY 2021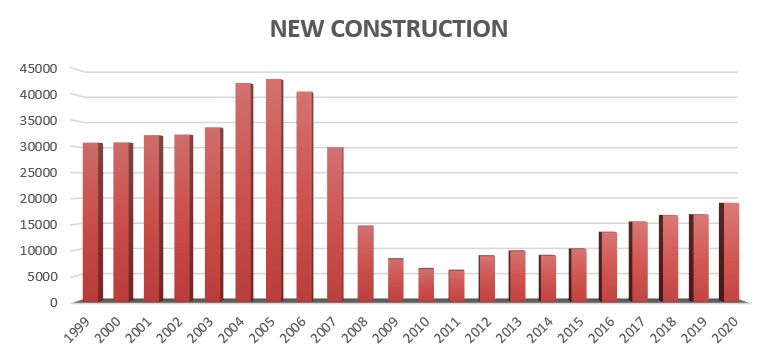
January UCB
                                                                                                                                 listings
                                                                                                                                 percent of total
                                                                                                                                 inventory was
                                                                                                                                 44.9% with
                                                                                                                                 January CCBS
                                                                                                                                 listings at 3.7% of
                                                                                                                                 total inventory.

    Snapshot of statuses on 1/31/21

                                                                                                                                 Months supply
                                                                                                                                 of inventory for
                                                                                                                                 December was
                                                                                                                                 1.01 with January
                                                                                                                                 at 1.34.

    Current inventory of Active/UCB/CCBS divided by the monthly sales volume of JANUARY 2021, 0 day DOM sales removed

3                                                                                                                       ARMLS STAT    JANUARY 2021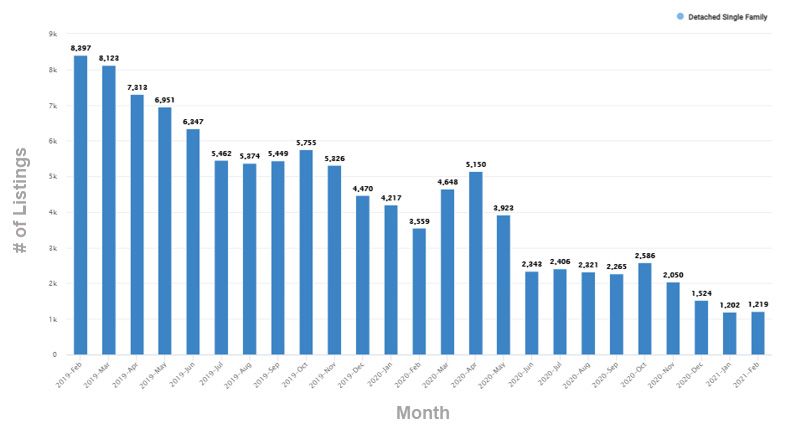
Average new
                                                                                                                                list prices are up
                                                                                                                                +10.0% year-over-
                                                                                                                                year. The year-
                                                                                                                                over-year median
                                                                                                                                is up +12.2%.

    List prices of new listings with list dates from 1/1/21 to 1/31/21, 0 day DOM sales removed

                                                                                                                                The average sales
                                                                                                                                price is up +20.6%
                                                                                                                                year-over-year
                                                                                                                                while the year-
                                                                                                                                over-year median
                                                                                                                                sales price is also
                                                                                                                                up +17.3%.

    MLS sales prices for closed listings with a close of escrow date from 1/1/21 to 1/31/21, 0 day DOM sales removed

4                                                                                                                      ARMLS STAT    JANUARY 2021
An increase is
forecasted in
February for both
average and
median sales
prices.
ARMLS proprietary predictive model forecast, 0 day DOM sales removed
Foreclosures pend-
ing month-over-
month showed a
decrease of -2.3%
while the year-
over-year figure
was down -48.4%.
Snapshot of public records data on 1/31/21 active residential notices and residential REO properties.
5 ARMLS STAT JANUARY 2021Distressed sales
accounted for 0.3%
of total sales, down
from the previous
month of 0.5%.
Short sales dropped
-62.5% year-over-
year. Lender-owned
sales dropped
-66.7% year- over-
year.
New MLS listings that were active for at least one day from 1/1/21 to 1/31/21, 0 day DOM sales removed
Days on market
were down -18 days
year-over-year while
month-over-month
went up +3 days.
MLS sales prices for closed listings with a close of escrow date from 1/1/21 to 1/31/21, 0 day DOM sales removed
6 ARMLS STAT JANUARY 2021COMMENTARY
BY TOM RUFF
As anticipated, ARMLS reported the highest sales volume of any January in our history. The 7,076 home
sales this January eclipsed the prior January record for ARMLS sales by 6.69%. There were 6,632 sales reported
by ARMLS in January 2005. Combine sales volume from last month with the highest average sales price ever
($439,620) and you arrive at an astounding gross dollar volume of $3.11 billion dollars, an annual increase of
35%. It should also be noted that on a historical basis, January is the slowest month of the year for sales, making
January activity that much more impressive. There were two fewer days to conduct business than last year.
One of the things I do each month before writing STAT is to go back and review our commentary from the
prior year. This is done primarily for two reasons. The first is to check the veracity of our reports. The second is to
monitor our seasonal patterns. Last year we discussed falling interest rates, falling inventories, higher sales volume
and rising prices. We described our market as a full-blown sellers’ market with the added caveat, “Anyone waiting
for prices to fall, well, they’ll be waiting.”
Now jump forward to January 2021. The current interest rate for a 30-year fixed-rate mortgage is now 2.73%
compared to 3.47% one year ago. Year-over-year, active listings are down 58%, sales volume is up 11.8% and
the median sales price is up 17.28%. And now we are entering our traditional buying season. We are now facing a
“full-blown sellers’ market” on steroids. At STAT we do not really forecast the future. With access to MLS and public
records data, we simply count and project. At times, our projections seem unbelievable, but what has been even
more unbelievable are the actual closing data each month.
7 ARMLS STAT JANUARY 2021COMMENTARY
BY TOM RUFF
Our pending price index (PPI) has underestimated the median sales price for nine consecutive months with
prices exceeding our mathematical models. Our current market is beyond description. I can only imagine the stress
buyers’ agents are experiencing. Anecdotally, we’re hearing properties selling as soon as they hit the market, with
multiple offers, with offers well above asking price. Our data supports these reports. Real estate is cyclical and at
some point, our current course will change, but changes in housing do not occur overnight without a catastrophic
event. When June numbers are reported, the time of year when sales volume and prices traditionally peak, anyone
in denial is in for an even bigger shock.
The charts below, courtesy of RapidStats chart builder, display the severe shortage of homes listed for sale.
The first chart shows ARMLS active listings by dwelling type and tracks their descent over the past 24 months. In
February 2019 ARMLS was reporting only 18,131 total active listings, which was 37% below what we would define
as a typical market. At the time of this report, ARMLS is reporting only 4,488 active listings without a contract. To
place this number in a historical perspective, current listings are 84% below what would be considered a typical
market. The inventory for manufactured/mobile homes has shown little change over the past two years, while
detached single-family listings have declined over 78%.
8 ARMLS STAT JANUARY 2021COMMENTARY
BY TOM RUFF
ARMLS Acting Listing by Dwelling Type via RapidStats
9 ARMLS STAT JANUARY 2021COMMENTARY
BY TOM RUFF
The sweet spot for the Maricopa County housing market is shown in the next chart. We saw an uptick in these
listings at the onset of COVID in April and March of last year only to fall dramatically in May. Today we have less
than a quarter of the number of detached single-family residences for sale in Maricopa County than we had in May
2020.
Maricopa County Detached Single Family 200k to 500k via RapidStats
10 ARMLS STAT JANUARY 2021COMMENTARY
BY TOM RUFF
Michael Orr of the Cromford report puts these numbers in perspective in his February 1 daily observation.
“It is difficult to describe the state of the housing market in Greater Phoenix these days. Just quoting the raw
facts makes many people feel you are exaggerating wildly. There are those who seem to believe it cannot
really be true when so many people are struggling with their daily lives, battling the worst pandemic we
have seen for many decades. However, we can only continue to present the facts. The housing market is
experiencing moderately strong demand, but this is not the important matter. Variations in demand are almost
insignificant. This is because the supply of resale homes is so poor it crashes below record lows almost every
week.
One method for looking at this is to use the Contract Ratio, which compares the number of homes under
contract with the number of homes available for sale without a contract. In a normal market the Contract Ratio
tends to lie between 30 and 60. Higher for a low-priced segment and lower for a high-priced segment. The
Contract Ratio for Greater Phoenix (all dwelling types) on February 1, 2021 stands at 239. Last year we saw
89. The previous record high was 174, set December 2020. The Contract Ratio tells us how hot the market is,
and how hard it is to find a home to buy. Over 60 represents a hot market and over 100 a feeding frenzy. We
have never had to invent a description for when it goes over 200, because it has never done this before. For
the market below $500,000, the Contract Ratio is over 300. The implication is that home price appreciation will
go much higher in 2021 than it did in 2020. Be warned. Do not be in denial.”
Last month in STAT we promised to look at new construction and foreclosure numbers, two metrics that have
increased inventory levels in the past as well as interest rates, a current tailwind in today’s market. We will discuss
interest rates in detail in our next STAT. Let us begin with new construction.
11 ARMLS STAT JANUARY 2021COMMENTARY
BY TOM RUFF
New Construction
Historically, Maricopa County has always been about growth. Decade after decade new home construction
dominated our housing landscape. It was not uncommon for newly built homes to account for 25% to 30% of all
homes sold during any given year. As the chart below shows, this trend abruptly changed in 2007. Even with the
number of new homes sold in Maricopa County increasing each year for the last 9 years, only 14.6% of all homes
sold in Maricopa County in January 2021 were new builds, approximately half of prior decades. The bad news is that
we cannot look to the home building industry to provide the additional inventory our current market needs. The good
news is that the home building industry is experiencing slow, stable and sustainable growth, offering assurances we
will not see a repeat of ‘04, ‘05 and ‘06. We expect 2021 to follow recent trends with only a modest increase in newly
built homes. It should be noted the gap between the median priced new home and the median priced resale is in
decline. According to Maricopa County public records, in January of this year the median sales price for a new build
was $382,170 compared to $342,000 for the median priced resale, or a gap of just over $42,000. A year ago, this
gap was nearly double at $81,000. The new construction median sales price was only 11.7% higher than the median
resale this January compared to 28.3% last January.
12 ARMLS STAT JANUARY 2021COMMENTARY
BY TOM RUFF
Foreclosures
On his first day in office, President Biden signed a bill to extend an eviction and foreclosure moratorium on
federally backed mortgages. Following the executive order, the U.S. Department of Agriculture announced they
would extend the moratorium for USDA Single Family Housing Direct and Guaranteed Loans through March 31. The
U.S. Department of Housing and Urban Development also announced that they extended the moratorium through
March 31, extending the original moratorium which began on March 18, 2020. It is undeniable that the moratorium
reduced foreclosures in 2020, however, the moratorium was just one of the reasons foreclosures declined. Lower
interest rates and rising home values also had an immediate impact on foreclosure activity.
13 ARMLS STAT JANUARY 2021COMMENTARY
BY TOM RUFF
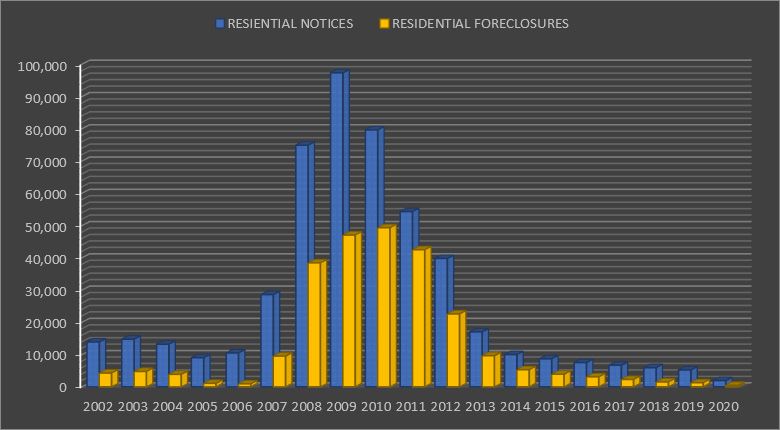
For the 11th straight year the number of properties entering the foreclosure process and the number of homes
that were foreclosed has declined. In 2020 the number of residential notices of trustee sales as well as the number
of actual home foreclosures were the lowest in history. Of the 469 residential foreclosures in Maricopa County in
2020, 73% were purchased by third-party investors and 27% reverted to the beneficiary (bank). By the numbers,
343 were purchased by investors and only 86 reverted to the lender.
14 ARMLS STAT JANUARY 2021COMMENTARY
BY TOM RUFF
What does this mean for defaults once the moratorium is lifted? First, I do not believe another extension is
out of the question. Second, when the moratorium is lifted it will lead to an increase in defaults, but nowhere near
the tsunami some are predicting. Even if the moratorium is lifted in April, actual foreclosures could not occur until the
second half of 2021. According to CoreLogic, Mortgage delinquencies are continuing a “slow retreat into pre-
pandemic territory.” The CoreLogic Loan Performance Report for November puts the percentage of loans that were
30 or more days past due, including those in foreclosure, at 5.9%. While this is still 2 points higher than the rate in
November 2019, it is the lowest overall rate since the initial surge in April of last year. The overall delinquency rate
reached 7.1% by summer before beginning to improve.
The rate for early-stage delinquencies, those 30 to 59 days past due, was 1.4% in November, down from 2% a
year earlier while adverse delinquency, loans 60 to 89 days past due, was unchanged year-over-year at 0.6%.
Loans that are seriously delinquent, 90 or more days past due or in foreclosure, are significantly higher than
in November 2019, 3.9% versus 1.3%. However, it is also the lowest rate since June. CoreLogic points to this as a
sign of increasing stabilization. The share of mortgages in process of foreclosure is 0.3%, down from 0.4% the prior
November. This is probably an artifact of the foreclosure moratoriums that are still in effect.
The first place we would see an increase in default activity would be in the number of notices of trustee
sales. We will closely monitor this metric and report any uptick as it occurs. Once the notice is filed the earliest any
property can be foreclosed upon is 90 days. Even with the moratorium being lifted, the homeowners in default will
still have multiple options.
15 ARMLS STAT JANUARY 2021COMMENTARY
BY TOM RUFF
When it comes to distressed properties, homeowners with equity have options. The amount of equity a
homeowner has is the number one determinant in deciding whether their property is lost to foreclosure. The current
rapid rise in equity will be the largest deterrent to future foreclosure activity. While we count foreclosures as they
occur, the foreclosure itself is a byproduct of when the loan originated. In 2020, 45% of the foreclosures which
occurred were still coming from 2005-2008 loan originations. In 2019 the “housing bubble” accounted for 46% of
all residential foreclosures. In 2018 this metric was 55.4%. As you can see, the pig (housing bubble) is still moving
through the python. Historically, and we are talking nearly twenty years ago, foreclosures would peak two to three
years after origination. Over the last 3 years we have seen the median price home appreciate 17.3% in the last year,
8.9% in 2019 and 5.6% in 2018. The combined equity gains over the last three years coupled with all but certain
gains this year offer recent homebuyers an added protection to combat foreclosures. Foreclosures might well rise in
2021, but this is only because foreclosure activity was so low in 2020. Without a complete collapse in home values,
foreclosures will remain at historically low levels in 2021. Any help to our current supply issues from “distressed”
properties will come from homeowners that have exhausted their forbearance options.
In conclusion, in 2021 we cannot expect either new construction or foreclosures to help remedy our current
supply issues. Any increase in inventory will have to rely on market principles.
16 ARMLS STAT JANUARY 2021COMMENTARY
BY TOM RUFF
Pending Price Index
Last month the STAT mathematical model projected a median sales price for January of $338,000.
The January reported median was $340,000. For the ninth straight month our mathematical model slightly
underestimated our reported median sales price. Throughout 2020 our optimistic monthly projections repeatedly
underestimated our current market strength. Looking ahead to February, the ARMLS Pending Price Index is
projecting a median sales price of $345,000.
We began February with 6,714 pending contracts, 4,256 UCB listings and 347 CCBS giving us a total of
11,317 residential listings practically under contract. This compares to 10,693 of the same type of listings one year
ago. At the beginning of February, the pending contracts were 5.84% higher than last year. There were 19 business
days in February of 2020 and 19 this year. ARMLS reported 7,279 sales in February of 2020. We should see year-
over-year sales gains this February. The highest sales volume ever in February occurred in 2005 when ARMLS
reported 7,781 home sales. The February sales volume should approach or possibly even exceed the volume in
2005.
17 ARMLS STAT JANUARY 2021You can also read


