Impact of China's ban on Korean wave on the Korean stock market: Evidence from the entertainment sector
←
→
Page content transcription
If your browser does not render page correctly, please read the page content below

Journal of Physics: Conference Series

PAPER • OPEN ACCESS

Impact of China‘s ban on Korean wave on the Korean stock market:
Evidence from the entertainment sector
To cite this article: W J Choi 2021 J. Phys.: Conf. Ser. 1936 012003

View the article online for updates and enhancements.

 This content was downloaded from IP address 46.4.80.155 on 12/10/2021 at 11:42
ICAPM 2021 IOP Publishing
Journal of Physics: Conference Series 1936 (2021) 012003 doi:10.1088/1742-6596/1936/1/012003

Impact of China’s ban on Korean wave on the Korean stock
market: Evidence from the entertainment sector

 W J Choi

 North London Collegiate School, Jeju, South Korea
 E-mail:wjchoi22@pupils.nlcsjeju.kr

 Abstract. This study investigates the impact of China’s ban on the Korean wave (BKW) on
 domestic entertainment stock prices. The ban was triggered by the Korean government’s
 decision to deploy a terminal high-altitude area defence in Korea in 2016. We explore the
 statistical equilibrium of stock returns using the entropy applied with symbolic time series
 analysis. Moreover, we confirmed that the BKW harmed the pricing complexity of Korean
 entertainment stocks. Our finding can be understood as a monotonous stock price pattern because
 the market information was not reflected efficiently due to the decrease in transactions among
 investors concerned about the negative impact on the entertainment sector.

1. Introduction
In August 2016, after the Korean government decided to deploy a terminal high-altitude area defence,
China has implemented a ban on the Korean wave (BKW), which is a retaliatory measure. Therefore,
the transmission of content produced in Korea and advertisements by Korean entertainers in China was
prohibited. The share of Korean content in China’s exports is 26.2%, which is second only to Japan;
thus, the impact of this Chinese action on Korea’s cultural content industry will be significant, as shown
in Figure 1.
As such, this study investigates how BKW has affected Korea’s entertainment sector in terms of long-
term equilibrium. 1 To characterise the change in long-term equilibrium pre- and post-BKW, we
examine the spread of time-varying patterns in the log return series of stock returns by a monthly average
of Shannon entropy, showing the degree of dissociation forms long-term equilibrium around the BKW.
Entropy is a useful tool for measuring the uncertainty and complexity of dynamics systems [1].
Therefore, several recent studies have attempted to understand the complexities of systems in various
asset markets by entropy, such as stock [1], cryptocurrency [2, 3] and crude oil market [4, 5]. The listed
studies explored the predictability of the asset price [1, 3] or further investigated the complexity of the
pricing system that changed after a specific shock [2] such as the 2008 global financial crisis [4, 5].
Extensive prior studies focused only on macroscopic effects by using the stock index to examine the
impact of serious economic shocks, such as the financial crisis and slump in oil prices, on the stock
market. In contrast, this study focused on negative shocks that affect only certain industries, which may
not be observed through the stock index. Therefore, we provide a detailed understanding of the stock
market in a microscopic framework.
The rest of this paper is organised as follows. Section 2 presents the methodology and data. Section 3
provides the results and discussion. Section 4 concludes the paper.

1
 In our study, the long-term equilibrium indicates statistical equilibrium. The long-term equilibrium is a widely
used concept in physics and information theory, derived by maximizing the entropy of a system that shows the
most probable state of the system [6].

 Content from this work may be used under the terms of the Creative Commons Attribution 3.0 licence. Any further distribution
 of this work must maintain attribution to the author(s) and the title of the work, journal citation and DOI.
Published under licence by IOP Publishing Ltd 1
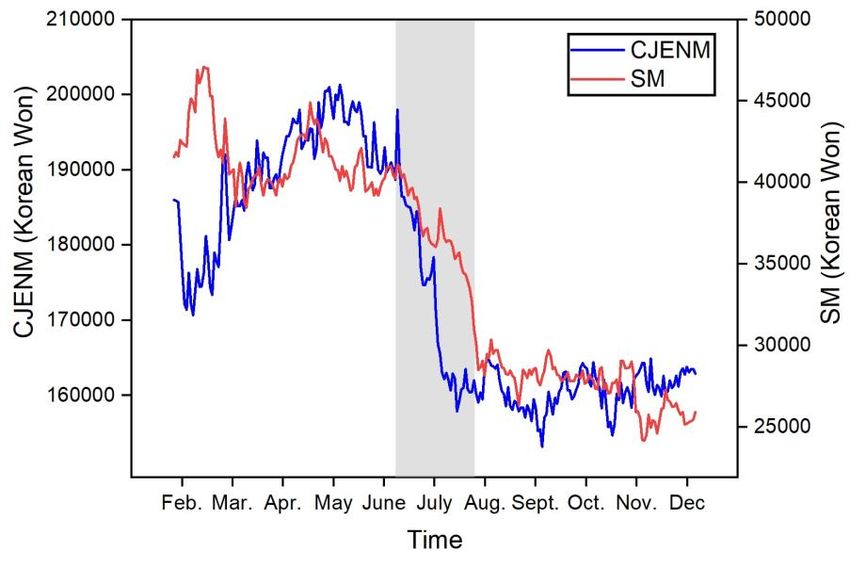
ICAPM 2021 IOP Publishing
Journal of Physics: Conference Series 1936 (2021) 012003 doi:10.1088/1742-6596/1936/1/012003

 Figure 1. Entertainment stock price changes according to BKW. The
 shaded area is the period when BKW began in July 2016.

2. Methodology and data

2.1. Methodology
To investigate the distance from the long-term equilibrium of the selected entertainment stock items, we
measured the entropy through the symbolic time series analysis (STSA) of discrete random variables.
According to Shannon [7], the entropy of a discrete random variable is given by
 H(X) = − ∑M
 i=1 p(xi ) ln p(xi ),

where is the number of possible outcomes of the random variable , and ( ) is defined as the
probability assigned to state .
The entropy is calculated based on the probability assigned to each state, not the realised outcomes;
therefore, the entropy is relatively less sensitive and robust to extreme observations. This advantage
makes it widely used in research to explore the degree of randomness and uncertainty in the financial
time series [8, 9, 10].
Furthermore, the STSA approach is robust to noise and widely adopted in the field of physics,
information and finance [10, 11, 12]. The sequence of consecutive returns of an asset is represented
by 0 and 1: each positive return is converted to 1, and otherwise, it is converted to 0. Then, each sequence
of length is converted to a decimal number . Applying this conversion process to all returns with
a daily moving window, we can calculate the Shannon entropy of the discrete variable as
 −( −1)
 ( ) = − ∑ =1 ( ) log 2 ( ).
In addition, to offset the increases in ( ) by increases, we normalise the variable as follows:
 1
 ℎ( ) = ( ).

Several past studies [10, 13] have documented that the STSA approach captures the uncertainty of the
financial time series better than the histogram-based method. Accordingly, we used the STSA method
to capture the spread of time-varying patterns in a log return series. Moreover, we applied = 3, =
2 and = 4 to confirm the robustness of .

 2
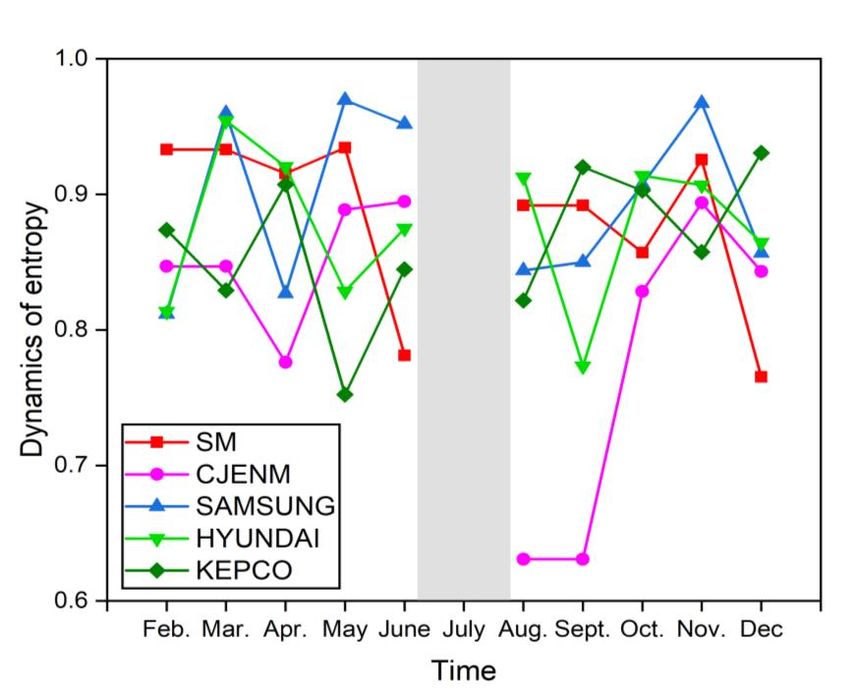
ICAPM 2021 IOP Publishing
Journal of Physics: Conference Series 1936 (2021) 012003 doi:10.1088/1742-6596/1936/1/012003

2.2. Data
To explore the impact of BKW on the Korean stock market, we selected SM Ent and CJENM2, which
are considered the most representative companies in the entertainment sector in the market. In addition,
Samsung, Hyundai and Korea Electric Power Corporation (KEPCO)3, which belong to different sectors,
were selected as comparison targets to examine the impact of BKW on the entertainment sector. Prices
for all stocks are daily closing prices, which are obtained from the Korean stock exchange. The sample
data span from January 2016 to December 2016, excluding holidays. The data are divided into two
categories, namely, pre- and post-BKW in July 2016, to compare the changes in price patterns in the
entertainment sector. All data were converted to log returns4 as shown below:

 = ln ( ),
 −1

where and are the log return and price at time .
Table 1 provides descriptive statistics for our samples. The descriptive statistics of all stock data are
similar in terms of the standard deviation. However, Samsung and Hyundai show a positive average,
whereas SM Ent, CJENM and KEPCO show negative values. In addition, Samsung and KEPCO show
negative skewness, suggesting that investors are risk-averse in their decisions [14, 15] compared with
symmetric distributions. Lastly, Samsung exhibits leptokurtic features, which is commonly observed in
assets with kurtosis greater than 3.

 Table 1. Descriptive statistics.
 No. of obs. Mean Std. Skewness Kurtosis
 SM Ent. 246 −0.0001 0.0214 0.1179 1.7601
 CJENM 246 −0.0005 0.0138 0.2642 1.0675
 Samsung 246 0.0016 0.0168 −0.8223 3.4794
 Hyundai 246 0.0000 0.0155 0.1771 0.2007
 KEPCO 246 −0.0005 0.0154 −0.0408 0.3915

3. Results and discussion
Table 2 and Figure 2 show the equilibrium of each stock pre- and post-BKW. Our results present that
the long-term equilibrium decline for the entertainment sector is more pronounced than for other sectors.
On average, pre- and post-BKW, the long-term equilibrium of SM Ent and CJENM decreased by 5.5%
(from 0.9037 to 0.8538) and 7.7% (from 0.8819 to 0.8145), respectively. Meanwhile, Samsung and
Hyundai declined slightly to 2% (from 0.9040 to 0.8850) and 0.4% (from 0.8783 to 0.8742),
respectively, whereas KEPCO increased by 5% (from 0.8414 to 0.8865). As such, the long-term
equilibrium of the stock prices of other industries is relatively small or rather increased, but the stocks
of the entertainment sector were negatively affected during the same period.
These changes can be understood through the monotony of the pricing system. The investors’ sentiment
may have been influenced by regulations that negatively affect stock [16, 17]. Investors are inclined to
avoid risk; thus, investors who used to invest in the entertainment sector would have reduced their

2
 SM Ent is Asia’s leading entertainment group, encompassing music, drama, sports, new media, etc.; it
represents the Korean entertainment market. CJENM is a leading company in the trend of popular culture by
conducting various businesses across entertainment sectors, such as media and music contents and movies.
3
 Samsung and Hyundai are the global leading companies in Korea, manufacturing and selling electronic
communication equipment and automobiles, respectively. KEPCO is the only monopoly in Korea that produces
and sells electricity; it is considered a representative economic defence firm.
4
 We use the log return series to be free from non-stationary issue. The first condition in time series analysis is
that the statistical characteristics of time-series data are constant regardless of time. Thus, time-series data
containing stock prices are converted to log returns to ensure normality [18, 19]. Normality test results can be
check through appendix.

 3
ICAPM 2021 IOP Publishing
Journal of Physics: Conference Series 1936 (2021) 012003 doi:10.1088/1742-6596/1936/1/012003

trading volume in stocks related to the entertainment sector. Compared with the pre-BKW period, in the
post-BKW period, the trading volume of SM Ent and CJENM decreased by 25.7% (from 26,622,177 to
21,176,345) and 19.8% (from 2,534,756 to 2,115,259), respectively. Therefore, the decrease in the
transaction volume of the market did not effectively reflect the information in the price [16], and
consequently, reducing the complexity of pricing the entertainment price was decided monotonically
[5].

 Table 2. Measure of the long-term equilibrium change of each stock.

 Pre-BKW Feb. Mar. Apr. May June Average
 SM Ent. 0.9330 0.9330 0.9154 0.9345 0.7812 0.9037
 CJENM 0.8469 0.8469 0.7760 0.8886 0.8946 0.8819
 Samsung 0.8118 0.9598 0.8268 0.9695 0.9519 0.9040
 Hyundai 0.8136 0.9543 0.9203 0.8284 0.8749 0.8783
 KEPCO 0.8737 0.8291 0.9073 0.7522 0.8447 0.8414
 Post-BKW Aug. Sept. Oct. Nov. Dec. Average
 SM Ent. 0.8918 0.8918 0.8569 0.9255 0.7654 0.8538
 CJENM 0.6308 0.6308 0.8284 0.8937 0.8431 0.8145
 Samsung 0.8439 0.8499 0.9073 0.9673 0.8567 0.8850
 Hyundai 0.9126 0.7733 0.9138 0.9067 0.8645 0.8742
 KEPCO 0.8217 0.9201 0.9028 0.8575 0.9306 0.8865

 Figure 2. Monthly long-term equilibrium dynamics of each stock.

4. Conclusion
This study investigates the impact of BKW on the entertainment sector in the stock market in terms of
long-term equilibrium using entropy. We conclude that compared with other sectors, the entertainment
sector has moved further from the long-term equilibrium post-BKW. We explain this issue as the

 4
ICAPM 2021 IOP Publishing
Journal of Physics: Conference Series 1936 (2021) 012003 doi:10.1088/1742-6596/1936/1/012003

monotony of the pricing process. Investors have reduced the trading volumes in the entertainment sector
to avoid the risks arising from a regulation called BKW, which has resulted in information not being
effectively reflected in the price. Therefore, the price is determined in a simpler process than before.
Our research provides market managers and investors with the following implications: 1) policy
managers should propose appropriate transaction incentives to investors to effectively reflect
information on prices in the event of a sudden decrease in transaction and 2) investors should diversify
their investment portfolio by sector to avoid the risk from negative micro-shocks for certain sectors.

5. References
[1] Ahn, K., Lee, D., Sohn, S., Yang, B. (2019). Stock market uncertainty and economic
 fundamentals: An entropy-based approach, Quantitaive Finance 19(7), 1151-1163.
[2] Baker, M., and Wurgler, J. (2007). Investor sentiment in the stock market. Journal of Economic
 Perspectives 21(2), 129-152.
[3] Baker, M., Wurgler, J., Yuan, Y. (2012). Global, local, and contagious investor sentiment.
 Journal of Financial Economics 104(2), 272-287.
[4] Bakshi, G., Kapadia, N., Madan, D. (2003). Stock return characteristics, Skew laws, and the
 differential pricing of individual equity options. Review of Financial studies 16(1), 101-143.
[5] Butler, K.C., and Malaikah, S.J. (1992). Efficiency and inefficiency in thinly traded stock
 markets: Kuwait and Saudi Arabia. Journal of Banking & Finance 16(2), 197-210.
[6] Jaynes, E. T. (1957). Information theory and statistical mechanics, Physical Review 106(4), 620.
[7] Daw, S., Finney, C., Kennel, M. (2000). Symbolic approach for measuring temporal
 ‘irreversibility’. Physical Review E 62(2), 1912.
[8] Ekholm, A., and Pasternack, D. (2007). The negative news threshold: An explanation for negative
 skewness in stock returns. European Journal of Finance 11(6), 511-529.
[9] Franses, P., and Ghijsels, H. (1999). Additive outliers, GARCH and forecasting volatility.
 International Journal of Forecasting 15(1), 1-9.
[10] Gu, R. (2017). Multiscale Shannon entropy and its application in the stock market. Physica A 484,
 215-224.
[11] Hudson, S., and Gregorious, A. (2015). Calculating and comparing security returns is harder than
 you think: A comparison between logarithmic and simple returns, International Review of
 Financial Analysis 38, 151-162.
[12] Lahmiri, S. (2016). Clustering of Casablanca stock market based on Hurst exponent estimates,
 Physica A 456, 310-318.
[13] Kristoufek, L. (2018). On Bitcoin markets (in)efficiency and its evolution, Physica A 503, 257-
 262.
[14] Jang, S.M., Yi, E., Kim, W.C., Ahn, K. (2019). Information flow between Bitcoin and other
 investment assets. Entropy 21(11), 1116.
[15] Joo, K., Suh, J.H., Lee, D., Ahn, K. (2020). Impact of the global financial crisis on the crude oil
 market. Energy Strategy Reviews 30, 100516.
[16] Lahmiri, S., and Bekiros, S. (2018). Chaos, randomness and multi-fractality in Bitcoin market.
 Chaos, Solitons & Fractals 106, 28-34.
[17] Mensi, W., Aloui, C., Hanmdi, M., Nguyen, D. (2012). Crude oil market efficiency: An empirical
 investigation via the Shannon entropy. International Economics 129, 119-137.
[18] Rousseeuw, P., and Hubert, M. (2011). Robust statistics for outlier detection. WIREs Data Mining
 and Knowledge Discovery 1(1), 73-79.
[19] Ruiz, M., Guillamom, A., Gabaldon, A. (2012). A new approach to measure volatility in energy
 markets. Entropy 14(1), 164-171.

 5
ICAPM 2021 IOP Publishing
Journal of Physics: Conference Series 1936 (2021) 012003 doi:10.1088/1742-6596/1936/1/012003

Appendix
 Table 3. Unit-root tests result.

 Augmented Dickey-Fuller test result Lag
 −6.0355*** 6
 SM Ent.
 (0.000)
 −6.7139*** 6
 CJENM
 (0.000)
 −7.6037*** 6
 Samsung
 (0.000)
 −6.461*** 6
 Hyundai
 (0.000)
 −7.0018*** 6
 KEPCO
 (0.000)

 6
You can also read