Investor Presentation - TSX Venture Exchange: VQS.V and OTCQX: VQSLF March 2020 - VIQ Solutions
←
→
Page content transcription
If your browser does not render page correctly, please read the page content below
Investor Presentation
TSX Venture Exchange: VQS.V and OTCQX: VQSLF
                 March 2020

                                               0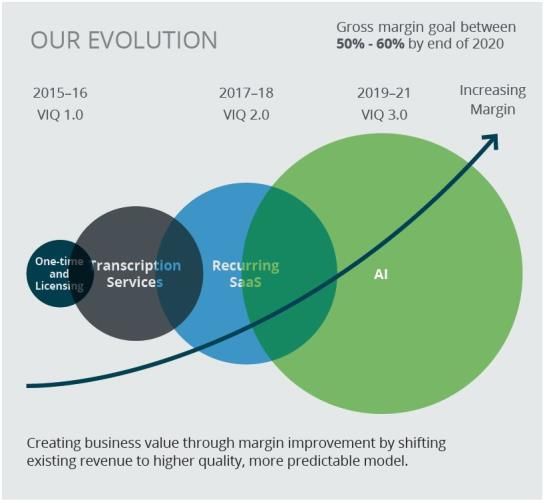
Forward-Looking Statements
This presentation contains “forward-looking statements” or “forward-looking information” within the meaning of applicable securities
laws (collectively, “forward-looking statements”). Forward-looking statements are generally identifiable by use of the words
“believes,” “may,” “plans,” “will,” “anticipates,” “intends,” “budgets,” “could,” “estimates,” “expects,” “forecasts,” “projects” and similar
expressions, and the negative of such expressions. Forward-looking statements in this presentation include statements about
potential acquisition targets; product development and the plans of management; additional product sales opportunities; increased
top line revenue; and extending existing product lines through internal development efforts, strategic business relationships as well
as focused acquisitions.

With respect to the forward-looking statements contained in this presentation, VIQ has made numerous assumptions regarding,
among other things; the ability to complete acquisition transactions; and additional product sales and extending existing product
lines resulting in increased top line revenues. While VIQ considers these assumptions to be reasonable, these assumptions are
inherently subject to significant business, economic, competitive, market and social uncertainties and contingencies. Additionally,
there are known and unknown risk factors which could cause VIQ’s actual results, performance or achievements to be materially
different from any future results, performance or achievements expressed or implied by the forward-looking statements contained
herein. Known risk factors include, among others: there can be no assurance that VIQ will be able to complete any relevant
acquisitions; there can be no assurance that the Company will not require additional financing, as well as the uncertainty as to the
terms and to the availability of future financing; there can be no assurances that the Company can increase or maintain current top
line revenue and gross margin; there can be no assurances that the Company will achieve additional product sales; and there can
be no assurances the Company can extend existing product lines through internal development efforts, strategic business
relationships and focused acquisitions.

A more complete discussion of the risks and uncertainties facing VIQ appears in VIQ’s most recently filed Annual MD&A and other
continuous disclosure filings which are available on SEDAR at www.sedar.com. VIQ disclaims any obligation to revise or update
any such forward-looking statements or to publicly announce the result of any revisions to any of the forward-looking statements
contained herein to reflect future results, events or developments, except as required by law.

                                                                                                                                                1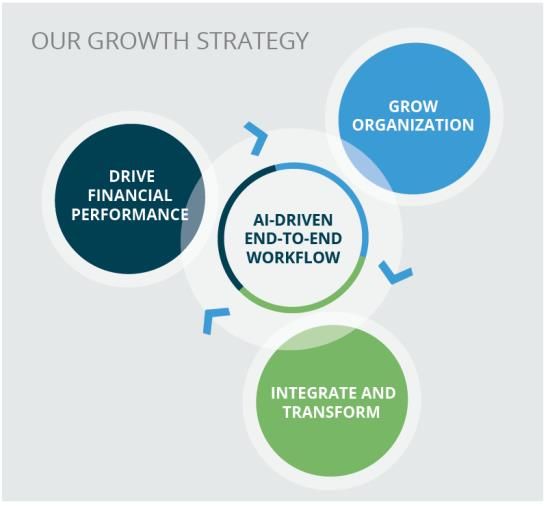
VIQ at a Glance
         Company Highlights                                                    Business Overview

    $19 million USD 9M 2019 revenue            ▪ VIQ is the global market leader in the capture, management and mining of
representing 103% year-over-year growth          sensitive digital evidence information

  Global customer base with over 1,280         ▪ Driving digital transformation within the highly compliant, security-focused
     customers in over 25 countries              and regulated public and private sector markets that we serve

 Captures 400M+ minutes of audio and           ▪ Diversified international company with customers, operations and partners
video through proprietary multi-channel,         distributed throughout the USA (69% by revenue), Australia (24%), EMEA
         multi-speaker software                  and Canada (7%)
 $8.5 billion Total Addressable Market in      ▪ First (and only) to bring artificial intelligence (AI) into end-to-end customer
 U.S. (mostly non-security compliance)
                                                 workflow across the entire capture and transcription value chain to our
Rolling up the industry: 5 industry-leading      target market
 companies acquired; others in progress

Defining and quantifying our sustainable
          goals and measures                                    10%                                                  80%
                                                           AI to Humans                                         AI to Humans
                                                           Collaboration                                        Collaboration

                                                               2019
                                                                                 VIQ’s AI Transcriptionists         2021
                                                                                  Collaborative Platform
                                                        40% Services Margins                                  80% SaaS Margins     2
Investment Highlights
▪   Undervalued, high quality asset in early evolution stage
        ▪    Completed significant investment in patented technology and workflow with AI, SaaS, in a
             cybersecure environment
        ▪    First-mover, dominant player in key verticals, differentiating VIQ from “comparable” or relative
             assets, enabling accretive acquisitions

▪   Attractive financial profile focused on recurring revenue while executing a roll-up strategy
        ▪    Currently in significant growth phase; financial results doubled in size over the past two years
             through both organic and accretive M&A growth
        ▪    Creating value by shifting revenue base to higher quality, more predictable recurring revenue model
             enabling significant margin expansion
        ▪    Three growth categories driving improved margins and strengthening financial performance:
                  1) New clients in transcription & tech
                  2) Increasing transcription volumes and service add-ons for new and existing clients
                  3) Accretive acquisitions

▪   Experienced management team with proven track record
▪   Large Total Addressable Market
        ▪    Global digital transformation addressable market of $655 B where tech and AI investment are
             heading
                                                                                                                   3
Global Geographic Footprint and Diversification
More than 1,280 clients served in over 25 countries
North America
Top 16 International Clients Segmentation of client base
1 U.S. Government
Law Enforcement
2 U.S. Insurance, Fortune 500
3 U.S. Insurance, Fortune 500 40% of client base
4 U.K. Government
5 Canadian Government Judicial & Legal
6 Law Enforcement Australia
35% of client base
EMEA 7 U.S. Police
8 Police Australia Insurance
9 U.S. Courts
10 U.S. Insurance, Fortune 500 25% of client base
11 U.S. Insurance
12 Canadian Government
Australia 13 Scottish Government
14 Australia Lawyers
15 U.S. Police
16 U.S. Bankruptcy Courts
4Competitive Advantage
VIQ is the first and only service provider offering cyber secure end-to-end workflow platform in the cloud to
highly regulated B2B clients – all products proprietary and patented by VIQ
▪ Recording and transcribing
Capture
▪ Capturing video and audio for single or multiple speakers and transferring into military-grade,
cyber secure repository – CJIS compliant
▪ Moving from high labour intensive task to automated AI augmented workflow
▪ Allows for peer collaboration, sharing and distribution
▪ Transforming various media into documents through NetScribeTM
Manage
▪ Augmenting transcriptionists with applied industry specific machine learning with up to 80-90%
accuracy rate
▪ Faster processing time – clearing back log of 3 years in 3 months
▪ As software learns, accuracy increases and human productivity increases
▪ Layering AI tools
Mine
▪ Audio and video ‘Goodness Score’ engines to determine optimum workflow
▪ Multiple voice recognition engines to create draft documents – Single and multiple speakers,
multi-lingual capabilities
▪ Unlocking hidden content – i.e. comparing voices, seeking patterns in data
5Global Digital Transformation Addressable
Market Worth $665 Billion by 2023
▪ Global market size is expected to grow from $290 B in 2018 to $655 B by 2023 at a CAGR of
18.1%
▪ Major drivers include:
▪ digitalizing organizational business functions to serve changing customer preferences and enhance operational efficiency
▪ rapid proliferation of mobile devices and apps
▪ increasing penetration of loT and adoption of cloud services
▪ need to improve operational performance to gain competitive benefits
▪ The artificial intelligence segment projected to grow at the highest CAGR during the forecast
period
▪ The cost-efficient cloud computing segment expected to lead the market and grow at the
highest rate from 2018 to 2023
▪ North America region expected to have the highest amount of growth
Source: MarketsandMarkets research report titled “Digital Transformation Market by Technology (Cloud Computing, Big Data & Analytics, Mobility/Social Media, Cybersecurity, Artificial Intelligence),
Deployment type, Business Function, Vertical (Retail, Education), and Region - Global Forecast to 2023” published April 2019.
6$8.5 Billion U.S. Total Addressable Market
Growing to $10.6 Billion in 2021: Explosion of highly regulated evidentiary content
# of Audio
Average Length # of Transcribed # of Agencies
Industry Vertical Recordable Total Addressable Market
Per Recording Pages Per Year U.S.
Events
Growing to
Law Enforcement
17,985 Agencies $10.6B in 2021
Interrogation,
31M 27 mins. 769M 689,100 Officers
narratives,
statements
$1.0B
Insurance
Interviews, witness 26M 12 mins. 646M 6,000 Companies
statements, claims $3.0B
Judicial $8.5B
4M 4 hours 923M 44,000 Courts
Court reporting $2.1B
Legal $2.4B
150M 10 mins. 1.5B 47,562 Law Firms
Lawyers’ case notes
Law Insurance Judicial Legal Total
Average 72 >100,000 Enforcement
>200 Million >3.8 Billion
Total U.S. Market Minutes per Customers in
Recordings Pages
Recording Market
Source: Calculations based on IBIS World, The Insurance Information Institute and management estimates.
7Core Growth Strategy
Drive Financial Performance Cross-Sell End-to-End Solution Set
▪ Drive quality and quantity of revenues toward recurring aiAssist ▪ Single source for customers’ full capture, management, mining and
revenue model (9M 2019 revenue up 100% over 9M 2018 revenue) transformation needs related to digital content
▪ Transition from 100% manual workflow to 80% AI Collaboration by ▪ VIQ’s proprietary software & best-of-breed from value-added resellers
end of 2021 (10% transition completed year-to-date) ▪ Safely capture and convert large volumes of audio and visual content
▪ Improve margins to drive business value into next generation of documentation and information
REVENUE OVERALL
COST
MARGIN
Capture Manage Mine
Advance Technology Innovation Continue Accretive Acquisitions
▪ Deliver a hybrid AI and human workflow platform where humans ▪ Close and integrate strategic & accretive acquisitions, continuing to
perform QA and improve machine results via machine training roles grow and drive market share and consolidation efficiencies
▪ Deliver better results via market- and customer-specific vocabulary ▪ Engage selected partnerships and JV opportunities for collaboration,
and custom language models innovation and marketing relationships to accelerate growth and
▪ Integrate next level of AI services for Automated Actions via expand global presence
knowledge graph, machine learning and complex analytics
Highly curated and actionable M&A pipeline
8Core Growth Strategy in Early Action
$45 Total Revenue Gross Margin(2) Adjusted EBITDA(3)
$40
Organic
$35
M&A
$30 Growth 44%
$25
$19M 31%
$20
Base
$15 Recurring
$12M Revenue
$10
$5
$1.2M
$0
-$5 -$2.4M
(1) The Company's goal of $37 - $40 million in revenue for 2020 is driven by both organic and inorganic (acquisitions) growth.
(2) The Company expects margins to improve throughout 2019 and 2020 with a goal of reaching 50% - 60% gross margin by the end of 2020.
(3) Adjusted EBITDA (Earnings before Stock-based compensation, Interest, Taxes, Depreciation & amortization) are non-IFRS measures. Please refer to the section entitled “Reconciliation and Definition of Non-IFRS Measures.” 9
(4) Pro forma Adjusted EBITDA was $0.8M, reflecting the impact of the Net Transcripts, Transcription Express and HomeTech acquisitions as though they were completed on January 1, 2018. Standalone adjusted EBITDA was -$2.4M.Goal to Increase Gross Margin to 50%-60% by end of 2020
Gross margin increase driven by client conversion workflow
9M 18 Q2 19 9M 19
Targeting 100%
Targeting of clients by
Number of clients
0 55 720 1,000 clients end of 2020
set up on NetScribe
for 2019 50% - 60%
gross margin goal
Gross Margin 28% 40% 44%
10Comparable Companies
VIQ @ 3.0x Relative Valuation
Enterprise Value / LTM Revenue¹
Transcription Industry Vertical AI-Enabled
Businesses Service Providers Business Services
Average: 2.9x Average: 7.3x Average: 8.6x
11.9x
11.4x
9.9x
9.0x 9.1x
Current VIQ Enterprise Value:
7.7x $63 million USD
Overall Average:
5.4x
5.4x 5.4x
4.1x 4.4x
3.5x
3.0x
1.7x
0.9x
Current Implied(2)
(1) Stock prices as of March 6, 2020.
(2) Based on average market multiple for comparable companies.
11Thank You
Market leader driving
Undervalued, high
digital transformation
quality asset
through AI
We welcome
you to join us
Strong growth
Experienced
strategy strengthening
management team
financial performance
Large total
addressable market 12You can also read