CIBC Fixed Income Conference - April 10, 2019 - Keyera
←
→
Page content transcription
If your browser does not render page correctly, please read the page content below
CIBC Fixed Income Conference

April 10, 2019
Disclaimer

In the interests of providing Keyera Corp. (“Keyera” or the “Company”) shareholders and potential investors with information regarding Keyera,
including Management’s assessment of future plans and operations relating to the Company, this document contains certain statements and
information that are forward-looking statements or information within the meaning of applicable securities legislation, and which are collectively
referred to herein as “forward-looking statements". Forward-looking statements in this document include, but are not limited to statements and
tables with respect to: capital projects and expenditures; strategic initiatives; anticipated producer activity and industry trends; and anticipated
performance. Readers are cautioned not to place undue reliance on forward-looking statements, as there can be no assurance that the plans,
intentions or expectations upon which they are based will occur. By their nature, forward looking statements involve numerous assumptions, as
well as known and unknown risks and uncertainties, both general and specific, that contribute to the possibility that the predictions, forecasts,
projections and other forward-looking statements will not occur and which may cause Keyera’s actual performance and financial results in
future periods to differ materially from any estimates or projections of future performance or results expressed or implied by the forward-looking
statements. These assumptions, risks and uncertainties include, among other things: Keyera’s ability to successfully implement strategic
initiatives and whether such initiatives yield the expected benefits; future operating results; fluctuations in the supply and demand for natural
gas, NGLs, crude oil and iso-octane; assumptions regarding commodity prices; activities of producers, competitors and others; the weather;
assumptions around construction schedules and costs, including the availability and cost of materials and service providers; fluctuations in
currency and interest rates; credit risks; marketing margins; potential disruption or unexpected technical difficulties in developing new facilities
or projects; unexpected cost increases or technical difficulties in constructing or modifying processing facilities; Keyera’s ability to generate
sufficient cash flow from operations to meet its current and future obligations; its ability to access external sources of debt and equity capital;
changes in laws or regulations or the interpretations of such laws or regulations; political and economic conditions; and other risks and
uncertainties described from time to time in the reports and filings made with securities regulatory authorities by Keyera. Readers are
cautioned that the foregoing list of important factors is not exhaustive. The forward-looking statements contained in this document are made as
of the date of this document or the dates specifically referenced herein. For additional information please refer to Keyera’s public filings
available on SEDAR at www.sedar.com. All forward-looking statements contained in this document are expressly qualified by this cautionary
statement.

                                                                                                                                                 2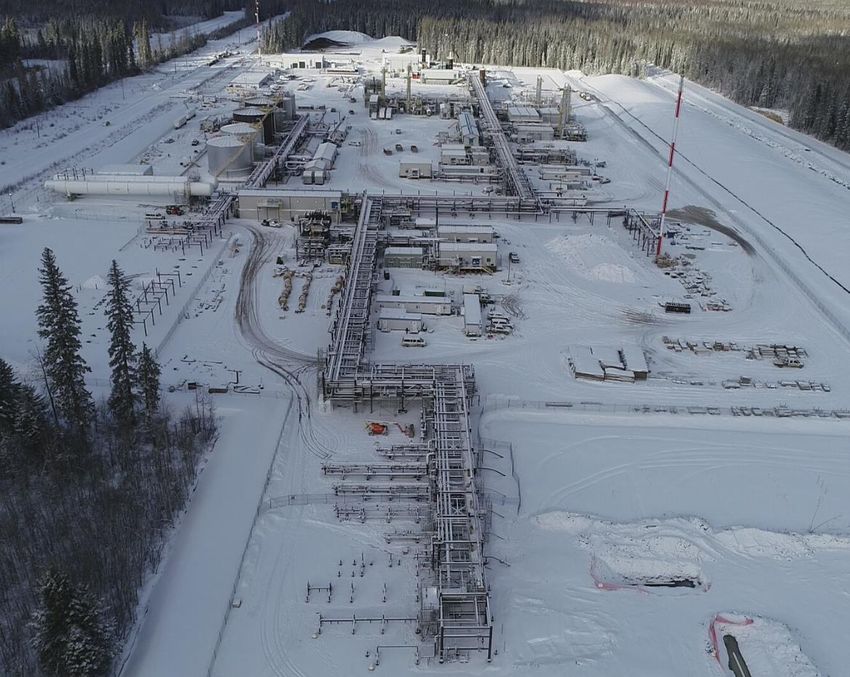
Keyera Representatives

Steven Kroeker
 •   Senior Vice President & Chief Financial Officer

Eileen Marikar
 •   Vice President, Finance

Avery Reiter
 •   Director, Treasury
                                                       KFS Frac and Storage

                                                                              3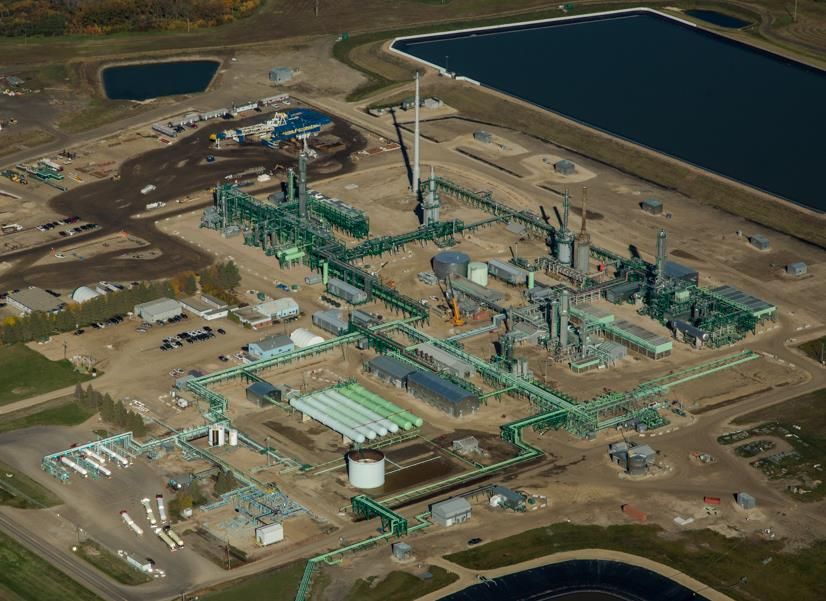
Keyera at a Glance1

                                                  Key Metrics

Market Capitalization2                                                   ~$6.6 billion

Enterprise Value2                                                        ~$8.8 billion

2018 Adjusted EBITDA                                                     $807 million

2018 Payout Ratio                                                            56%

Dividend                                                  $1.80/share p.a. ($0.15/share per month)

Dividend Yield2                                                            ~5.71%

Corporate Credit Ratings3                                                BBB/Stable

Net Debt/EBITDA                                                              2.6x

2019 Growth Capital Program                                            $800-$900 million

1. All information as at December 31, 2018, unless otherwise stated.
2. As at March 31, 2019.
3. DBRS and S&P.

             One of Canada’s largest midstream companies                                             4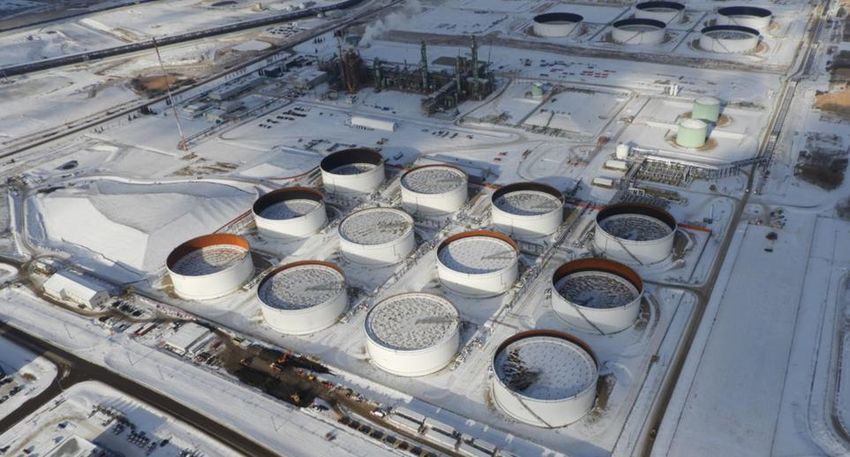
2018 Record Year even in a Challenging Environment

                                 Record Financial Performance                                                                                                                 Operational Milestones

Adjusted EBITDA1,2                           Distributable Cash Flow2                                        Net Earnings                                    Record volumes
    ($ Millions)                                    ($ per share)                                             ($ Millions)                                              •     Simonette Gas Plant
                                                                                                                                                                        •     Ft Saskatchewan Fractionator
               $807                                                                                                                                                     •     Condensate system
                                                                          $3.08                                                  $394
                                                      $2.70
                                                                                                                                                                        •     Marketing services
   $617
                                                                                                              $290
                                                                                                                                                             Invested ~$1.3B in 2018

   2017         2018                                    2017               2018                                2017               2018

          1. Adjusted EBITDA is defined as earnings before interest, taxes, depreciation, amortization, accretion, impairment expenses, unrealized gains/losses and any other non-cash items such as
          gains/losses on the disposal of property, plant and equipment.
          2. See section of the MD&A in Keyera’s 2018 Year End Report titled “EBITDA” for a reconciliation of Adjusted EBITDA and “Divdends: Distributable Cash Flow” for a reconciliation of distributable cash   5
          flow respectively, for their most closely related GAAP measures.
Integrated Value Chain

1. Percentage of total realized margin for the year ended December 31st 2018 (2017 - 80%). Realized margin is defined as operating margin excluding unrealized gains and losses from risk management
contracts from the Marketing segment. Realized margin is not a standard measure under GAAP.
                                                                                                                                                                                                       6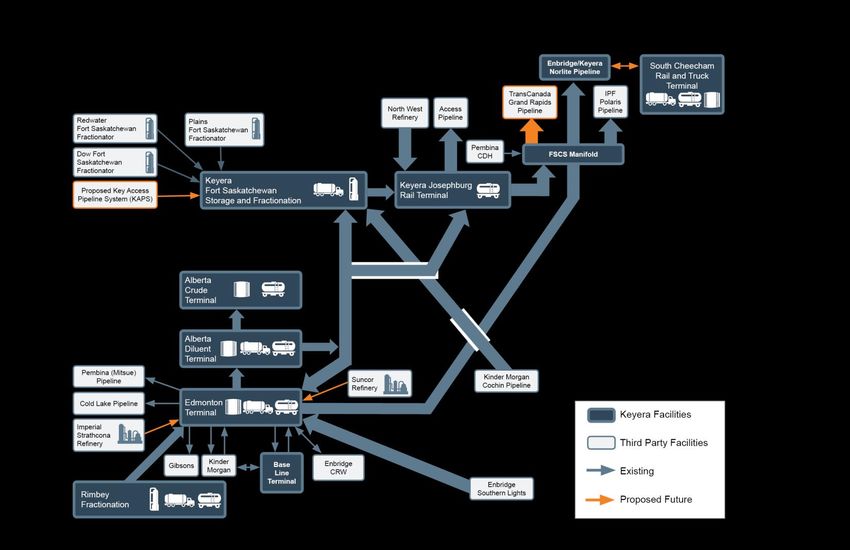
Realized Margin by Segment

                                                                               Realized Margin ($ millions)
• Keyera’s Gathering and Processing and                                                                2016      2017   2018
  Liquids Infrastructure businesses are   Fee-for-Service Segments1                                    $536      $556   $598
  predominately fee-for-service           Marketing                                                    $137      $128   $296
                                          Other2                                                        $11      $14    $13
• Marketing segment had an excellent      Total                                                        $684      $698   $907
  2018, resulting in a lower fee-for-
                                                  Segment Realized Margin as a % of Total Realized Margin
  service proportion of realized margin
                                                                                                       2016      2017   2018

• Keyera’s Marketing business is backed   Fee-for-Service Segments1                                    78%       80%    66%

  by ownership in assets                  Marketing                                                    20%       18%    33%
                                          Other2                                                        2%       2%     1%
                                          Total                                                       100%       100%   100%

                                          * All figures represent last twelve month results as of December 31.

                                          1. Includes intersegment transactions.

                                          2. “Other” includes production segment.

                                                                                                                         7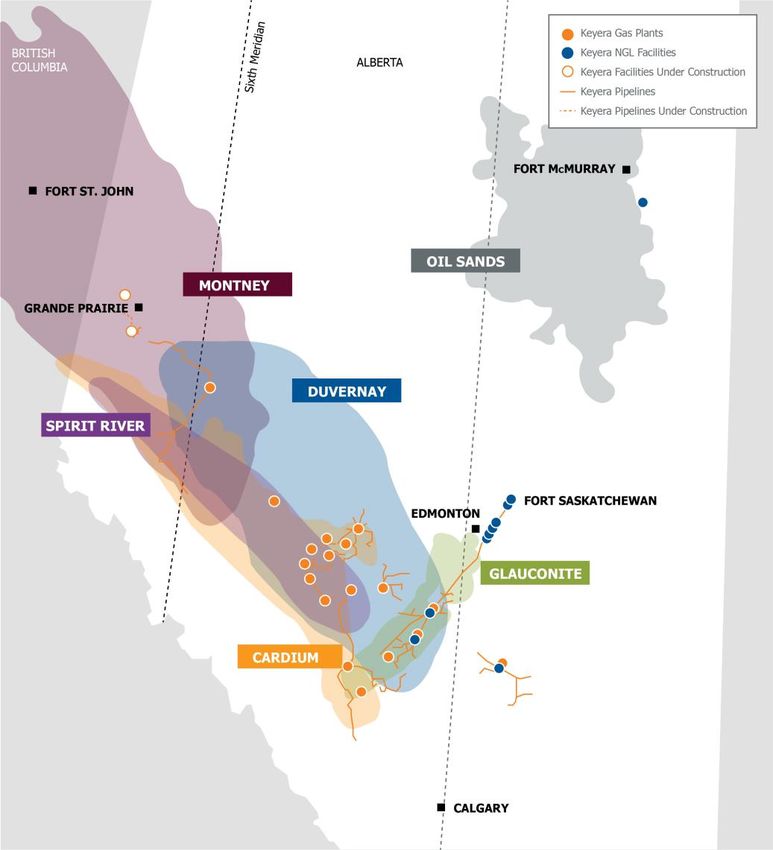
Solid Contractual Foundation
 •   Keyera’s current cash flows are well supported by fee-for-service contracts, including take-or-pay
     contracts

 •   Adjusted EBITDA from Keyera’s current ~$2.1 billion capital program will be supported by a
     combination of fee-for-service, take-or-pay and area dedication agreements

           2018 Realized Margin                               Take-or-Pay Revenue as a % of
                                                                  2018 Adjusted EBITDA
               1%

                                Fee-for-Service
                                                                                        Take-or-Pay
     33%
                                Marketing                                  43%
                                                              57%
                 66%                                                                    Non Take-or-Pay
                                Other

                                                                                                          8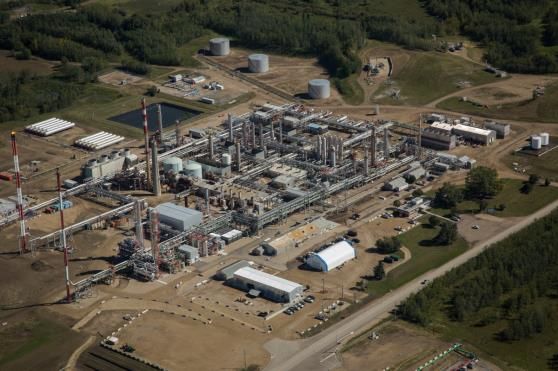
Low Counterparty Credit Risk

                                                                                                          Consolidated1,2,3                                                          Gathering and Processing
•   Keyera provides essential
    infrastructure and marketing services
    to industry                                                                               18%                                      Investment                                                                    Investment
                                                                                                                                       Grade/Secured                                                                 Grade/Secured
                                                                                                                                                                                                      30%

•   ~82% of Keyera’s total revenue in                                                   13%                                            Split                                                                         Split

    2018 came from investment                                                                                    69%
                                                                                                                                                                              59%
                                                                                                                                                                                                      11%
                                                                                                                                       Non-IG                                                                        Non-IG
    grade/secured or split rated
    counterparties

•   Credit risk management strategies                                                                Liquids Infrastructure                                                                          Marketing
    include: letters of credit, netting
    agreements, pre-payments                                                                1%
                                                                                                    7%                                                                                                               Investment
                                                                                                                                       Investment                                    14%
                                                                                                                                       Grade/Secured                                                                 Grade/Secured
•   Broad domestic and international
                                                                                                                                                                              14%                                    Split
    customer base                                                                                                                      Split

                                                                                                                                                                                                     72%             Non-IG
                                                                                                                                       Non-IG
                                                                                                           93%

           1. Based on 2018 revenues.
           2. Counterparty ratings are representative of the counterparties’ rating as of March 15 th, 2019. Where parental guarantees are in place, the credit rating of the parent is used. The secured category
           includes counterparties who are on prepay terms or have posted a letter of credit.                                                                                                                        9
           3. Split denotes counterparties with an investment grade rating by one rating agency and non-investment grade rating by another agency.
Investment Opportunities Continue
Millions                                                        ANNUAL CAPITAL EXPENDITURES
$1,400

$1,200

$1,000

  $800

  $600

  $400

  $200

      $-                                                                                                                                                                   2
                                                                                                                                               1
                    12/31/13                    12/31/14                    12/31/15                    12/31/16                    12/31/17                    12/31/18              12/31/19e

                                          Growth Capital            Upper End of Growth Capital Range                    Acquisitions          Maintenance Capital

1. Acquisition capital in 2017 reflects the $55 million purchase price for undeveloped land in the Industrial Heartland of Alberta completed in 1Q17, among other actual YTD costs.
2. Keyera’s 50% acquisition of the South Grand Rapids pipeline is included in 2018 Acquisitions.

$800 – $900 Million of Growth Capital Investment in 2019                                                                                                                                          10
Growth Projects Currently Under Development
Approved Projects Capital Cost 2018 2019 2020
(Net, in $ Millions)1
Wapiti Area Gathering & Processing Complex (Phase I) 575
Wapiti Gas Plant (Phase II) & North Wapiti Pipeline System 325
Wapiti Water Disposal System 100
Simonette Inlet & Acid Gas Injection Enhancements 100
Simonette Plant Expansion 85
Pipestone Plant (Phase I) 2 600
Wildhorse Terminal US185
Storage Cavern Development Program at Keyera Fort Saskatchewan 110
TOTAL ~$2.1 Billion
1. Keyera’s share of estimated capital cost. See Keyera’s 2018 Year End MD&A for capital investment risks and assumptions. 2. Pipestone plant expected to start up in 2021. 3. Return on Capital is defined
as operating margin divided by the estimated capital cost of the projects noted on this slide. Keyera expects to achieve this return, in 2022 once all projects achieve their annual run rate. See “non-GAAP
Financial Measure” and “Forward-Looking Statements” in Keyera’s 2018 Year End MD&A for further details.
$2.1B Program expected to achieve 10-15% return on capital3 11Gathering and Processing Business Unit
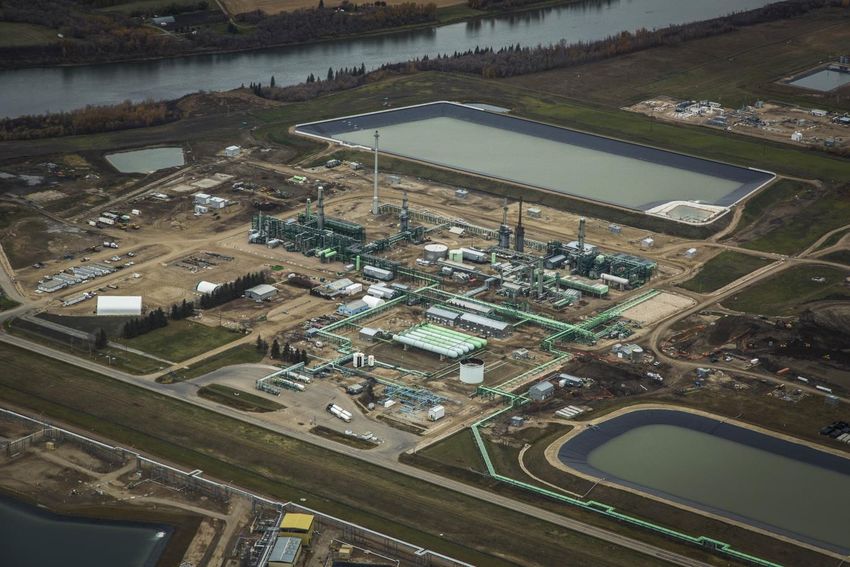
Wapiti
Plant
12Growing Presence in Liquids-Rich Area of NW Alberta
Gross Sour Gas Processing Capacity (Year End) Condensate Handling Capacity (Year End)
1000 100,000
900 90,000
200
800 80,000
700 70,000 38,000
bbls/d
mmcf/d
600 300 300 60,000 14,000 14,000
500 150 950 50,000 90,000
400
mmcf/d 40,000 25,000 25,000 25,000 b/d
14,000
300 30,000
200 450 450 450 20,000
300 300 27,000 27,000 27,000 27,000
100 10,000
10,000
0 -
2017 2018 2019 2020 2021 2017 2018 2019 2020 2021
Simonette Wapiti Pipestone Simonette Wapiti Pipestone
Supporting Producer Growth Plans in Liquids-Rich Developments 13Relatively Stable Throughput
H I S T O R I C A L T H R O U G H P U T & T H E P E R C E N T AG E C H A N G E I N AE C O & W T I T O D e c e m b e r 3 1 , 2 0 1 8
14Liquids Business Unit Unmatched Infrastructure for NGL and Oil Sands Customers 15
Fractionation at Multiple Locations

         Gilby Gas Plant                                                                                                                      Nevis Gas Plant
 3,650 bbls/d gross (2,930 bbls/d net)                                                                                              3,740 bbls/d of C3+ fractionation capacity
     of C3+ fractionation capacity

        Rimbey Gas Plant                                                                                                                 Dow Fort Saskatchewan
28,000 bbls/d gross (27,640 bbls/d net)                               Keyera Fort Saskatchewan                                        30,000 bbls/d gross (5,420 bbls/d net)
     of C3+ fractionation capacity                                                                                                        of C3+ fractionation capacity
20,000 bbls/d gross (19,740 bbls/d net)   65,200 bbls/d gross (50,000 bbls/d net) of   30,000 bbls/d gross (23,010 bbls/d net) of     69,200 bbls/d gross (6,920 bbls/d net)
      of de-ethanization capacity                C3+ fractionation capacity                    de-ethanization capacity                    of de-ethanization capacity

              Adding Value by Processing NGLs from the Gas Stream                                                                                         16
Oil Sands Production Continues to Grow
Bitumen Production Growing Diluent Demand > Condensate Supply
3,000 1,000
900
2,500
800
700
2,000
MBbl/d
600
MBbl/d
1,500 500
400
1,000
300
200
500
100
0 0
2010 2011 2012 2013 2014 2015 2016 2017 2018 2019 2020 2021 2022 2023 2024 2025 2018A 2019E 2020E 2021E 2022E 2023E 2024E 2025E
Actual CIBC World Markets Forecast WCSB Supply Forecast Demand
Source: Estimates as per CIBC World Markets.
Bitumen Production Growth Driving Condensate Demand 17Extensive, Flexible Condensate Infrastructure
• Most connected condensate hub in Western Canada
• Major oil sands delivery options:
– Polaris – Access – Grand Rapids
– Norlite – FSPL – South Cheecham
• Supply through multiple receipt points:
• Local fractionators and refineries
• Kinder Morgan Cochin pipeline
• Enbridge Southern Lights pipeline and CRW pool
• Western Canada feeder pipelines
• Canadian Diluent Hub
• Rail imports at the Alberta Diluent Terminal
• Storage at Keyera Fort Saskatchewan – Imperial Oil (Kearl) – Cenovus (Christina Lake)
– Husky/BP (Sunrise) – CNRL (Kirby, Primrose)
• Long-term take-or-pay and fee-for-service agreements: – Suncor/Teck/Total (Fort Hills) – JACOS/Nexen (Hangingstone)
– North West Upgrading – Devon (Jackfish)
Industry-Leading Diluent Handling Services 18Crude Oil Storage
Baseline
Tank
Terminal
Wildhorse
Terminal
Expanding and Diversifying Keyera’s Service Offering 19Marketing Services
• Facilities based marketing
Condensate
C5+
• Prudent risk-management hedging • Keyera’s C5+ hub creates industry liquidity
• Consumed in Alberta as diluent for bitumen
strategy • Significant imports required today to meet
demand
Butane
C4
• Sourced and consumed in Alberta Ethane
• Feedstock for iso-octane production at
C2
• Sold under long-term agreements to
Alberta EnviroFuels
petrochemical producers in Alberta
• Seasonal imports from the U.S.
• Limited spot market in western Canada
• Produced at three Keyera facilities
Propane
Iso-octane
C3
•
iC8
Supply exceeds demand in North America
• Majority of sales in the U.S. • Majority sold into U.S. markets
• High quality gasoline additive • Demand and pricing vary seasonally
• Produced from butane at Keyera’s • Keyera uses its storage and logistics to
Alberta EnviroFuels facility access markets
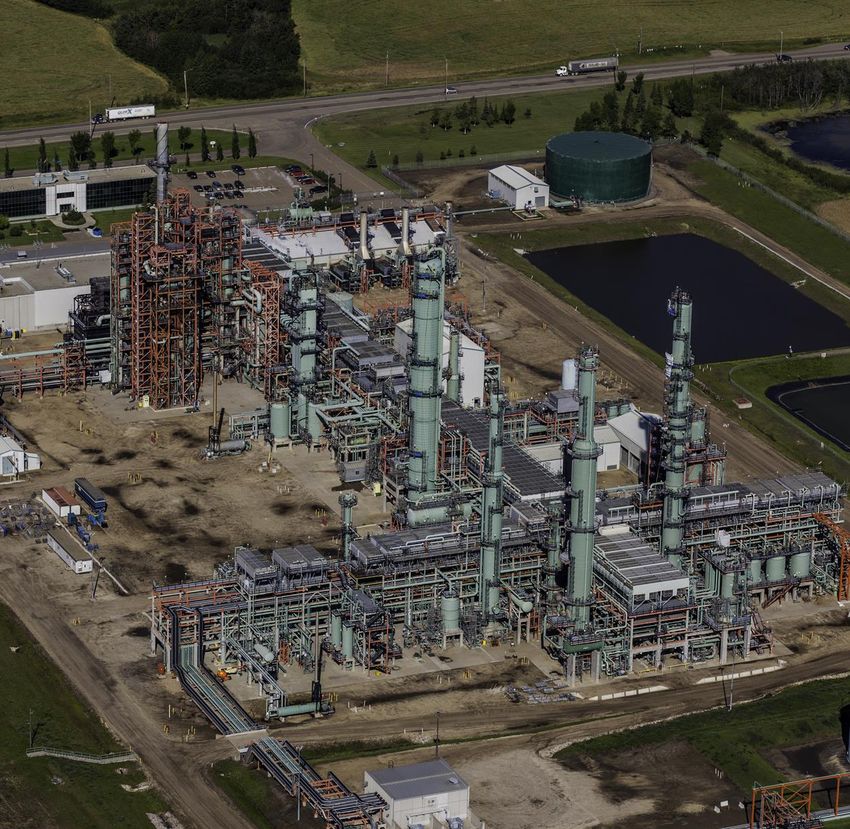
Diversified Portfolio of Logistics Services 20Alberta EnviroFuels (AEF)
• Iso-octane (iC8) is a high octane, low vapour pressure
gasoline additive
• Butane is the NGL feedstock
• Only merchant iC8 facility in North America
• Licensed capacity of 13,600 bbls/d
• Supply networks and distribution infrastructure used to
source feedstock while rail logistics broaden sales markets
• Financial forward markets enable hedging of feedstock costs
and large portion of iC8 margin
• iC8 demand driven by premium gasoline demand
• Seasonality is complementary to propane and butane
iC8 is a Premium Value-Added Product Produced in Alberta 21Conservative Capital Structure
LONG-TERM DEBT MATURITIES2 (excludes drawings under revolver)
Issuer Credit Ratings:
• DBRS Limited: BBB with a Stable trend
2.6x • S&P Global: BBB/Stable
Net Debt1 to
EBITDA
1. Calculated as of December 31, 2018 in accordance with Keyera’s debt covenants. For further information regarding covenant calculations, please see
Keyera’s 2018 Year End Report MD&A or copies of the note purchase agreements, all of which are filed on SEDAR.
2. All US dollar denominated debt is translated into Canadian dollars at its swap rate. 2019 maturities as of February 1, 2019.
Well Positioned to Fund Keyera’s $2.1 Billion Capital Program 22You can also read