INTERIM RESULTS PRESENTATION 30 JUNE 2021 - Mpact
←
→
Page content transcription
If your browser does not render page correctly, please read the page content below
INTERIM RESULTS
   PRESENTATION
FOR THE SIX MONTHS ENDED
       30 JUNE 2021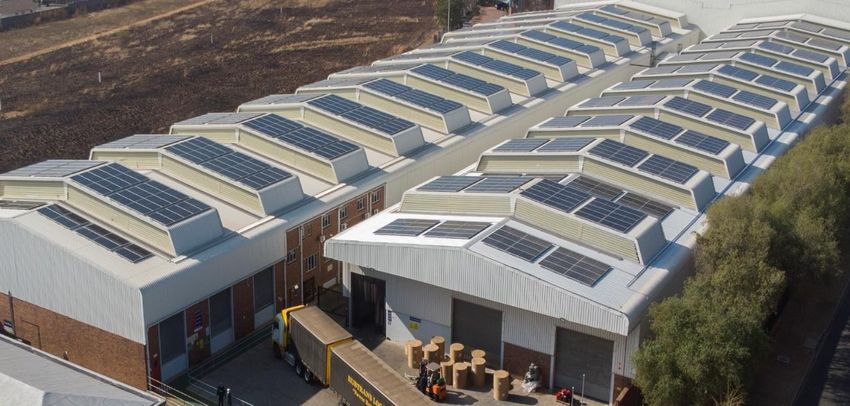
01
Half-year 2021 in context
Investing for the future
Financial review
Operating review
Financial performance
Outlook

                            2
Resilience anchored in our purpose of:

• Making a difference
• Providing our customers with sustainable packaging; and
• Giving effect to the circular economy through our integrated business model

                Vision
                At Mpact, our vision is to be a leading business
                with the highest ethical standards, delivering
                exceptional value for our customers, employees,
                communities and shareholders.

                                                                                3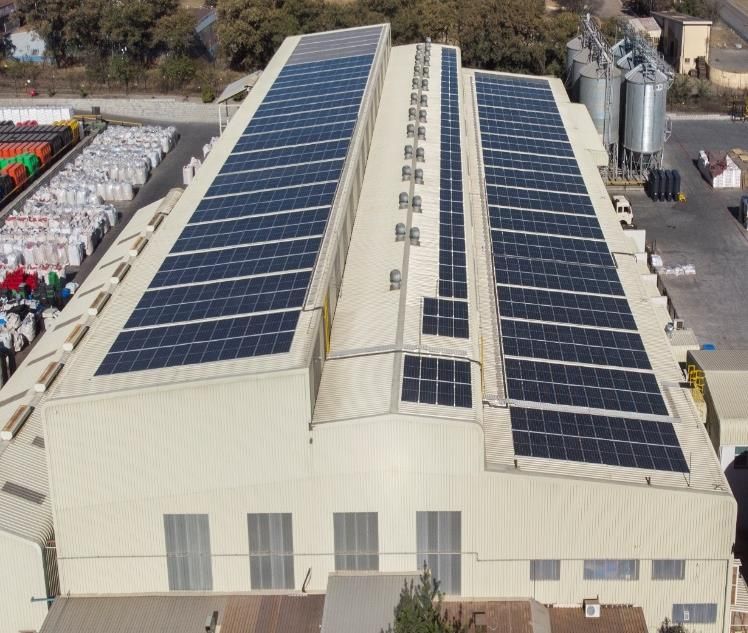
Living by our values

At Mpact we are differentiated by our people who are:

Resolute
• Setting and achieving challenging targets
• Continuously identifying innovative ways to do things
• Accountable especially in the face of adversity

    Trustworthy
     • Ethical
     • Transparent
     • Honouring commitments

            Responsible
           • Taking care of their safety, health and personal development as well as that of their colleagues
           • Striving to meet or exceed our customers’ requirements (internal and external) for product quality,
             excellent service and cost competitiveness
           • Treating our natural resources with care and sensitivity
           • Doing what it takes to ethically deliver good sustainable returns to our shareholders
                                                                                                                   4
Delivering on our strategy …

 Customer focus                                    Leading market positions                         Focus on performance
 Decentralised structure                           Scale                                            Financial returns
 •   Customer-centric                              • Develop and maintain leading market            • ROCE and profitable growth
 •
 •
           Customers
     Responsive
     Accountable
                                                              Being the
                                                     positions with scale to enable
                                                     competetiveness at a decentralised level
                                                                                                             Making a
                                                                                                    • Disciplined capital allocation based on
                                                                                                      track record
 •
 •
     Flexible
              first
     Effectively execute differing strategies or
                                                                     best
                                                   • May consider entry below leading market
                                                                                                               decent
                                                                                                    • Stringent cost management
                                                                                                    • Long-term view of investments
                                                                                                    • Effective risk management and
     even hybrids across business units
                                                            at iswhatpotential to we
                                                     position but always considering sectors
                                                     where there                  lead in future.     governanceprofit
 Innovation and capability
 • Applied to products and processes,
                                                   Capability          do                                    decently
                                                                                                    Skilled and motivated people
   internally and externally                       • Invest in sectors where Mpact has              • Invest in support of management with a
 • Use of own R&D capabilities where                 sustainable competitive advantages or at         track record
   feasible                                          least the prospect of developing them          • Reward performance and appreciate effort
 • Investing to meet new and emerging                                                               • Proactive staff training and development
   demands of customers with good returns          Products and geographies                         • Safety
                                                   • Rigid plastics and paper-based
 Intimate understanding of the Value Chain                                                          Sustainable practices
                                                     packaging in sub-Saharan Africa.
 • Engage customers and other stakeholders                                                          • Responsible environmental management
   to improve supply chain efficiency and          Grow through prudent investment and              • Contributing to social upliftment where we
   anticipate changing requirements                effective use of assets to provide customers       operate
 • Product specification bodies, marketing         leading products and services worth their        • Rigorously pursue the highest ethical
   and branding people, key distribution           price.                                             standards
   networks
 • Make partnerships work

                                                                                                                                                   5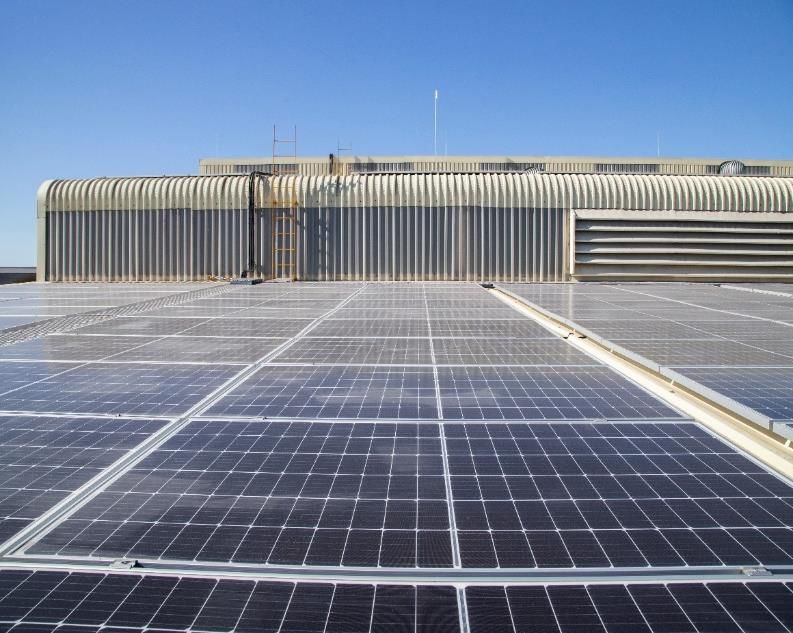
Half-year 2021 in context
▪ Good financial performance and implementation of strategy
     ▪ Earnings recovered above pre-pandemic levels; ROCE of 15.6%
     ▪ Gearing down to 27.6% with net debt of R1.47bn
         ▪ R257 million returned to shareholders January 2021 through share buyback. (R345m in total since September 2020)
         ▪ EPS enhancement from total share buyback of approximately 10%
     ▪ Strong demand across most sectors
     ▪ Improved margins
         ▪ Increased sales volumes, operational efficiencies and a favourable mix more than offset higher raw material costs
     ▪ Working capital well managed at 15.4% of revenue
     ▪ Maintained B-BBEE Level 1 rating

▪ Significant supply chain constraints across all sectors impacting cost and inventories
     ▪ Recovered paper, containerboard, plastic polymers, process chemicals

▪ Limited impact of Covid-19 on business continuity during the period
     ▪ Protocols well entrenched. Safety and health of employees and contractors remains paramount

▪ Investments of over R500m approved to support future growth, innovation and sustainability
                                                                                                                               6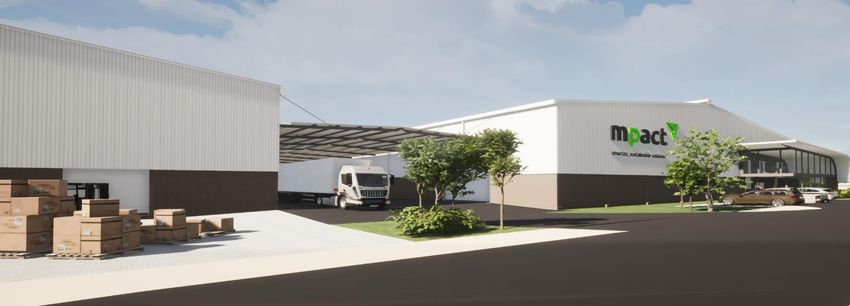
02
Half-year 2021 in context
Investing for the future
Financial review
Operating review
Financial performance
Outlook

                            7
New injection moulding factory
Mpact Plastic Containers, Castleview
 • Purpose: Expansion of
   capabilities to meet customer
   requirements and extend
   innovative product offering,
   including food grade production
   facility and automated warehouse

 • Scope: Property acquisition
   (Mpact Polymers site); setup
   manufacturing facility and
   warehouse; install new and
   relocated machines

 • Investment: R178 million, phases
   1&2

 • Planned completion: Q4 2022

 • Products: Plastic bins and crates,
   (16k tons p.a. at full capacity)

                                        8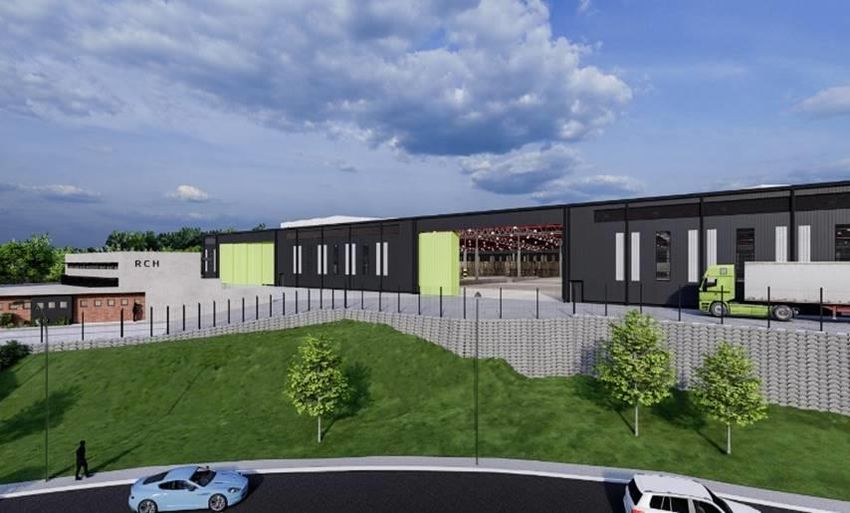
New recycling facility
Mpact Plastic Containers, Brits
 • Purpose: Closing the loop by
   increasing end-of-life buyback
   arrangements with bin and crate
   customers and offering increased
   recycled content in new products;
   free up space in existing operation
   for injection moulding machines

 • Scope: Acquisition and
   development of new property
   (10 000m²); relocation of existing
   recycling line, expansion to double
   recycling capacity of used bins,
   crates and other products

 • Investment: R30 million

 • Planned completion: Q1, 2022

 • Products: Recycled polyolefin
   pellets for use in production of new
   bins and crates, (6k tons p.a. with
   scope for future expansion)

                                          9
Other notable investments
Paper Converting
 • Purpose: Expansion of capabilities
   to meet customer requirements and
   extend innovative product and
   service offering

 • Scope:
   • 2 New rotary die cutter lines,
     Corrugated Western Cape and
     Mpumalanga
   • New paper bag machine, Detpak
   • New customer services centre,
     Limpopo (3,500m²)

 • Investment: R165 million

 • Planned completion: Q2, 2022

 • Products: Corrugated boxes and
   paper bags for fruit and other
   sectors, extended in-field customer
   service offering

                                         10
New recycling and export handling facility
Mpact Recycling, KZN
• Purpose: Closing the loop and
reducing costs by increasing
collection and processing of
recyclables closer to Mpact’s paper
mills; replace facilities currently
leased for recycling and handling of
the Group’s exports and imports
(currently outsourced)
• Scope: Acquisition and
development of new property
(17 000m² under roof); installation
of new and relocated equipment
• Investment: R150 million
• Planned completion: Q2, 2022
• Products: Baled recyclables for
Mpact’s paper mills and to trade;
export/ import warehouse and
handling capability
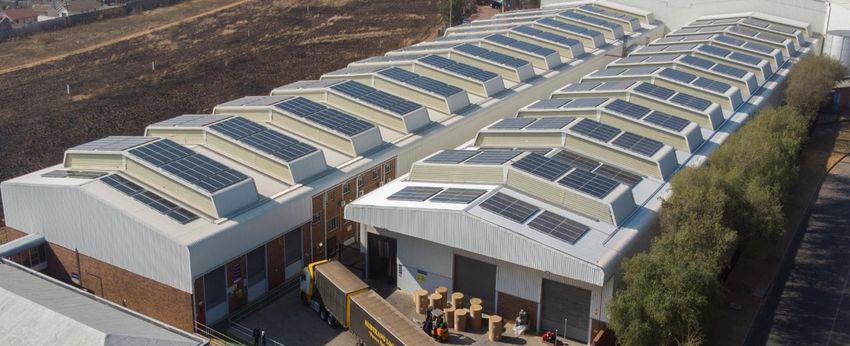
11Mpact Renewable Energy
• Purpose: Sustainable energy
generation, security of supply and
cost saving
• Scope: Installation of 6.5MWp Complete or in progress Recently approved for completion
solar PV and inverters, including
2021/2022
roof modifications and compatibility
with other energy backup. Brings Capacity Capacity
Location Location
total solar PV capacity to 10.6MWp MWp MWp
Paarl phase 1 0.7 Atlantis 0.6
• Investment: R54 million Wadeville 1.1 Ethekwini 0.2
• Planned completion: Q3, 2022 Roodekop 0.7 Castleview 1.4
Brits 0.3 Felixton 3.0
• Other benefits: Reduction of Aeroton 0.5 Gqeberha 0.8
13,700 ton CO2e Scope 2 Springs 0.7 Paarl phase 2 0.5
emissions; investigating next phase
of solar PV expansion Sub Total 4.1 Sub Total 6.5
12Detpak - Solar Panels
13Mpact Plastic Containers Brits - Solar Panels
14Investing for the future: Mpact e-Learning Academy
1503
Half-year 2021 in
context
Investing for the future
Financial review
Operating review
Financial performance
Outlook
16Financial review
Group revenue
12,000 11 076 11 097
▪ Revenue up 16.3% to R5.9bn
10,000 ▪ Sales volumes up 13.2%
8,000 5,944 6,035
▪ Gross profit of R2.1bn up 18.2%
R million
6,000
4,000
▪ Favourable sales mix, higher average prices
▪ Stable containerboard costs
5,132 5,062 5,887
2,000
0
2019 2020 2021
▪ Prior year write-down of plastic regrind raw material not
HY1 HY2 repeated
Underlying EBIT ▪ Underlying EBIT up 165% to R337m
800 724 ▪ Higher gross profit, fixed cost well contained
631
600
▪ Net insurance proceeds of R25m
▪ Net debt of R1.47bn (June 2020: R1.9bn)
469
R million
400 5.7%
5.0% 504 ▪ Gearing reduced to 27.6% (June 2020: 34.8%)
200
255
2.5% 337 ▪ Underlying EPS of 121 cents (June 2020: 9 cents)
127
0 ▪ ROCE of 15.6% (June 2020: 9.4%)
2019 2020 2021
HY1 HY2 HY1 margin
1704
Half-year 2021 in
context
Investing for the future
Financial review
Operating review
Financial performance
Outlook
18Paper business
Segment revenue
▪ Revenue up 15.8% to R4.6bn
10,000
8 727 8 665
▪ External sales volumes up 12.7%
8,000
4,649 4,659
▪ Containerboard and cartonboard up 10.1%
R million
6,000
with favourable mix
4,000
4,639
▪ Paper converting up 9.2%
2,000 4,078 4,006
▪ Strong recovery across most sectors
0
2019
HY1
2020
HY2
2021 ▪ Gross profit up 17%
▪ Favourable sales mix
Underlying EBIT
▪ Underlying operating profit up 89% to R347m
800
716 ▪ Improved trading, operational efficiencies and
600
578 well managed costs
420
▪ Net insurance proceeds of R25m
R million
400 7.3% 7.5%
394
4.6%
200 347
296
184
0
2019 2020 2021
HY1 HY2 HY1 margin
19Plastics business
Segment revenue
3,000
2 468 ▪ Revenue up 18.3% to R1.3bn
2,500 2 386
2,000 ▪ Good recovery in volumes across all
R million
1,310 1,397
1,500 business, up 19%
1,000 ▪ Gross profit up 23%
1,076 1,071 1,267
500
0
▪ Under recovery of higher polymer costs
2019 2020 2021 offset by prior period stock write-down
HY1 HY2
▪ Underlying operating profit of R35m (June
2020: loss of R18m)
Underlying EBIT
150 119
▪ Good improvement in most businesses
▪ Preform & closure volumes still sub-optimal
100
▪ EBIT margin of 2.8%
R million
137
50
83
35
0 -18
-50
2019 2020 2021
HY1 HY2
2005
Half-year 2021 in context
Investing for the future
Financial review
Operating review
Financial performance
Outlook
21Variable costs
+15.3% Benchmark recovered paper prices (OCC)
240
4,000 3 797
200
(June 2019 = 100)
3 295 426 11%
3,500
160
Index
3,000 385 492 13%
436 424 23% 120
2,500
344
R million
663 24%
2,000 80
534 Jun-19 Jun-20 Jun-21
1,500 ZAR US$
1,000 12% Benchmark polymer prices
1,596 1,792
500
140
(June 2019 = 100)
Index(ZAR)
0
HY1 2020 HY1 2021
Paper business raw materials 100
Plastic raw materials
Energy
Selling & distribution costs
60
▪ Higher recovered paper, polymer, coal and electricity price Jun-19 Jun-20 Jun-21
increases
P1 P2 P3
▪ Energy costs also reflect increased production at Springs Mill
following 2020 power outages Source: Mpact
Notes:
1. Paper business raw materials include purchased paper, wood, pulp and recovered paper
2. Plastic raw materials include styrene, PET, HDPE, PVC and polypropylene and post consumer PET bottles
3. Other variable costs include chemicals and packaging costs
22Fixed costs
▪ Controllable fixed costs well managed
▪ Personnel costs up 4% on comparative basis
6.8%
2,000 ▪ 8% increase attributable to Covid effects
1 753 in HY1 2020
1 641
258 4%
▪ Salary sacrifice
1,500 269
▪ TERS payments
505 4%
▪ Low bonus provision
R million
485
1,000
▪ Net operating expenses up 4%
11.5%
500
887 990 ▪ Higher maintenance costs offset by lower
bad debt provisions and net insurance
0 proceed of R25m
HY1 2020 HY1 2021
Depreciation and amortisation
Maintenance and net operating expenses
Personnel costs
23Financial review
change
HY1 2020
R million HY1 2021 HY1 2020 FY 2020 vs HY1
2021
Underlying operating profit 337 127 631 165%
Net finance costs (68) (95) (169) 28.4%
Profit from equity accounted investees, impairment
1 (7) 10 >100%
charge
Underlying profit before tax 270 25 472 >100%
Tax charge (75) (7) (87) >100%
Non-controlling interests (15) (3) (45) >100%
Underlying earnings 180 15 340 >100%
Special items, net of tax - - (20) -
Basic earnings 180 15 320 >100%
Underlying earnings per share (cps) 120.8 9.0 200.6 >100%
24ROCE and net debt
20%
Return on Capital Employed
(ROCE)¹
15.6% ▪ Strong improvement in ROCE to 15.6%
15%
(June 2020: 9.4%)
11.4%
▪ Increase in underlying EBIT and
ROCE %
9.4%
10%
lower capital employed
5%
0%
2020 2021
HY1 Full Year
Net debt² ▪ Net debt closed at R1.465 billion
2,500
2,000
1,938 ▪ Strong cash flows generated from
operations
R millions
1,408 1,465
1,500
1,000 ▪ Working capital well managed
500 ▪ Significant share buyback during the period
0
2020 2021
▪ Gearing improved to 27.6% (June 2020:
HY1 Full year 34.8%)
1. Return on Capital Employed (ROCE) is an annualised measure based on underlying operating profit plus share of equity accounted investees’ net earnings divided
by average capital employed
2. Net debt includes lease liabilities of R303m
25Net finance cost and net debt
change
HY1 2020
R’million HY1 2021 HY1 2020 FY 2020
vs HY1
2021
Net debt – close 1,465 1,938 1,408 (24.4%)
Net debt – average 1,763 2,349 2,074 (25.0%)
Net finance cost 68 95 169 (28.3%)
Gearing 27.6% 34.8% 26.6% (7.2)
Interest cover (underlying EBIT) (times) 5.0 1.3 3.7
Net debt to EBITDA (times) 1.1 1.7 1.2
26Trade working capital
Trade working capital % of revenue
2,500
▪ Trade working capital lower than H1
2,000 2020 by R249m to 15.4% of revenue
20.4%
▪ Good focus on all aspects
▪ Lower inventory levels partly due to
1,500
R million
supply constraints
15.4%
▪ Expect increase in working capital as
1,000 2,067 inventory levels normalise
1,818
500
0
HY1 2020 HY1 2021
27Movement in net debt¹
1,000
592
500
0
(31) (41)
(70)
(257)
R million
(250)
-500
-1,000
-1,500 (1 408) (1 465)
-2,000
Net debt at 31 Cash from Capital Interest paid Income tax paid Share buyback Other items Net debt at 30
December 2020 operations incl. expenditure June 2021
working capital
outflow of R11m
1. Includes lease liabilities of R303m
28Taxation
change
HY1 2020
R million HY1 2021 HY1 2020 FY 2020 vs HY1
2021
Taxation charge 75 7 87 >100%
Effective tax rate 27.9% 28.6% 18.4% (0.7)
Tax paid 31 20 71 55.0%
▪ Tax rate expected to normalise to approximately 28%
▪ S12I and S12L incentives no longer available
▪ Full utilisation of recognised assessed loss by year-end
▪ Lower effective rate in FY2020 of 18.4% due to incentives for capital investment and energy
(S12I and S12L)
29Capital expenditure cash flows
400
357
350
300
▪ Investments of over R500m approved in growth,
194 250 innovation and sustainability projects
250
45
R million
200
▪ Corporate capital expenditure comprises of mainly
property acquisitions for Group operations
161
81
150 20
46
35
100
117 124
50 106
0
HY1 2020 HY2 2020 HY1 2021
Paper Plastics Corporate
30Dividends and share buybacks
R257 million returned to shareholders during the period through share buyback, 1.4x earnings
300
257
200
160
R million
136 125
88
100 95
89
48
72
47 47
0
2017 2018 2019 2020 HY1 2021
Cash dividend Scrip dividend Share buyback
Shares Number of Value Average price
▪ R345 million returned to shareholders over past 12 months buyback shares Rm Rand per
share
through share buyback, 14.5% of shares in issue
▪ EPS enhancement of circa 10% HY2 2020 9,716,002 88 9.01
▪ No interim dividend declared
▪ Board committed to returning cash to shareholders in future HY1 2021 15,413,152 257 16.68
through dividends, share buybacks or combination thereof
Total 25,129,154 345 13.71
Total shares in issue at 30 June 2021: 148,175,363
3106
Half-year 2021 in context
Investing for the future
Financial review
Operating review
Financial performance
Outlook
32Outlook
▪ Strong demand experienced in first half is expected to continue across most businesses but may be partially
offset by:
▪ Effects of unrest and other uncertainties
▪ Supply chain constraints across most sectors
▪ Margins expected to improve as raw material cost increases are recovered in selling prices
▪ Impact of unrest in July
▪ Decisive actions from management and staff at affected operations
▪ No injuries to employees and no damage to Mpact assets
▪ All KZN operations closed for up to 8 days
▪ Lost gross profit due to reduced production of approximately R20m
▪ Other Group operations uninterrupted but effect on sales still uncertain
▪ Gross profit effect of lost sales in July 2021 approximately R20m. May be partially recovered by year-end
▪ Covid-19 third wave - limited impact on business continuity due to well entrenched protocols
▪ Robust strategy and experienced management team
▪ Good growth prospects from committed capital investments
▪ Working capital remains a key focus
▪ Strong balance sheet and sufficient funding
33Thank you
You can also read