MI COVID response Data and modeling update - June 30, 2021 NOTE: all data as of June 29 unless otherwise noted - State of ...
←
→
Page content transcription
If your browser does not render page correctly, please read the page content below
MI COVID response
Data and modeling update
June 30, 2021

NOTE: all data as of June 29 unless otherwise noted
Draft and pre-decisional
Note: lower national rankings are more favorable

Executive summary
Percent Positivity is steady, and Case Rate is down 27% since last week. Positivity (1.3%, ↔) and case rates 13.1,
↓3.9) have declined or plateaued for eleven weeks

 Michigan has the 33rd lowest number of cases (↑3), and 8th lowest case rate (↑5) in the last 7 days (source: CDC
 COVID Data Tracker)

Percent of inpatient beds occupied by individuals with COVID has decreased 14% since last week and is
decreasing for nine weeks. There are 1.7% (↓0.3%) inpatient beds occupied by COVID-19 patients.

 Michigan has the 12th lowest inpatient bed utilization (↑13), and the 14th lowest adult ICU bed utilization (↑9) in
 the country (source: US HHS Protect)

Deaths have decreased 40% since last week. There were 65 COVID deaths between Jun 16 and June 22, and the
Death Rate is 0.9 deaths per million residents (↓0.4)

 Michigan has the 6th highest number of deaths (↔), and 10th highest death rate (↓2) in the last 7 days (source:
 CDC COVID Data Tracker)

The 7-day average state testing rate has decreased to 1,255.3 tests/million/day. Daily diagnostic tests (PCR) is 12.4K
per day, and the weekly average for PCR and antigen tests conducted in Michigan is 24.9K.

9.4 million COVID-19 vaccine doses reported to CDC, 4.693 million people have completed their vaccine series
 2
Agenda Status of COVID-19 Epidemiological Risk State-by-state comparison of epidemic spread Michigan epidemic spread Public health response Science round-up 3
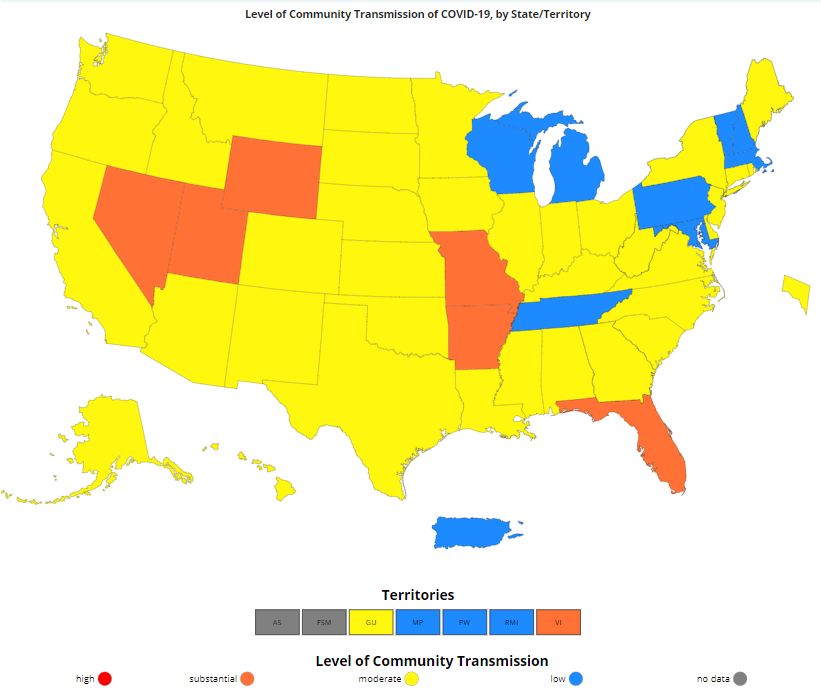
Global and National Comparisons
What we see today (data through 6/29):
• Globally, 181,533,728 cases and 3,932,077 deaths
• Countries with the highest number of cases are U.S. (33,642,146), India (30,316,897), and Brazil (18,448,402)
• Within the U.S., California (3,712,795), Texas (2,984,640), & Florida (2,321,929) lead the nation in total cases
• CDC Data tracker currently lists Michigan, along with 13 other states and territories, at low transmission level
• Michigan currently has identified 13,485 variants of concern (VOC)
 – Cumulatively, the vast majority are B.1.1.7 (12,753 which is 94%).
 • Other VOCs include B.1.351 (.6%), B.1.427 & B.1.429 (2.3%), P.1 (2.2%) and B.1.617.2(0.4%)
 – In the 4 most recent weeks,
 • 93.6% of specimens were Alpha (B.1.1.7)
 • 0.5% were Beta (B.1.351)
 • 0.5% were Epsilon (B.1.427, B.1.429)
 • 3.6% were Gamma (P.1) (↑)
 • 1.9% were Delta (B.1.617.2) (↑)

 Public Health Other Science
 National Comparison Spread
 Response Indicators Round-up

 4
Status of COVID-19 Epidemiological Risk State-by-state comparison of epidemic spread Michigan epidemic spread Public health response Other public health indicators Science round-up Appendix 5
Key Messages: COVID-19 Spread Statewide positivity has plateaued to 1.3% • Steady from last week (vs. 31% decrease last week) • Early indicators are a suggestion we may be progressing out of exponential decline into a low incidence plateau • Decreasing for eleven weeks (93% decrease since April 8 high) • Positivity is declining in all MERC regions, and is below 2% in all regions Case rate (13.1 cases/million) is decreasing across the state (last week: 17.0 cases/million) • One week decrease of 27% (vs. 39% decrease last week) • Decreasing for over two months (98% decrease since mid-April high) • Cases per million are declining in all MERC regions • Select variants in Michigan: 12,753 confirmed Alpha (B.1.1.7); 76 confirmed Beta (B.1.351); 307 confirmed Epsilon (B.1.427/ B.1.429); 294 confirmed Gamma (P.1); and 52 confirmed Delta (B.1.617.2) Number of active outbreaks is down 42% from last week Reported school outbreaks have decreased 64% since last week (50 to 18) First week in over a year where no new outbreaks were identified in K-12 settings Public Health Other Science National Comparison Spread Response Indicators Round-up
Confirmed and probable case indicators Risk levels
Table Date: 6/29/2021 (7 days from date table was produced: 6/22/2021) Low A B C D E

 Cases Positivity

 National Public Health Other Science
 Spread 7
 Comparison Response Indicators Round-up
Overview of metrics for individuals
Comparing CDC community transmission thresholds to MI levels
Case Rate*†
 Low A B C D E
MI*
Adjusted* CDC Transmission Levels, 6/22-6/29
 Transmission # of counties This week
This Week, 6/22-6/29
 Last week
 Levels
 Last week, 6/15-6/21 Low 59
 45
 Moderate 24
 37
 Substantial 0
 1
 High 0
 0

 Updates since last week:
 45 of 83 counties met low transmission level
 this week, a 14 county increase
 24 of 83 counties met moderate
 transmission classification, a 13 county
 decrease from last week
 No counties met substantial transmission
 classification, 1 county decrease from last
 week
*Source: SEOC Testing Results – Excluding MDOC; MDSS – Cases by onset date incorporating 7-day reporting lag; CDC Levels of Community Transmission are described at https://covid.cdc.gov/covid-data-tracker/#county-view

 Public Health Other Science
National Comparison Spread 10
 Response Indicators Round-up
Age group: average new daily cases
Daily new confirmed and probable cases per million by age group (7-day rolling average)
 1000
 0-9 30-39 60-69
 10-19 40-49 70-79
 20-29 50-59 80+
 750

 500

 250

 0
 3/1 4/1 5/1 6/1 7/1 8/1 9/1 10/1 11/1 12/1 1/1 2/1 3/1 4/1 5/1 6/1

• Case rates for all age groups by decade are decreasing
• Case rates for all age groups are between 7 and 20 cases per million
 Note: Case information sourced from MDHHS and reflects date of onset of symptoms
 Source: MDHHS – Michigan Disease Surveillance System

 Public Health Other Science
 National Comparison Spread 11
 Response Indicators Round-up
Age group: average new daily cases and daily case rate
Daily new confirmed and probable cases per million by age group (7-day rolling average)
 Age Average Average One Week % Change since • Avg. daily number of cases (31) and
 Group daily cases Daily Case % Change (Δ #) 4/11/21* (Δ #) avg. daily case rate (19.5 cases/mil) are
 Rate currently highest for 30-39 and 20-29,
 0-9 14.9 7.4 -44% (-7) -97% (-430) respectively
 10-19 21.7 12.5 -30% (-7) -99% (-1,221) • Case rates for all age groups are
 20-29 30.0 19.5 -16% (-1-5) -98% (-1,234) between 7 and 20 cases per million
 30-39 31.1 17.8 -35% (-12) -98% (-1,069) • Since April 11, case rates have
 decreased more than 95% for all age
 40-49 21.3 13.1 -33% (-8) -98% (-961)
 groups, with state overall down 98%
 50-59 19.4 14.1 -8% (-1-5) -98% (-892)
 60-69 16.4 10.7 -19% (-1-5) -97% (-527)
 70-79 8.3 7.3 -36% (-1-5) -97% (-200)
 80+ 6.0 11.4 -25% (-1-5) -95% (-86)
 * Highest 7-day avg. following spring 2021 surge
 Total¶ 131.7 13.1 -27% (-48) -98% (-6,659) ¶ Total may not reflect state due to missing age data

 Note: Case information sourced from MDHHS and reflects date of onset of symptoms
 Source: MDHHS – Michigan Disease Surveillance System

 Public Health Other Science
National Comparison Spread 12
 Response Indicators Round-up
Average daily new cases per million people by race and ethnicity
 Daily new confirmed and probable cases per million Daily new confirmed and probable cases per
 (7 day rolling average) by race category million (7 day rolling average) by ethnicity category
 American Indian/Alaska Native Black/African American Hispanic or Latino Not Hispanic or Latino
 Asian/Pacific Islander White Race Case Rate
 50
 50
 Race Case Rate
 American Indian/ 17.1
 Alaskan Native 40 Hispanic/Latino 19.8
 40 Asian/Pacific 4.7 Non-Hispanic 9.7
 Islander

 Black/African 14.7
 30
 30 American

 White 8.7 20
 20

 10
 10

 0
 0 5/31 6/5 6/10 6/15 6/20 6/25
 5/31 6/5 6/10 6/15 6/20 6/25
Updates since last week:
• Cases per million are decreasing for all races and ethnicities
• American Indians/Alaskan Natives, Blacks/African Americans, and Hispanic/Latinos have the highest case rates
• In the past 30 days, 15% (↔) of race data and 20% (↑1%) ethnicity data was either missing or reported as unknown

Note: Case information sourced from MDHHS and reflects date of death of confirmed and probable cases. 30-day timeframe provided to display current differences in rates by race and ethnicity
Source: MDHHS – Michigan Disease Surveillance System

 Public Health Other Science
National Comparison Spread 13
 Response Indicators Round-up
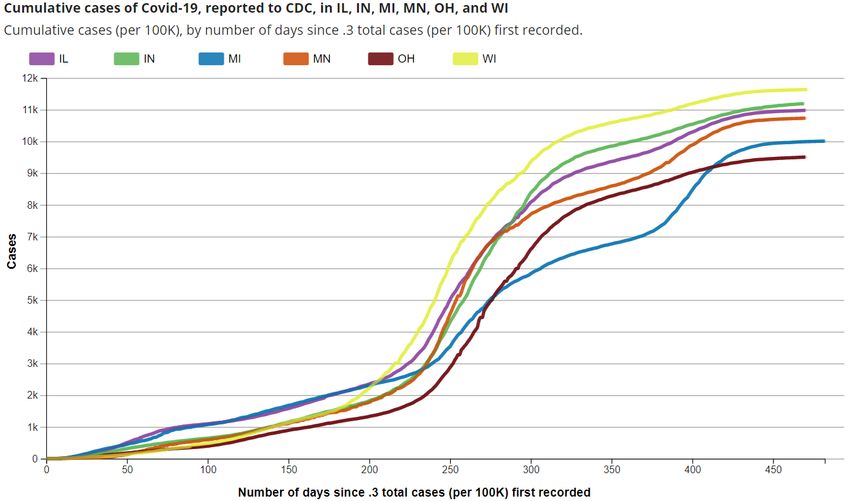
Cumulative COVID-19 Case Rates: Midwest Comparison

 Michigan

• Cumulative incidence per 100,000 cases in Michigan has been lower than other states in the Midwest following spring 2020 surge
• Michigan’s mitigation policies helped control the spread of SARS-CoV-2 relative to other states in the Midwest, particular during surge in
 November and December
• The current trajectory in Michigan has brought us into the range of cumulative case rates of our Midwest neighbors
 14
Source: CDC COVID Data Tracker – State Trend Comparison
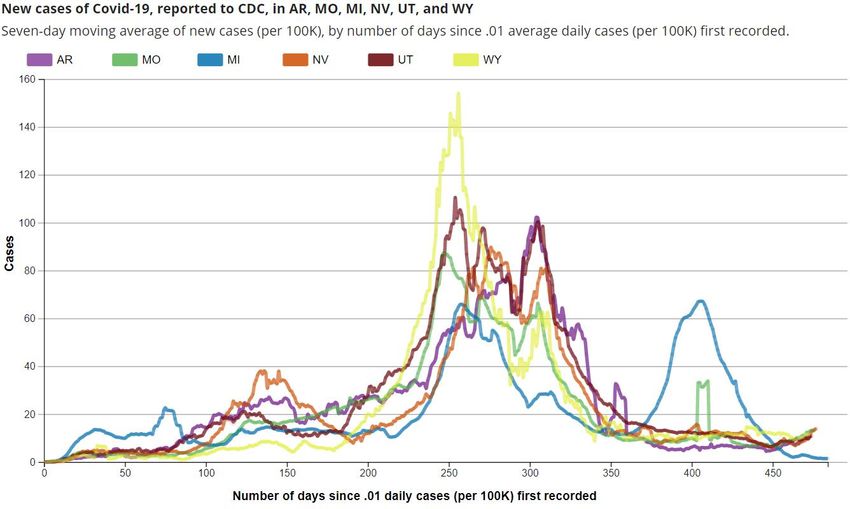
Cumulative COVID-19 Case Rates: States with high Delta Comparison

 Michigan

• Average daily incidence per 100,000 cases in Michigan is currently lower than other states experiencing a surge in delta cases
• Currently, states with delta surges may have lower daily incidence than winter surge but their trajectory indicates increasing case trends
 (red circle)
• Internationally, delta has led to large surges in countries like the UK (more on this in science round-up)
 15
Source: CDC COVID Data Tracker – State Trend Comparison
Variants, transmissibility, severity, and vaccine effectiveness
 Strain New WHO Transmissibility Immune Invasiveness Increased Vaccine effective at
 nomenclature Severity disease reduction?

 Ancestral - - - ✓

 B.1.1.7 Alpha ~50% increased transmission Increased ✓
 - hospitalizations and
 death

 B.1.351 Beta ~50% increased transmission Reduced susceptibility to ✓
 antibody treatment -

 P.1 Gamma Reduced susceptibility to ✓
 - antibody treatment -

 B.1.427/B.1.429 Epsilon ~20% increased Modest decrease in susceptibility ✓
 transmissibility to monoclonal antibody treatment -

 B.1.617.2 Delta > 50% increased Reduced susceptibility to Increased ✓
 transmission antibody treatment hospitalizations and
 death

 Source: CDC https://www.cdc.gov/coronavirus/2019-ncov/variants/variant-info.html?CDC_AA_refVal=https%3A%2F%2Fwww.cdc.gov%2Fcoronavirus%2F2019-ncov%2Fcases-updates%2Fvariant-
 surveillance%2Fvariant-info.html World Health Organization, accessed June 8, 2021. https://www.who.int/en/activities/tracking-SARS-CoV-2-variants/

Certain mono-clonal antibody therapies are less effective in presence of some variants. Due to national increase in
P.1 and B.1.315 variant infections, HHS has paused distribution of bamlanivimab and etesevimab together and
etesevimab alone until further notice. FDA recommends health care providers use REGEN-COV.

 Public Health Other Science
 National Comparison Spread 16
 Response Indicators Round-up
Identified COVID-19 Cases Caused by All Variants of Concern (VOC)
 in US and Michigan
 SARS-CoV-2 Variants Circulating in the Variants of Concern in Michigan, Jun 29
 United States, May 23 – Jun 5

 678 cases in Wayne attributed to Detroit

 Variant MI Reported Cases¶ # of Counties CDC est. prevalence
 B.1.1.7 (alpha) 12,753* 81 77.3%
 B.1.351 (beta) 76 23 0.5%
 B.1.427/B.1.429 (epsilon) 307 45 1.5%
 P.1 (gamma) 294 33 6.5%
Data last updated June 29, 2021 B.1.617.2 (delta) 52 15 1.0%
Source: https://covid.cdc.gov/covid-data-tracker/#variant-proportions and MDSS
 * 533 cases within MDOC; ¶ 153 cases with county not yet determined
 Public Health Other Science
 National Comparison Spread
 Response Indicators Round-up
Trends of all Variants of Concern (VOC) in Michigan: Delta Increasing
• The figure on the right shows the
 proportion of specimens
 sequenced by lineage in Michigan
 • The inverse bar chart at the very
 bottom shows the total samples
 sequenced each day
• Two VOC lineages are
 highlighted: alpha variant
 (B.1.1.7) shown in dark blue, and
 delta variant (B.1.617.2) depicted
 in dark orange
• In early 2021, alpha quickly
 became the predominate strain
 sequenced in Michigan
• In the past 21 days, delta
 variant is overtaking alpha and
 accounts for 14% of all
 specimens sequenced

 *Source: Trends in at www.outbreak.info and https://outbreak.info/location-reports?loc=USA_US-MI&selected=B.1.1.7&selected=B.1.617.2

 Public Health Other Science
 National Comparison Spread
 Response Indicators Round-up
Number of outbreak investigations by site type, week ending Jun 24
 Visibility1 Easier to identify outbreak
 Site type Outbreaks by ongoing/new classification, # Harder to identify outbreak
 Ongoing New Total
 SNF/LTC/OTHER ASSISTED LIVING 38 1 39 Total number of active
 MANUFACTURING, CONSTRUCTION 27 2 29 outbreaks is down 38% from
 K-12 SCHOOL 18 0 18 previous week
 *RETAIL 4 1 5
 CORRECTIONS 50 5 Two new outbreaks were
 *SOCIAL GATHERING 2 2 4
 reported in each of the
 COLLEGE/UNIVERSITY 40 4
 following settings:
 CHILDCARE/YOUTH PROGRAM 3 1 4
 manufacturing/construction,
 HEALTHCARE 30 3
 social gatherings, agriculture/
 *RESTAURANTS AND BARS 30 3
 AGRICULTURAL/FOOD PROCESSING 1 2 3 food processing, and offices.
 OFFICE SETTING 1 2 3
 *RELIGIOUS SERVICES 20 2 One new outbreak was
 OTHER 10 1 reported in LTCF/SNF, retail,
 *COMMUNITY EXPOSURE - OUTDOOR 0 0 0 and childcare/youth programs.
 *COMMUNITY EXPOSURE - INDOOR 0 0 0
 *PERSONAL SERVICES 0 0 0
 *SHELTERS 0 0 0
 TOTAL 112 11 123

1. Based on a setting’s level of control and the extent of time patrons/residents spend in the particular setting, different settings have differing levels of ability to ascertain whether a case derived from that setting

NOTE: Many factors, including the lack of ability to conduct effective contact tracing in certain settings, may result in significant underreporting of outbreaks. This chart does not provide a complete picture of
outbreaks in Michigan and the absence of identified outbreaks in a particular setting in no way provides evidence that, in fact, that setting is not having outbreaks.

Source: LHD Weekly Sitreps

 Public Health Other Science
 National Comparison Spread 19
 Response Indicators Round-up
Note: presentation of this slide will be paused
 until schools reopen in fall

K-12 school outbreaks, week ending Jun 24
Number of reported outbreaks decreased since last week (50 to 18) including decreases in High Schools (28 to 10), Middle/Jr High (8 to 2),
Pre K-Elementary (12 to 5), and Administrative (2 to 1). Number of Range of cases
Region Number of reported cases, # # Ongoing - Excluding New # New outbreaks per outbreak
 Region 1 35 0 4 3-17
 Region 2n 4 0 2 2-2
 Region 2s 6 0 2 3-3
 Region 3 146 0 6 4-67
 Region 5 30 0 3 2-23
 Region 6 6 0 1 6-6
 Region 7 0 0 0 0
 Region 8 0 0 0 0
 Total 227 0 18 2-67

 Number of Range of cases
Grade level Number of reported cases, # # Ongoing - Excluding New # New outbreaks per outbreak
Pre-school - elem. 57 0 5 2-23
Jr. high/middle school 4 0 2 2-2
High school 163 0 10 3-67
Administrative 3 0 1 3-3
Total 227 0 18 2-67
Many factors, including the lack of ability to conduct effective contact tracing in certain settings, may result in significant underreporting of outbreaks. This chart does not provide a complete picture Source: LHD Weekly Sitreps
of outbreaks in Michigan and the absence of identified outbreaks in a particular setting in no way provides evidence that, in fact, that setting is not having outbreaks.

 Public Health Other Science
National Comparison Spread 20
 Response Indicators Round-up
Key Messages: COVID-19 and Healthcare Capacity and COVID Severity Hospitalizations and ICU utilization are decreasing COVID-like illness (CLI) has fallen to 0.3% (vs. 0.4% last week) Hospital admissions are decreasing statewide and for most age groups Hospitalizations down 15% since last week (vs. 33% decline week prior) Most regions are showing decreases or stable trends in hospitalization trends this week Volume of COVID-19 patients in intensive care has decreased 26% since last week (vs. 34% decline week prior) Death rate has decreased to 0.9 daily deaths per million people 40% decrease since last week (vs. 44% decrease last week) 88% decrease since April 24 peak Proportion of deaths among those under 60 years of age slightly declined from the prior week Public Health Other Science National Comparison Spread Response Indicators Round-up
Michigan Trends in Emergency Department Visits for COVID-19-Like
Illness (CLI)

 0.3%

 Source: https://covid.cdc.gov/covid-data-tracker/#ed-visits

 Public Health Other Science
National Comparison Spread
 Response Indicators Round-up
Average Hospital Admissions by Age

 25

 20

 15

 10

 5

 0

 Peds 18 - 19 20 - 29 30 - 39 40 - 49 50 - 59 60 - 69 70 - 79 80+ Age
 Unkn
 Source: CHECC & EM Resource
• Trends for daily average hospital admissions have decreased 12% since last week
• Trends within most age groups are decreasing
• Over the past week, those 60-69 years have seen the highest number of avg. daily hospital admissions (>7 admissions)

 Public Health Other Science
 National Comparison Spread 23
 Response Indicators Round-up
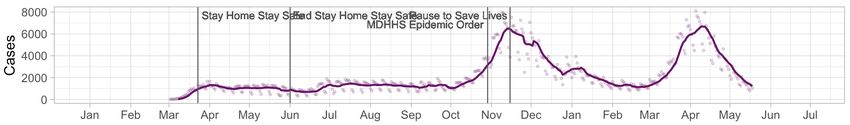
Statewide Hospitalization Trends: Total COVID+ Census
 Hospitalization Trends 3/1/2021 – 6/29/2021 COVID+ census in hospitals continues to
 Confirmed Positive & Persons Under Investigation (PUI) decline from the April 19th peak although at
 a slower pace. This week is down 15% from
 the previous week (previous week was
 down 33%).

 Confirmed Positive Hospitalizations are now below the
 minimum point of summer 2020.

 Hospitalized COVID Positive Long Term
 Trend (beginning March 2020)

 PUI

 24
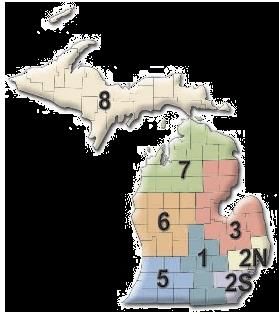
Statewide Hospitalization Trends: Regional COVID+ Census
 Most regions show generally decreasing or flat
 Hospitalization Trends 3/1/2021 – 6/29/2021
 trends. UP (Region 8) has very low absolute
 Confirmed Positive by Region
 numbers hospitalized and thus small changes
 result in large percent increases.
 Region 1
 Region 2N
 Region 2S All regions are now below 50/M hospitalized.
 Region 3
 Region 5
 Region 6
 Region 7 Region COVID+ COVID+
 Region 8 Hospitalizations (% Δ Hospitalizations
 from last week) / MM
 Region 1 19 (-44%) 18/M
 Region 2N 50 (6%) 23/M
 Region 2S 104 (-13%) 47/M
 Region 3 16 (-30%) 14/M
 Region 5 26 (-19%) 27/M
 Region 6 52 (-5%) 35/M
 Region 7 5 (-50%) 10/M
 Region 8 3 (50%) 10/M

 25
Statewide Hospitalization Trends: ICU COVID+ Census
 Overall, the census of COVID+ patients in ICUs has
 Hospitalization Trends 3/1/2021 – 6/29/2021 decreased 26% from last week, with all regions
 Confirmed Positive in ICUs showing decreasing ICU census except Region 5
 which is essentially flat given small number
 hospitalized.

 All regions have
Average and total new deaths, by age group
 Daily confirmed and probable deaths per million by Total confirmed and probable deaths by age group
 age group (7 day rolling average) (past 30 days, ending 6/22/2021)

 0-19 40-49 70-79 • 23% of deaths below age
 20-29 50-59 80+ sixty
 30-39 60-69 Total
 50 164 153
 140
 40

 30 86

 20

 10 21
 20
 1-5 1-5
 0
 4/1 4/15 4/29 5/13 5/27 6/10 6/24 0-19 20-29 30-39 40-49 50-59 60-69 70-79 80+

• Overall trends for daily average deaths have decreased 40% since last week
• Through 6/22, the 7-day avg. death rate is below 1.5 daily deaths per million people for those under the age of 60
Note: Death information sourced from MDHHS and reflects date of death of confirmed and probable cases.
Source: MDHHS – Michigan Disease Surveillance System

 Public Health Other Science
 National Comparison Spread 27
 Response Indicators Round-up
30-day rolling average daily deaths per million people by race and
ethnicity
 Average daily deaths per million people by race Average daily deaths per million people by
 ethnicity
 American Indian/Alaska Native Black/African American 12 Hispanic or Latino Not Hispanic or Latino
 Asian/Pacific Islander White
 12

 8
 8

 4
 4

 0 0
 4/1 4/15 4/29 5/13 5/27 6/10 6/24 4/1 4/15 4/29 5/13 5/27 6/10 6/24

Updates since last week:
• All racial and ethnic groups are seeing a decrease in COVID deaths
• Blacks/African Americans have the most reported deaths per capita
• Deaths are not adjusted for confounders (e.g., age, sex, comorbidities)
 Note: Death information sourced from MDHHS and reflects date of death of confirmed and probable cases.
 Source: MDHHS – Michigan Disease Surveillance System

 Public Health Other Science
National Comparison Spread 28
 Response Indicators Round-up
• `

 COVID-19 Vaccination
 Administration (doses administered)
 9th state in doses delivered, first doses provided and number of completed individuals (6/28/21)
 81.2% adjusted administration ratio (excluding federal entities, CDC channel portfolio 6/25/2021)
 84,452 doses last week: most frequently by pharmacies, local health departments, and hospitals (MCIR data only, will be
 undercount of all doses administered)

 Coverage (people vaccinated)
 62.4% of those 18+ have received first dose of vaccine
 4,693,169 people in Michigan have completed vaccination series (4,608,073 last week)
 84.7% of people aged 65 or older have had first dose; 62.4% of people over age 18
 Initiation highest among Asian, Native Hawaiian or Pacific Islander and American Indian/Alaskan Native individuals (MI Covid
 Vaccine Dashboard 6/28/21)
 Less than 1% of Vaccinated Individuals Later Tested Positive for COVID-19 (Number of cases who are fully vaccinated (n= 7,135 )

 Public Health Other Science
National Comparison Spread
 Response Indicators Round-up
• `

 Doses Administered as of 6/28/21

 11,588,390 doses delivered to providers in Michigan
 9.4M doses Administered (CDC tracker)

 81.2% adjusted administration ratio (excluding federal entities, CDC channel portfolio 6/25/2021)
 • 84K doses administered last week; on average 12K/day (4900-16K)

 June 20-26th (inclusive), doses were most frequently administered by
 - Pharmacies (138K) (MCIR data may undercount)
 - LHD (29K) and hospitals (19K)
 - Pediatricians (5.8K), family practice (5.6K), and FQHCs (3.9K)
 Public Health Other Science
National Comparison Spread
 Response Indicators Round-up
Nearly 4.7 Million
 Michiganders fully Vaccination Coverage in Michigan as of 6/28/21
 vaccinated
 Age Group % At Least % Fully Number Fully
 4.69 million people in the state are fully
 vaccinated One Dose Vaccinated Vaccinated
 More than 80% of people aged 65 and Total Population 51.4 47.0 4,693,169
 older have completed the series
 >=12 years 59.7 54.6 4,693,087
 Race/Ethnicity for those 12 years and older:
 • Initiation coverage highest among those >= 18 years 62.4 57.4 4,502,779
 of Non-Hispanic (NH) Asian, Native
 Hawaiian or Pacific Islander Race >=65 years 84.7 80.4 1,418,837
 (50.3%), then NH American Indian
 (46.1%), NH White (43.8%), NH Black
 or African American Races (31.6%).
 • Initiation is at 40.5% for those of
 Hispanic ethnicity
 • Completion follows the same pattern

 • 22.0% data missing or unknown

 Public Health Other Science
National Comparison Spread
 Response Indicators Round-up
`

Potential COVID-19 Vaccination Breakthrough Cases

Michigan part of CDC’s nationwide investigation (COVID-19 Breakthrough Case Investigations and Reporting | CDC)

Michigan Data (1/1/21 through 6/22/21):
• 7,263 cases met criteria based on a positive test 14 or more days after being fully vaccinated
• Less than 1% of people who were fully vaccinated met this case definition
 • Includes 189 deaths (171 persons age 65 years or older)
 • 482 cases were hospitalized

• Vaccine breakthrough cases are expected. COVID-19 vaccines are effective and are a critical tool to bring the pandemic
 under control. However, no vaccines are 100% effective at preventing illness in vaccinated people. There will be a small
 percentage of fully vaccinated people who still get sick, are hospitalized, or die from COVID-19.
• There is some evidence that vaccination may make illness less severe for those who are vaccinated and still get sick.
• To date, no unexpected patterns have been identified in the case demographics or vaccine characteristics among
 people with reported vaccine breakthrough infections.

 Public Health Other Science
National Comparison Spread
 Response Indicators Round-up
Key Messages: Science Round Up

Delta variant is the most transmissible variant of concern to date
• The spring surge would have increased dramatically faster it had been the Delta variant

To obtain effective protection against the Delta variant, two doses of the mRNA vaccine are required

Michigan and the U.S. have followed international trends with other VOC surges
• First, we had the warning of the Alpha (B.1.1.7) in Europe
• The Delta variant has recently impacted other countries greatly including countries with higher vaccination coverage, like
 Israel and the UK
• There is a potential for another surge in Michigan as Delta prevalence increases

Mobility Update
• Average mobility is increasing
• Stay-at-home levels have declined to near-2019 levels
• Number of trips taken per day have increased to 2019 levels
• Workplace mobility remains below baseline

 Public Health Other Science
National Comparison Spread
 Response Indicators Round-up
What might the spring surge have looked like if
 it had been the Delta ( ) variant?
 • Delta is more transmissible — Actual
 compared to B.1.1.7 and — Projected if Delta variant
 ancestral (non-variant) COVID
 • Based on the estimated Rt, a
 spring surge with Delta would
 have shown a faster rise
 • Could have led to over 1300 daily
 cases per million within the first
 month if unchecked
 • Note this does not account for additional
 responses/interventions that might have
 occurred following this faster surge (e.g.
 increased social distancing, etc.)
Sources: Case data from MDSS, actual Rt estimated assuming a 6 day generation
time (Reed et al. 2021), then projected for Delta based on increased Rt estimates
(Campbell et al., Eurosurveillance, 2021) assuming spring surge was primarily Alpha.
Delta variant: Two doses of mRNA vaccine needed

Delta variant SARS-CoV-2
is the most common
strain in Scotland.
Vaccine effectiveness
has been high, but only
after the second dose.

 Sheikh, A et al. Lancet. June 14, 2021, DOI:https://doi.org/10.1016/S0140-6736(21)01358-1
United Kingdom
Case surges in Israel and
UK after introduction of
Alpha and Delta variants
Michigan experienced a similar
 Israel
surge in cases after introduction
of Alpha—potential for a surge Mask
 requirement
 reinstated 6/25
in Michigan as Delta increases
 Vaccine Coverage Israel
 UK
 MI

 Michigan
 Increasing
 % Delta
 variant

 Sources: MDSS, MCIR, Our World In Data.
 Sequence data from outbreak.info.
Mobility Update
Change in average mobility
Unacast mobility
patterns in MI
• Average mobility
 increasing
• Non-essential visits and Change in non-essential visits
 encounter density remain
 plateaued
• Cases shown as bars at top of
 each chart
• Data through 6/21/21 (data as
 of 6/25/21)
 Difference in encounter density

 Unacast social distancing
 scoreboard
 https://www.unacast.com/co
 vid19/social-distancing-
 scoreboard
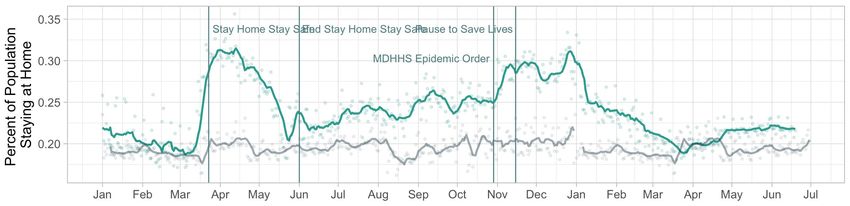
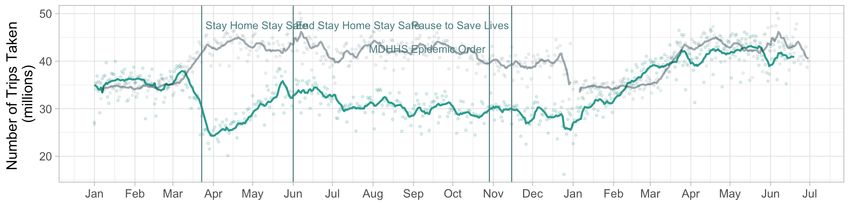
How many people are staying at home in Michigan?
 2020 - 2021
 2019 • % Stay-at-home
 levels have declined
 to near-2019 levels
 • Number of trips
 taken/day has
 increased to 2019
 levels
 • Most recent data is
 4/17/21 (data as of
 4/26/21)

 Data Source: Bureau of
 Transportation Statistics
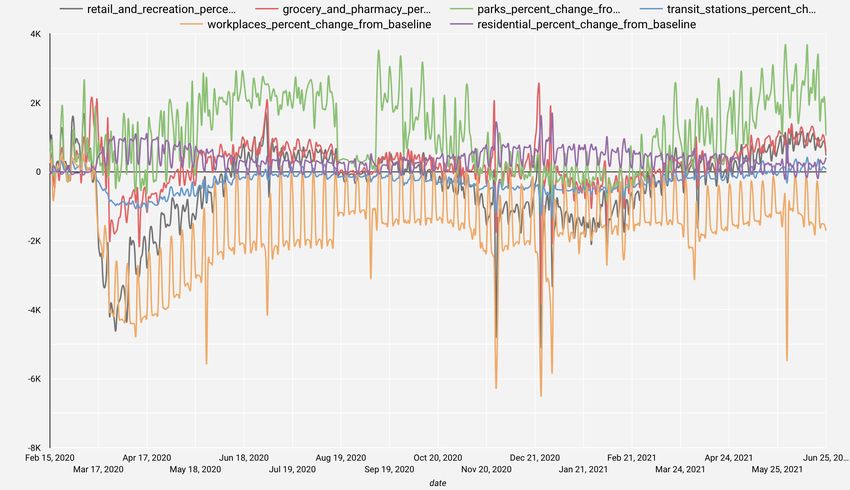
Google mobility trends: most metrics have
returned to baseline or above

• Most metrics
 are back to
 baseline or
 above
• Workplace
 mobility is still
 below baseline

 Google Mobility
 Reports
 Google Mobility
 Dashboard
You can also read