Helsinki region transport system planning - public transport and beyond 24.8.2017 @Suvekooli
←
→
Page content transcription
If your browser does not render page correctly, please read the page content below
Helsinki region transport
    system planning
  - public transport and beyond

         24.8.2017 @Suvekooli
            TAPANI TOURU
Contents HSL stategy and operations Helsinki transport system planning MAL 2019 plan • ”Public transport in the era of big changes in transport sector” Vocabulary HSL = Helsinki region transport HLJ = Helsinki region transport system plan MAL = Land use, Housing and Transport (plan)
HSL in General
What does HSL do?
Is responsible for the preparation of the Helsinki Region
Transport System Plan (HLJ).
Plans and organizes public transport in the region and work to
improve its operating conditions.
Procures bus, tram, Metro, ferry and commuter train services.
Approves the public transport fare and ticketing system as well
as public transport fares.
Is responsible for public transport marketing and passenger
information.
Organizes ticket sales and is responsible for ticket inspections.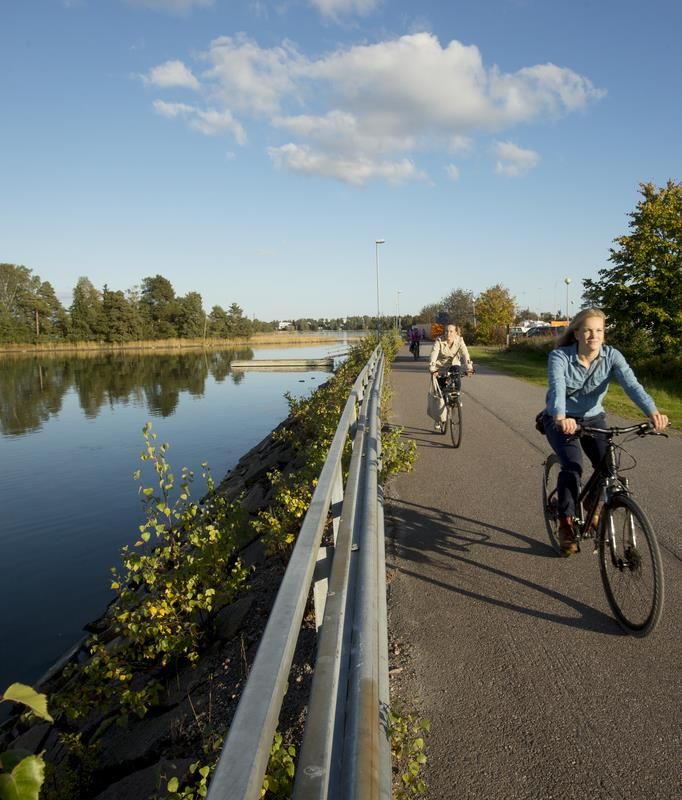
HSL – Strategy into action
Cooperation area and
expansion of HSL
Helsinki Region
• Land area 3700 km2
• 14 municipalities
• Population 1.38 million
HSL
• 6 founding municipalities: Helsinki, Espoo,
Kauniainen, Vantaa, Kerava, Kirkkonummi.
• Sipoo joined in 2012.
• Tuusula and Siuntio will join in 2018.
According to its charter, HSL may
expand to cover all 14 municipalities
in the region.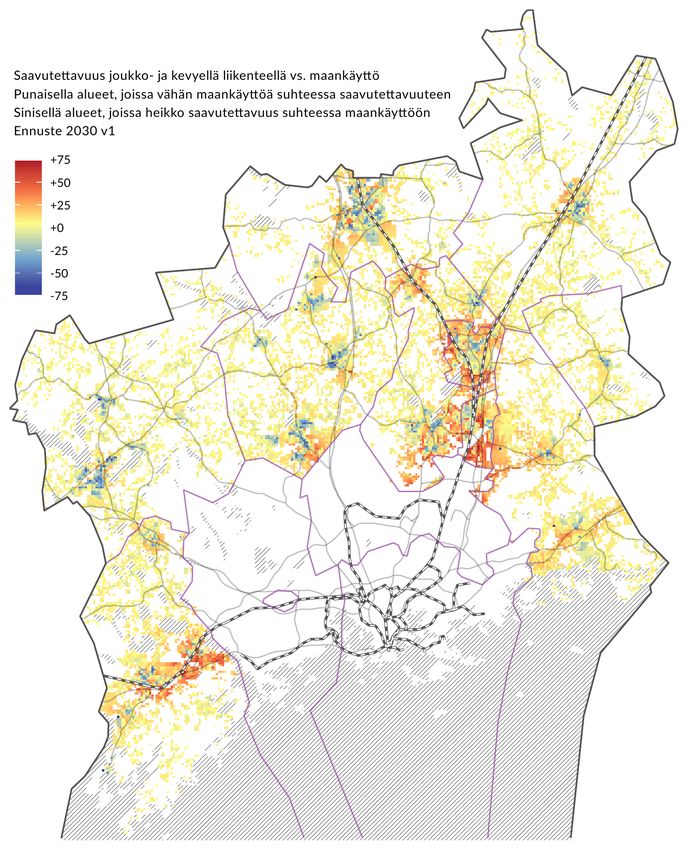
HSL Organisation 1.1.2017
                                              Executive Director Suvi Rihtniemi
   Transport System                                     Public Transport                                 Customer Experience and
   and Research                                         Director of Department                           Sales
                                                        Tero Anttila
                                                                                                         Director of Department Mari Flink
   Director of Department                               Public Transport Systems
                                                        Head of Group                                    Customer Experience
   Sini Puntanen
                                                        Johanna Wallin (temporary Juha Puolitaival)      Head of Group Laura Sundell
   Transport System                                     Route Network and Timetable Planning             Communications and Marketing
   Head of Group                                        Head of Group                                    Marketing and Communications
   Tapani Touru                                         Jonne Virtanen                                   Manager Sari Kotikangas
                                                        Procurement                                      Sales
   Traffic Surveys                                                                                       Sales Manager Matias Sarkkinen
                                                        Head of Group
   Head of Group
                                                        Mika Häyrynen                                    Customer Service
   Marko Vihervuori
                                                        Public Tranport Operating Conditions             Head of Group Eija Jalo
                                                        Head of Group                                    Ticket Inspection
                                                        Veera Laiterä (temporary Ville Uusi-Rauva)       Head of Unit Janne Solala

Technology Solutions        IT Infra and Administrative                Information Systems      Ticketing Systems        Devices and Operating
Director of Department      System Services                            Head of Group            Head of Group            Data Systems
Hannu Heikkinen             Data Administration Manager Seppo Perkiö   Kerkko Vanhanen          Risto Vaattovaara        Head of Group Krister Karppinen

Administrative and Strategic                 Financial Services            Human Resources            Office Services Legal Services
Services                                     Financial Manager             Human Resources Manager    Office Manager     Senior Lawyer Kaisa Mäkinen
Director of Department Ilmari Mäkinen        Maarit Hauskamaa              Eeva-Liisa Haaksluoto      Heli Ruuska        Lawyer Elisa Molin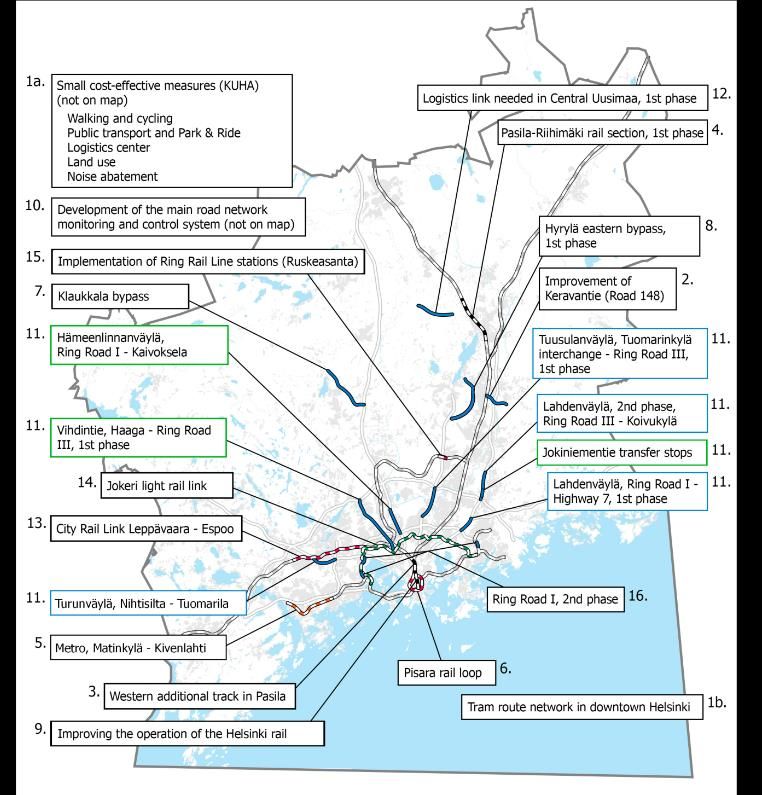
Public transport purchaser-
provider model

          Bus services
         (Helb, Nobina, Veolia,
      Pohjolan liikenne, Korsisaari,
      Oy Andersson, Taksikuljetus,
       Etelä-Suomen linjaliikenne,
         Tammelundin liikenne,         Metro       Trams      Commuter trains   Ferry services
              Åbergin linja)           (HKL)         (HKL)          (VR)           (HKL/SLL)

                                               Raitiovaunut
                                                   (HKL)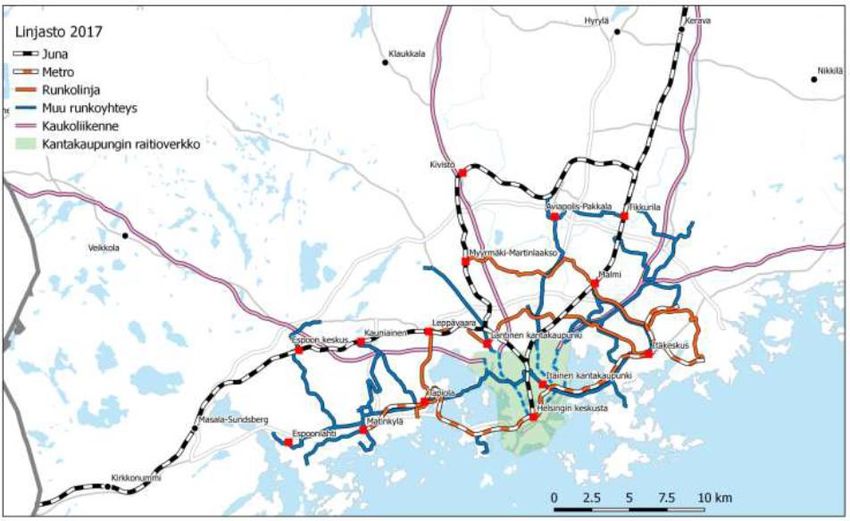
Economic Outlook
HSL’s operating income 2015
      Total €614.8m
                                                                                   Ticket
      Other income 1.9 %    Government subsidies for PT 1.0%                      revenue

                                                                                  Helsinki
                                                                                  internal
                                                                                   23.2%

             Municipal      Ticket revenue
            contributions       48.5%                                             Regional
               48.6%                                                               tickets
                                                                                   18.2%
                                                 Extended regional tickets 2.7%
                                                           Espoo internal 2.4%
                                                          Vantaa internal 1.7%
                                                     Kirkkonummi internal 0.1%
                                                   Kerava-Sipoo internal 0.1%
                                                               Kutsuplus 0.1%
                                                    Kauniainen internal 0.02%
HSL’s operating expenses 2015
Total €614.9m
Operating
Infra services 11.2% costs
Other purchases of services 4.6%
Personnel expenses 3.1%
Rents 0.6%
Bus
Other expenses 0.6% services
52.2%
Train
services
Operating costs 13.9%
79.9% Tram
services
8.4%
Metro services 4.3%
Ferry services 0.7%
Kutsuplus 0.4%Public Transport
FiguresHSL’s operating expenses 2015 Helsinki metropolitan area residents’ travel habits: number of journeys made and the share of public transport within the metropolitan area
Number of public tranpost
passengers 2013–2014, million
      Boardings on public transport vehicles
                                                                    Whole             Share of
                            HSL 2014          HSL 2013          Finland 2013          HSL 2013
        Buses                   182.0              179.3             352.7                51 %
        Metro                     62.1               63.4              63.4             100 %
        Trams                     55.5               56.6              56.6             100 %
        Commuter trains           51.9               50.3              69.3              73 %
        Ferrie                      1.8                1.8               1.8            100 %

        Total                   353.3              351.4             543.8                65 %

                              Source: Public Transport Performance Statistics 2013, Finnish Transport Agency
Routes and number of services
2014
Weekdays
Routes Services
Bus 319 21,072
Metro 2 497
Trams 12 2,408
Trains 14 857
Ferry 2 72
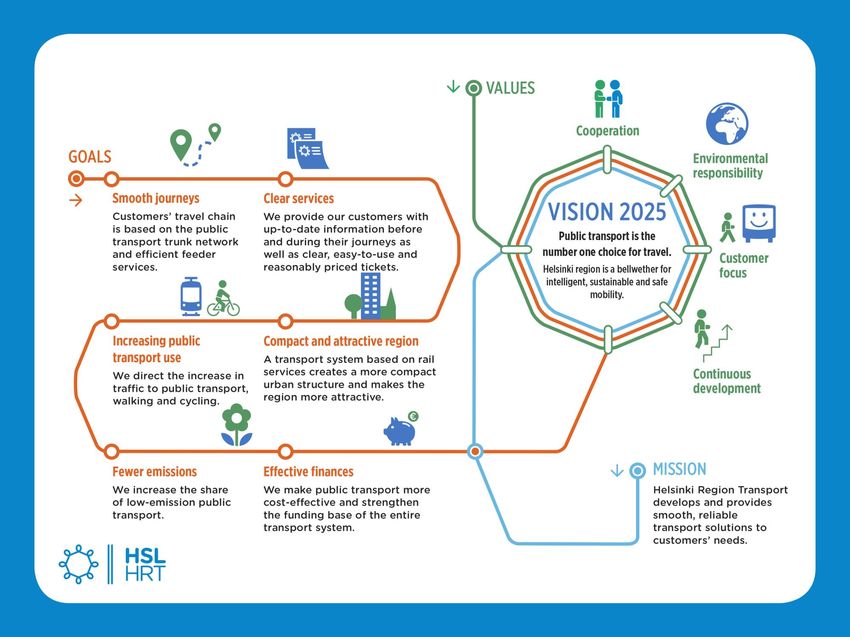
Total 349 24,906Helsinki Region
Transport System
PlanningHelsinki Region Transport System Plan A long-term strategic plan. Aligns regional transport policy. A common view on the transport system development path and measures in the near future. Part of the land use, housing and transport (MAL) co-operation in the Helsinki region and of the MAL Letter of Intent preparation and monitoring process. Is based on the Regional Development Act and HSL’s Charter.
Helsinki Region
Transport System

                        (29%-63%)
          (29%-63%)

                                    2016

                 2012
Helsinki Region Transport System Planning has been developed in stages
HLJ 2015

20     Esityksen nimi   29.8.2017
MAL-HLJ-interaction                                                                 Implementation

   - two processes hand in hand
                                                                         MAL-
         Impact assesment                                              Intention
                                                                        2016-2019
                                                         MASU
                                       MASU-
          Preparation of
           the Land Use                 draft              HLJ 2015
            Plan MASU
              and the
             Housing
             Strategy                      HLJ 2015 -
                                             draft
                Preparation of
              the Helsinki Region
               Transport System                                              M = Land use
                     Plan                                                    A = Housing
                   HLJ 2015
                                                                             L = Transport

       2012      2013               2014                2015          2016
The coherent urban
structure of the The dense core area is
metropolitan area surrounded by a network
combines multiple of district centers each
functions and is eco- with their own distinctive
Helsinki region is efficient. character and close-to-
developed as an nature environment.
attractive metropolitan
area functioning as an The transport system based
integrated whole. on sustainable modes of
transport serves the
The growing region accessibility of the region
offers a wide range of and the competitiveness of
housing options. industry and commerce.
MAL-VISION
(HSYK 26.11.2013 , HLJ Committee 31.1.2014)Transport goals (HLJ Committee 18 March 2014)
Accessibility – smoothness
Trip and transportation chains are seamless and reliable near and far.
The competitiveness of public transport improves.
Cycling is attractive and smooth.
Vehicular traffic journey times are predictable and congestion is in control.
Walking routes and environments are pedestrian-friendly.
Social, economic and ecological sustainability – responsibility
Travel is safe on all modes of transport.
There are alternatives for daily journeys meeting diverse user needs.
It is easy for people to choose healthy and responsible modes of transport.
Adverse environmental impacts and the environmental load of transport
are reduced.
The transport system is developed cost-effectivelyIn 2050, the Helsinki region is home to
every third Finn 2,000,000 network-like public
inhabitants transport
million
1,050,000 5.7 daily trips
a strong
metropolis
jobsHLJ 2015 policies show the way
Infrastructure development projects
Proposal for projects to be launched in 2015-2025
1a. Small cost-effective measures KUHA (continuous) *
*Projects named in the agreement signed
between the State and Helsinki region
1b. Helsinki downtown tram network (continuous)
municipalities to promote large infrastructure
2. Improvement of Keravantie (Road 148) (supp budget 2014)
projects and housing
3. Western additional track in Pasila (budget 2015)
4. Pasila–Riihimäki rail section, 1st phase (budget 2015) *
5. Metro Matinkylä – Kivenlahti + street and road arrangements *
6. Pisara Rail Loop (more detailed cost estimate on 15 Oct 2014) *
7. Klaukkala bypass, Road 132*
8. Hyrylä eastern bypass*
9. Improving the operation of the Helsinki rail yard (HELRA)
10. Development of the main road network monitoring and control system
11. Mid-sized road packages (competitiveness of public transport, vehicular traffic congestion
control)
12. Logistics link needed in Central Uusimaa, 1st phase
13. Espoo City Rail Link (Leppävaara-Espoon keskus)
14. Jokeri Light Rail
15. Ruskeasanta station
16. Ring Road I, 2nd phase
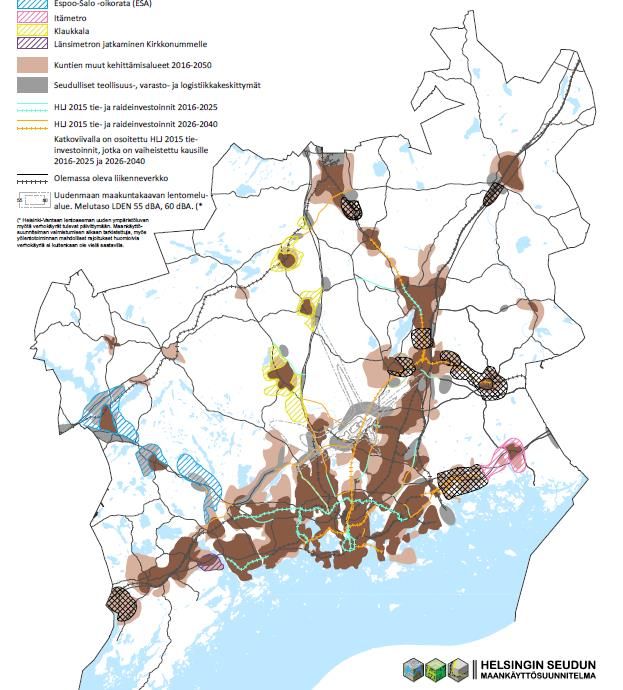
€375m/yearOther areas of development for the
municipalities 2016–2050 Land Use Zones The primary development
areas of the region 2016–2050
The development of areas outside the
regional zones which have a strategic The goal is to direct at least 80 % of
importance in the current plans of the new housing construction into these
municipalities areas
Areal development may not cause
significant regional investment needs or The complemental areas of the
hinder the development of the regional primary development areas in
scale at a later time
the region
2025–2050
Regional industrial, These areas become primary
logistical and development areas as the transport
warehouse centres network is complemented in
accordance with the HLJ 2015
Possible areas of expansion after
Areas outside the designated
2040
zones
Areas connected to large transport
investments and whose development
Areal development may not cause
significant regional investment needs or in a grand scale is in conjunction with
hinder the development of the regional the implementation of the possible
scale at a later time transport investments
31HLJ 2015 is good for the region
Public transport is
used more: its share Accessibility
of motorized trips of the region The per journey cost
increases by of public transport
6 percentage points. improves decreases.
significantly.
The capacity of main
roads is used almost
to the full but hardly An increasing number of people choose
ever exeeded.
public transport, cycling and walking.Significant environmental impacts
The climate target 2030 New land use is
for the metropolitan area located in noise
is achieved. zones.
The EU climate targets are not
achieved without significant
changes. Air quality may Quiet
deteriorate areas
locally. are not at risk.
Increase in vehicular traffic increases Conditions for a car-free
accidents but relative to population, lifestyle are created but car
accidents decrease. dependency continues to be a
challenge.Mid-Summary In the future the population of the region increases significantly. The functioning of the traffic system is ensured by: • intensifying land use in harmony with transport system. • examining vehicular traffic pricing as a means of directing mobility and funding transport system • improving the service level of public transport in the whole region. -> MAL-agreement between state and municipalities
MAL 2019
Towards next transport system plan Prepared together with regional housing and land use planning processes (MAL agreement) Key challenge is to decrease CO2 emissions (with economically viable solutions) • More compact cities • Bigger share of sustainable modes of transport • Technology will for sure help, but when and how? ”Realism and resilience”
Planning Organization
                                                                                                                Municipalities
                                                                                                             take part in transport
PREPARATION

                  Expert groups:        Land Use Group          Housing Group            Transport Groups    system planning and
                  Representatives                                                                           are responsible for land
                  of municipalities,                                                                           use and housing
                  HSL and the                                                                                      planning.
                  state                    Land Use, Housing and Transport (LHT) Project Group

                                                                                                                     HSL
                                                                                                               is responsible for
                                                                                                            preparing the transport
STEERING

                  Steering groups:
                                                                                                            system plan (binded by
                  Leading authorities           LHT Committee             Transport System Committee          law) and its impact
                  of municipalities
                  and the state                                                                                   assessment.
DECISION MAKING

                                                                                                                  The State
                                        Helsinki Region General Meeting                                     participates in planning
                  Decision makers:                                              HSL Executive Board
                  Elected officials                 (HSYK)                                                   and is represented in
                                                                                                             the Transport System
                  of municipalities
                                                     Keski-Uusimaa Region (KUUMA) Executive Board             Committee and LHT
                                                                                                                 project group.
Land Use, Housing and Transport
System Plan 2019
Political decision making
Integrated transport, land use and housing planning
”Framework”
Support studies
”Planning the plan”
Learning from the previous plan
• Concrete measures for the near • Impact assessment guides planning
future, flexibility in the long run • Milestones set the pace of planning and decision making
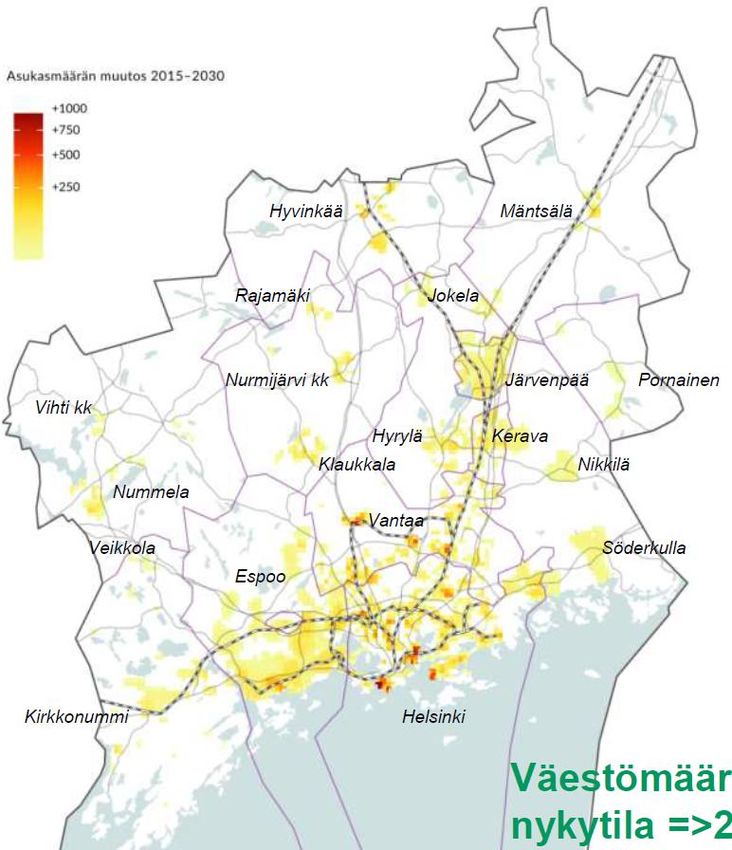
• Efficient use of existing data • Transparent, concise and efficient interactionPublic transport trunk routes
Population
2015 -> 2030
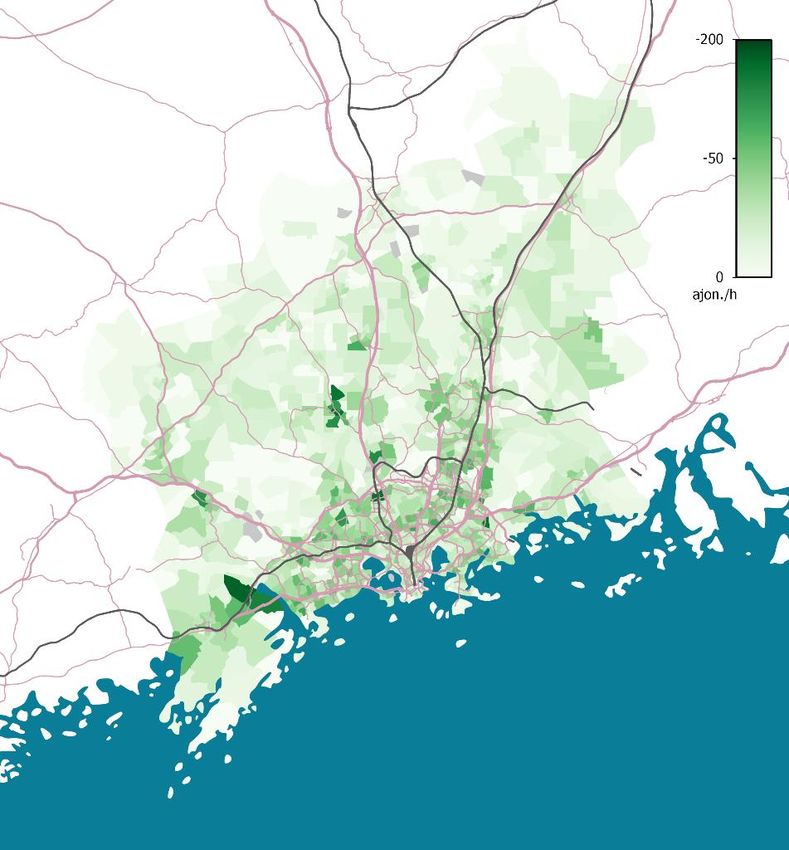
40 Esityksen nimi 29.8.2017Year 2030:
Density related to accessibility
Saavutettavuus ja tiheys laskettu ruuduittain asukasmääräpainotettuina persentiileinä ja niistä erotus: tuloksena erottuu ruudut, joissa muihin kehyskuntien
(vasen kuva) tai PKS:n (oikea kuva) asukkaisiin verrattuna hyvä saavutettavuus ja vähän maankäyttöä tai toisinpäin.Centers in Helsinki region v. 2015 ja 2050
Technology & services
         PRIVATE AUTOMATED VEHICLES

         SHARED AUTOMATED VEHICLES

            AUTOMATED MINI BUSSES

     AUTOMATED PUBLIC TRANSPORT VEHICLES
                                                                                Sharing
      INFORMATION AND TRAFFIC MANAGEMENT
                      SYSTEM

             ALTERNATIVE FUELS
                                                                                Automation
         ELECTRIC AND CARGO BICYCLES
                                                                                Information and traffic
            NEW AVIATION VEHICLES
                                                                                management system
                 ROAD FEES

       DEMAND DRIVEN PUBLIC TRANSPORT                                           Delivery services
                  CITY BIKES

               SHARED VEHICLES
                                                                                Alternative fuels
         MAAS/TRAVEL CHAIN SERVICES

           HOME DELIVERY SERVICES

43                                         MAL2019 - Liikenteen uudet palvelut ja teknologiat             29.8.2017
Sharing rides
Division of trips The portion of shared
rides according to initial
trip plan
Henkilöautomatka
Private car (alone)yksin Substitued private
Korvautunut car trip
Henkilöautomatka
Julkinen liikenne
Public transport Substitued public
Korvautunut transport tripmatka
Julkisenliikenteen
Jaettu henkilöautomatka
Private car (shared)
Lähtevien ajoneuvomatkojen määrän alenema (ajon.matkaa/alue)
aamuhuipputunnilla 2030
44 MAL2019 - Liikenteen uudet palvelut ja teknologiat 29.8.2017Simulation of shared modes 45 MAL2019 - Liikenteen uudet palvelut ja teknologiat 29.8.2017
The role of public transport in the
   revolution of urban transport
   (according to UITP and the public transport authorities of large Nordic cities)
    Cities are growing and excessive                Efficient public transport trunk services are still
    driving takes up space weakening the            needed but increasing the share of public
    quality of the living environment and           transport through investments and subsidies is
    threatening economic growth,                    getting more difficult and expensive
    productivity and health
Data transmission, data, mobile
devices, social media, location                     More effective and optimal use of                     A more extensive array of
services, etc. create possibilities and             existing space is necessary                           mobility services designed
bring new services to the market                                                                            around efficient public
                                                    Increasing road and street capacity
                                                                                                          transport is the answer to
As values and behavior change,                                                                             the versatile, increasing
                                                    for driving is a bad alternative
citizens are looking for new means                                                                         mobility needs of cities.
of mobility

 Political will supports (even requires) reducing       Pricing of transport is necessary to
 emissions, better urban environment, healthy           direct demand and modal choice
 mobility choices, utilizing digitalization,
 developing markets
   46                                                                                                                      29.8.2017
Preliminary trends in the development of HSL’s
role in the field of mobility services
1 Ticketing cooperation 2Information and marketing cooperation 3 Services provided by HSL
1c. Public transport ticketing 2b. Other mobility service providers 3c. In certain areas of at certain times,
cooperation with authorities and are included in the Journey Planner public transport supply is
commercial actors is increased. replaced/piloted by other mobility
• Data interfaces available for everyone services, provided the service
• Ticketing interfaces in contractual in line with the Act on Transport Services
cooperation (independent of this) • Supplements HSL’s services
• HSL’s condition is the ownership of • Partners for more extensive cooperation • Creates a long-distance trip chain
customers and anonymous travel data are selected on the same basis as for • Contributes to sustainable mobility (car-free
of the users of HSL transport ticketing cooperation lifestyle) that does not unilaterally compete
services • Operative powers with public transport
• Selecting partners who implement • Does not increase car mileage, in particular
HSL’s strategic goals in areas with limited capacity
• Having only cooperation with benefits
to HSL’s goals and customers in 3a. HSL provides a mobility platform. HSL
proportion to the resources required plans and organizes a mobile ride-hailing and
• Common commercial and technical pooling service in its area
criteria for contract partners
• Operative powers
Transport system planning takes all mobility services comprehensively into account regardless of HSL’s role in their production
HSL is responsible for the preparation of the Helsinki Region Transport System
47 Plan (HLJ) in cooperation with strategic land use and housing planning.Planning Outcomes
Current situation and Goals
• Grounds for developing the Helsinki Region
2019 – 2030: Measures
• Investments in infrastructure and land use
development
• Other efficient measures
2031 – 2050: Scenarios
• Uncertainty increases in the long run, which
requires:
Examination of different scenarios and
development paths
Increased demand for flexibility in planning
Adapting to changes in operational environmentThank you
Head of Group Tapani Touru
Transport System and Research Department, Helsinki Region Transport
tapani.touru@hsl.fi
+358 40 504 2270You can also read