RESULTS PRESENTATION MARCH 2019 - MAS REAL ESTATE INC.
←
→
Page content transcription
If your browser does not render page correctly, please read the page content below

MAS REAL ESTATE INC.

RESULTS PRESENTATION
MARCH 2019

1 MAS REAL ESTATE INC RESULTS PRESENTATION 2019
RESULTS PRESENTATION

CONTENTS
Highlights .  .  .  .  .  .  .  .  .  .  .  .  .  .  .  .  .  .  .  .  .  .  .  .  .  .  .  .  .  .  .  .  .  .  .  .  .  .  .  .  . 3
3 year plan on track.  .  .  .  .  .  .  .  .  .  .  .  .  .  .  .  .  .  .  .  .  .  .  .  .  .  .  .  .  .  .  . 4
Engine for growth.  .  .  .  .  .  .  .  .  .  .  .  .  .  .  .  .  .  .  .  .  .  .  .  .  .  .  .  .  .  .  .  .  . 6
Portfolio. .  .  .  .  .  .  .  .  .  .  .  .  .  .  .  .  .  .  .  .  .  .  .  .  .  .  .  .  .  .  .  .  .  .  .  .  .  .  .  .  .  . 7
PKM Developments .  .  .  .  .  .  .  .  .  .  .  .  .  .  .  .  .  .  .  .  .  .  .  .  .  .  .  .  .  .  . 14
Key metrics. .  .  .  .  .  .  .  .  .  .  .  .  .  .  .  .  .  .  .  .  .  .  .  .  .  .  .  .  .  .  .  .  .  .  .  .  .  . 16
Financials .  .  .  .  .  .  .  .  .  .  .  .  .  .  .  .  .  .  .  .  .  .  .  .  .  .  .  .  .  .  .  .  .  .  .  .  .  .  .  . 17
Capital management .  .  .  .  .  .  .  .  .  .  .  .  .  .  .  .  .  .  .  .  .  .  .  .  .  .  .  .  .  . 20
Outlook.  .  .  .  .  .  .  .  .  .  .  .  .  .  .  .  .  .  .  .  .  .  .  .  .  .  .  .  .  .  .  .  .  .  .  .  .  .  .  .  .  . 21                                              FLENSBURG GALERIE,
                                                                                                                                                                                        FLENSBURG,
NOTICE:                                                                                                                                                                                  GERMANY
Information contained in the document is believed by the issuer to be accurate and correct, and statements of opinion in this document are considered by the issuer to be
reasonable, in each case at the date of this document, but the issuer does not accept responsibility for any such information, and all recipients of this document are expressly
reminded of the requirement to carry out their own due diligence into MAS Real Estate Inc. MAS Real Estate Inc. disclaims any obligation or undertaking to update, review or
revise any forward looking statement contained in this announcement whether as a result of new information, future developments or otherwise. Recipients should make their
own assessment and take independent professional advice on the merits of investment and the legal, regulatory, tax and investment consequences and risks of doing so. The
issuer accordingly accepts no responsibility to any person for the consequences of any person placing reliance on the content of this document for any purpose. This document is
confidential to the issuer and contains confidential information pertaining to the issuer and is sent to a limited number of persons on a confidential basis. Recipients are required to
keep the document and the information contained in it confidential and not to copy or disclose it or any part of it to any other person without the consent of the issuer.
Recipients should further pay particular attention to the disclaimer contained in the section ‘Disclaimer’. For further information about MAS Real Estate Inc., please visit our website
www.masrei.com
© MAS Real Estate Inc., 2019. All rights reserved.

 2         MAS REAL ESTATE INC RESULTS PRESENTATION 2019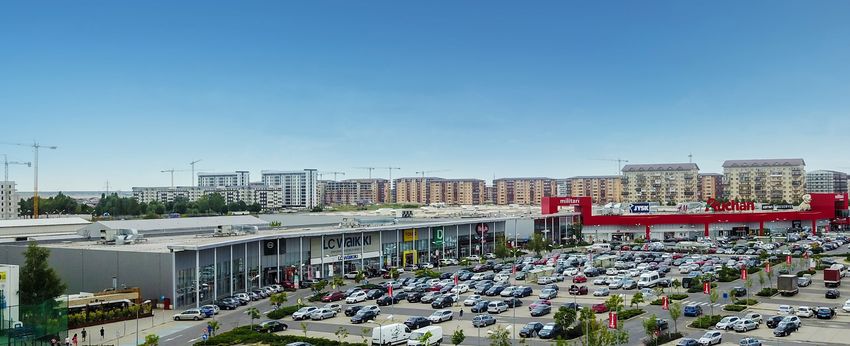
3 YEAR PLAN ON TRACK

                                                                                            2016                                         2017                                        2018    2019

                                             €311M                                                                                                                                     €941M
              INVESTMENT                                                                                                                                                                       ii
                PROPERTY i

      CEE INVESTMENT
            PROPERTY                                0%                                                                                                                                 >45%
                                                                                                                                                                                             TARGET

                                               €13M                                                                                                                                         >€55M
          DISTRIBUTABLE                                                                                                                                                                               iii
              EARNINGS
i
       Includes investment property held for sale.
ii
       Includes acquisitions post 31 December 2018.
iii
     	The target is 8.75 euro cents per share, based on the acquisition and development pipeline in place and further opportunities being pursued. It also assumes that a stable
       macro-economic environment will prevail, no major corporate failures will occur, the investments and developments reported on above will progress as expected and budgeted
       rental income based on contractual escalations as well as market-related renewals will be collected. This target has not been reviewed or audited by the group’s auditors .

                                                                                                                                                                                                            3
      3     MAS REAL ESTATE INC RESULTS PRESENTATION 2019
4 MAS REAL ESTATE INC RESULTS PRESENTATION 2019

ENGINE FOR GROWTH

                                                    1       ACTIVE ASSET
                                                            MANAGEMENT

                                                    2   RECYCLING CAPITAL FROM
                                                            MATURE ASSETS

                                                    3     2 YEAR EXCLUSIVITY
                                                              EXTENSION

5   MAS REAL ESTATE INC RESULTS PRESENTATION 2019
HIGHLIGHTS

38% 103%                                            40%              73%                  DISTRIBUTION      2 YEAR
                                                                               i
                                                                                          PER SHARE OF      EXTENSION TO
YEAR-ON-YEAR
INCREASE IN H1
                         YEAR-ON-YEAR
                         INCREASE IN H1 NET
                                                    YEAR-ON-YEAR
                                                    INCREASE IN H1
                                                    DISTRIBUTABLE
                                                                     YEAR-ON-YEAR
                                                                     INCREASE IN H1
                                                                     INVESTMENT
                                                                                          3.78
                                                                                          EURO CENTS
                                                                                                            EXCLUSIVITY
                                                                                                            WITH PRIME
                                                                                                            KAPITAL UNTIL
RENTAL INCOME            OPERATING INCOME           EARNINGS PER     PROPERTY.
                                                    SHARE            49% INCREASE                           2023
                                                                     SINCE 30 JUNE 2018

                                                                                               BAIA MARE,
                                                                                                            	Includes acquisitions post
                                                                                                            i
                                                                                                ROMANIA       31 December 2018 and assets
                                                                                                              held for sale.

6   MAS REAL ESTATE INC RESULTS PRESENTATION 2019
PORTFOLIO
DEVELOPMENT AND EXTENSION PIPELINE
100 250 NUMBER OF
EURO MILLION
SQM (THOUSANDS)
FURTHER FURTHER
SECURED SECURED INCOME-GENERATING
4 6 PROPERTIES
27.9 83.0
80 200 NUMBER OF EXTENSIONS,
DEVELOPMENTS AND LAND BANK
Edinburgh Office
60 150 MAS AND ASSOCIATE
62.2
COST OFFICES
146.5
GLA
PASSING RENT
Isle of Man Headquarters
40 100 €9.25M PASSING RENT 1
2016
€5.10M €20.33M ii
2016 Poland Office
33 2
€15.77M
20 50 UK PASSING RENT
London Office GERMANY POLAND €4.71Mi 2016
0
SQM COST
0 —
Frankfurt Office
I N CO M E- G E N E RAT I N G P I P E L I N E
30 350
EURO MILLION
EURO MILLION
FURTHER FURTHER
1
336.5 PASSING RENT
300
25 4 7
€15.53Mi, ii 2016
23.0 250 PASSING RENT
SWITZERLAND —
20
€1.16M 2016
ROMANIA
200
€1.20M
PASSING RENT
Prime Kapital Office
VALUE
15
150 2
10
100
PASSING RENT
BULGARIA
5
50 €6.22Mi 2016
—
0 0
PASSING RENT VALUE
i
MAS’ share of the income-generating portfolio’s passing rent
ii
Includes passing rent acquired post 31 December 2018
7 MAS REAL ESTATE INC RESULTS PRESENTATION 2019
ASSET MANAGEMENT

UBERIOR HOUSE                                       UBERIOR HOUSE,
• 14,700 m² GLA prime office space in the heart      EDINBURGH,
  of Edinburgh, Scotland.                             SCOTLAND

• Extended the leases with Bank of Scotland to
  2030.
• Rent review due in 2020.
• Lease extension has driven increased value.

CHIPPENHAM
• 37,400 m² technology park in Chippenham,
  England.
• Siemens, removed break clause and renewed
  for a further 5 years.
• Repositioned the industrial site as a
  technology park.

BRAUNSCHWEIG
• Development of 3,600m² of pre let GLA.

8   MAS REAL ESTATE INC RESULTS PRESENTATION 2019

CEE RETAIL EXTENSIONS

Plans under way to refurbish and extend the         • 27,600 m² GLA extension of Militari Shopping Centre;
portfolio of retail assets by approximately         • 15,000 m² GLA increase in Galleria Burgas;
57,000 m² of GLA (€134.5 million investment).       • 11,000 m² GLA in extensions of Slobozia, Roman and Baia Mare;
This will increase the fashion and leisure
                                                    • 3,000 m² GLA extension of Nova Park; and
offering of the centres to consolidate their
regionally dominant positions and enhance their     • A major refurbishment and reconfiguration of Galleria Stara Zagora expected to
performance and includes:                             complete by July 2019.

                                                                                                                                   MILITARI,
                                                                                                                                  BUCHAREST,
                                                                                                                                   ROMANIA

9   MAS REAL ESTATE INC RESULTS PRESENTATION 2019
RECYCLING OF CAPITAL
GPU – NEW WAVERLEY
• 19,000 m² GLA office development for the UK
government.
• Development ahead of schedule, on budget.
WHITBREAD
• 8,300 m² GLA hotel and associated retail.
• Sold for £38.0 million (approximately
€43.4 million).
GPU,
• Disposal at NOI yield of 4.07%. EDINBURGH,
SCOTLAND
PA4 SOUTH - RESIDENTIAL
• Planning for 62 unit residential block with
5,600 m² GIA.
• Sold for £6.7 million (approximately €7.5
million).
• Northern site sold subject to finalisation of the
UK governments option.
10 MAS REAL ESTATE INC RESULTS PRESENTATION 2019ACQUISITIONS
ATRIUM MALL
• 28,600 m² GLA mall
acquired in December 2018
in joint venture with Prime
Kapital for €40.5 million.
• Sole modern destination in
Arad, Romania and the wider
catchment area.
• Centrally located, adjacent
to main transport hubs,
with excellent visibility and
accessibility.
• Anchored by Carrefour,
Inditex, Cinema City, H&M,
C&A, New Yorker, LC Waikiki,
Hervis, Deichmann, Media
ATRIUM MALL,
Galaxy, Pepco and CCC. ARAD, ROMANIA
• 334,000 inhabitants within a
45-minute drive.
• Asset reconfiguration and
tenant mix optimisation plan
under consideration with
the aim to consolidate the
regionally dominant position
and further increase the
net operating income in the
medium term.
11 MAS REAL ESTATE INC RESULTS PRESENTATION 2019ACQUISITIONS
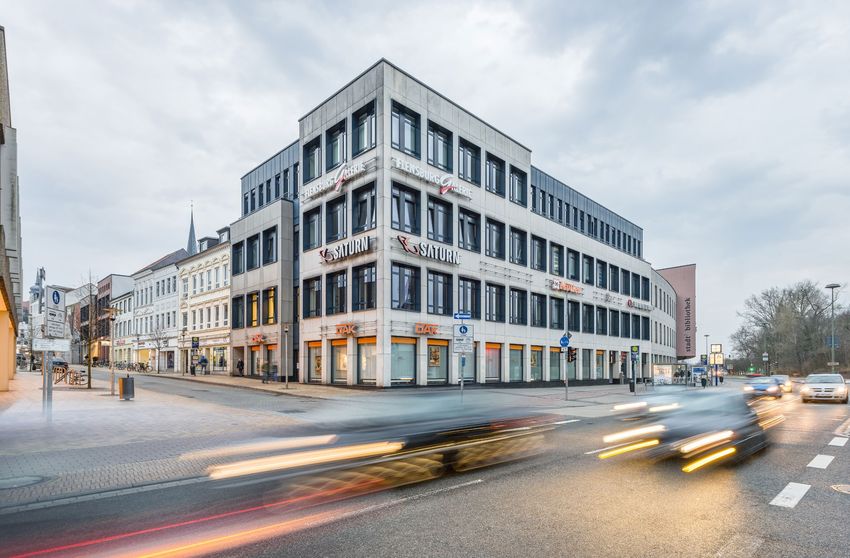
FLENSBURG GALERIE
• 25,500 m² GLA mall in Flensburg, northern
Germany, acquired for €62.6 million in
January 2019.
• 10 kilometres from Danish border, +1 million
Danish tourists visit mall each year.
• Only shopping centre in the inner-city of
Flensburg, directly on the prime central
shopping street.
• 500,000 people catchment within a
45-minute drive.
• Poorly managed centre provides the
opportunity to asset manage for value.
• Food retailer Netto opening February 2019,
which will stabilise centre and drive footfall.
FLENSBURG GALERIE,
FLENSBURG,
GERMANY
12 MAS REAL ESTATE INC RESULTS PRESENTATION 2019ACQUISITIONS
COMPLETED ASSETS FROM
PKM DEVELOPMENTS
• Portfolio of 67,950 m² GLA retail assets
acquired from PKM Developments in February
2019 for €108.7 million.
• The portfolio comprises two larger centres,
both anchored by Carrefour, in Roman
and Baia Mare and seven smaller, well-
located extensions to pre-existing Kaufland
BAIA MARE,
mini-hypers in Slobozia, Focsani, Targu ROMANIA
Secuiesc, Ramnicu Sarat, Fagaras, Sebes and
Gheorgheni.
• 87% GLA is rented to large international and
national anchors such as Carrefour, New ROMAN,
ROMANIA
Yorker, C&A, DM, Altex, Takko, CCC, Pepco,
Deichmann, Jysk, KFC and McDonald’s.
13 MAS REAL ESTATE INC RESULTS PRESENTATION 2019PKM DEVELOPMENTS
NUMBER OF
DEVELOPMENTS
SECURED DEVELOPMENTS
800 800
EURO MILLION
SECURED – SQM SECURED – COST
SQUARE METRES (THOUSANDS)
738
600 600
610
10
400 400
COST
GLA
ROMANIA
Prime Kapital Office
200 200
0 0
SQUARE METRES COST
14 MAS REAL ESTATE INC RESULTS PRESENTATION 2019PKM DEVELOPMENTS
Estimated
completion Book Value Dev Budget ERV Aggregate
Asset type date No of assets € € € GLA /GSA GLA¹ Units
Commercial CEE Developments Retail 2019 - 2023 7 82,197,270 495,302,261 47,380,880 356,300 394,600 —
Mall Moldova Retail 1 88,700 100,000
Arges Mall Retail 1 50,000 50,000
Dambovita Mall Retail 1 31,000 31,000
DN1 VC Retail 1 28,000 47,000
Ploiesti VC Retail 1 25,600 33,600
Zalau VC Retail 1 18,000 18,000
SEPSI VC Retail 1 15,000 15,000
Silk District – Office & Hotel Retail n/a 100,000 100,000
Residential and
Residential CEE Developments 2020 - 2023 3 23,794,885 235,161,475 n/a 254,000 254,000 3,735
mix-use
Avalon Estate Residential 2023 1 n/a 84,000 84,000 767
Marmura Residence Residential 2021 1 n/a 35,000 35,000 468
Silk District - Residential Mix-used 2023 1 n/a 135,000 135,000 2,500
Land bank Land bank n/a 5 7,943,808 7,393,313 n/a
Craiova land Land bank 1 n/a
Baia Mare land Land bank 1 n/a
Roman land Land bank 1 n/a
Slobozia land Land bank 1 n/a
Adjud land Land bank 1 n/a
Total secured projects 15 113,935,963 737,857,050 47,380,880 610,300 648,600 3,735
¹ Includes owner occupied and third party owned units.
15 MAS REAL ESTATE INC RESULTS PRESENTATION 2019KEY METRICS
DISTRIBUTION PER SHARE INVESTMENT PROPERTYii PASSING RENTiii
12.0 1 000 60 57.2
EURO CENTS
EURO MILLION
EURO MILLION
GUIDANCEi ACQUIRED POST 31 DECEMBER 2018 941.0 ACQUIRED POST 31 DECEMBER 2018
10.0 H2 DISTRIBUTION PER SHARE 50
8.75 800 769.8 47.0
H1 DISTRIBUTION PER SHARE
8.0 7.61 632.8 40
570.6 37.5
600 32.2
5.85
6.0 30
4.50
400
4.0 310.5 20 17.3
3.35 248.5
12.6
1.84 200
2.0 10
64.8 2.7
0.0 0 0
FY 2014 FY 2015 FY 2016 FY 2017 FY 2018 FY 2019 FY 2014 FY 2015 FY 2016 FY 2017 FY 2018 H1 2019 FY 2014 FY 2015 FY 2016 FY 2017 FY 2018 H1 2019
EPRA NAV PER SHARE MEDIAN DAILY SHARE VOLUME LOAN TO VALUE
140 500 40
THOUSANDS OF SHARES
PERCENTAGE
EURO CENTS
454.9 IMPACT OF ACQUISITIONS POST 31 DECEMBER 2018
134.9 427.4 38.2
135 30
132.7
400 16.5
130 20 24.9
10.0
125.9 10
125 300
122.1
120 0
116.0
200 -10
115 -12.7
137.5 -20
110
100 76.2 -30
104.6 40.8
105 -30.0
1.1 -190 -188.8
100 0
FY 2014 FY 2015 FY 2016 FY 2017 FY 2018 H1 2019 FY 2014 FY 2015 FY 2016 FY 2017 FY 2018 H1 2019 FY 2014 FY 2015 FY 2016 FY 2017 FY 2018 H1 2019
i
This target is based on the acquisition and development pipeline in place and further opportunities being pursued. It also assumes that a stable macro-economic environment will prevail, no major corporate failures will occur, the investments and developments
reported on above will progress as expected and budgeted rental income based on contractual escalations as well as market-related renewals will be collected. This target has not been reviewed or audited by the group’s auditors.
ii
Includes investment property held for sale.
iii
MAS’ share of the income-generating portoflio’s passing rent.
16 MAS REAL ESTATE INC RESULTS PRESENTATION 2019FINANCIALS FINANCIAL PERFORMANCE Euro million H1 FY19 H1 FY18 Growth Net rental income 23.8 15.3 55.7% Gross dividend income 1.9 0.1 > 100% Finance income – preference shares 4.8 3.8 27.4% Direct investment result 21.5 13.6 58.4% Net cash generated from operations 25.2 13.3 89.9% Per share data (euro cents) Distributable EPS 3.78 2.70 40.0% Distribution declared/proposed 3.78 3.58 5.6% 17 MAS REAL ESTATE INC RESULTS PRESENTATION 2019
FINANCIALS
CO M P O S I T I O N O F D I R E C T I N V E ST M E N T R E S U LT

                        35
         EURO MILLION

                                                                       2.0

                        30                             5.1

                                                                                      (3.9)
                        25          23.8

                                                                                                         (3.1)
                                                                                                                                                       21.5
                                                                                                                      (1.2)
                        20                                                                                                        (1.2)

                        15

                        10

                         5

                        0
                             NET RENTAL INCOME   FINANCE INCOME   DIVIDEND AND   FINANCE COSTS   CORPORATE EXPENSES   NCI     CURRENT TAX   DIRECT INVESTMENT RESULT
                                                                  OTHER INCOME

18   MAS REAL ESTATE INC RESULTS PRESENTATION 2019
FINANCIALS
FINANCIAL POSITION
Euro million H1 FY19 H1 FY18 Growth
Investment propertyi 769.8 489.5 57.2%
Investment in associate/preference shares 192.4 126.7 51.9%
REITs 149.2 200.1 (25.5)%
Fair value adjustmentsii (12.5) (0.6) N/A
Interest bearing borrowings 330.5 194.6 69.9%
LTV 24.9% 0.8% N/A
Per share data (euro cents)
EPRA NAV 132.7 137.2 (3.3)%
i
Includes investment property held for sale
ii
Includes gain on bargain purchase
19 MAS REAL ESTATE INC RESULTS PRESENTATION 2019CAPITAL MANAGEMENT
DEBT INVESTMENT PROPERTY DEBT
Euro MATURITY PROFILE
Term
31 December 2018 million Cost YR 100.0
EURO MILLION
Drawn debt 330.52 2.40% 4.36 90.0 82.3
81.1
80.0
Available facilities 189.10 70.0
– Negotiated 151.10 3.19% 3.82 60.0
50.0
– Under negotiation 38.00 2.83% 5.00
40.0 39.1
30.0 25.6
21.1
20.0
10.0 7.5
0
0-2 2-4 4-6 6-8 8-10 10+
YEARS
3% 10%
15%
23%
C U R€194.6
RENCY I N T E R E ST RAT E
82% 67%
MILLION
EXPOSURE EXPOSURE
EUR FIXED
GBP HEDGED
CHF FLOATING RATE
20 MAS REAL ESTATE INC RESULTS PRESENTATION 2019OUTLOOK
3 year plan is on track
ADAGIO,
• Changed portfolio mix to focus on growth. EDINBURGH,
UNITED KINGDOM
• >45% direct investment property invested in
CEE.
• Reaffirming target 8.75i euro cents per share
for the full year, covered by distributable
earnings.
Quality acquisitions and developments
• Acquired in excess of €300 million of assets
since June year-end.
• Substantial opportunities to extract value
and growth.
Strong platform for growth
• 2 year extension of Prime Kapital exclusivity –
until 2023.
• PKM development pipeline – >600,000 m².
• Recycling of capital a key focus.
Based on the acquisition and development pipeline in place and further opportunities being
i
pursued. It also assumes that a stable macro-economic environment will prevail, no major
corporate failures will occur, the investments and developments reported on above will
progress as expected and budgeted rental income based on contractual escalations as well as
market-related renewals will be collected. This target has not been reviewed or audited by the
group’s auditors .
21 MAS REAL ESTATE INC RESULTS PRESENTATION 2019DISCLAIMER This document does not constitute an offer for securities or other interests in MAS Real Estate Inc., nor does it purport to solicit offers to subscribe for securities or interests in MAS Real Estate Inc. This document does not constitute an offer for the sale of or subscription for, or the solicitation of an offer to buy and subscribe for, securities to the public as defined in the South African Companies Act, No. 71 of 2008 (as amended or otherwise) and must not be distributed to any person in South Africa in any manner which could be construed as an offer to the public in terms of Chapter 4 of the said Act. This document does not constitute an offer of securities to the public in the United Kingdom. This communication is directed only at (i) persons who are outside the United Kingdom or (ii) persons who have professional experience in matters relating to investments who are investment professionals falling within Article 19(5) of the Financial Services and Markets Act 2000 (Financial Promotion) Order 2005 (the “Order”), (iii) high net worth entities falling within Article 49(2) of the Order and (iv) other persons to whom it may lawfully be communicated (all such persons together being referred to as “relevant persons”). Any investment activity to which this communication relates will only be available to, and will only be engaged with, relevant persons. Any person who is not a relevant person should not act or rely on this document or any of its contents. Any offer of securities to the public that may be deemed to be made pursuant to this communication in any EEA Member State that has implemented Directive 2003/71/EC (together with any applicable implementing measures in any Member State, the “Prospectus Directive”) is only addressed to qualified investors in that Member State within the meaning of the Prospectus Directive. This document does not constitute an offer of securities for sale or the solicitation of an offer to buy, nor shall there be any sale of the securities referred to herein in the United States, Canada, Australia, Japan or any other jurisdiction in which such offer, solicitation or sale would be unlawful prior to registration, exemption from registration or qualification under the securities laws of any such jurisdiction. In particular the shares in MAS have not been, and will not be, registered under the United States Securities Act of 1933 as amended (the “Securities Act”) or qualified for sale under the laws of any state of the United States or under the applicable laws of any of Canada, Australia or Japan and, subject to certain exceptions, may not be offered or sold in the United States or to, or for the account or benefit of, US persons (as such term is defined in Regulation S under the Securities Act) or to any national, resident or citizen of Canada, Australia or Japan. Neither this document nor any copy of it may be distributed directly or indirectly to any persons with addresses in the United States of America (or any of its territories or possessions), Canada, Australia or Japan, or to any corporation, partnership or other entity created or organised under the laws thereof, or in any other country where such distribution may lead to a breach of any legal or regulatory requirement. MAS Real Estate Inc. disclaims any obligation or undertaking to release publicly any update, review or revise any forward looking statement contained in this document whether as a result of new information, future developments or otherwise or any change in events, conditions or circumstances on which any such statement is based. 22 MAS REAL ESTATE INC RESULTS PRESENTATION 2019
info@masrei.com | www.masrei.com
You can also read