Investor Presentation - May 2021 - eHealth, Inc.

Page created by Andy Stanley
 
CONTINUE READING
Investor Presentation - May 2021 - eHealth, Inc.
Investor
Presentation
          May 2021
Investor Presentation - May 2021 - eHealth, Inc.
eHealth at a Glance

                                                                  Leading E-Commerce Platform for Health Insurance Distribution

                                                              $583M                                    $91M*                                      12M                                    873K                                       37%
Leading health
insurance marketplace                                                                                                                            2020                                 Estimated                           2020 Major Medical
                                                                                                                                            Unique Annual                              Medicare                                 Online
with differentiated                                         2020 Revenue                        2020 Adj. EBITDA(1)
                                                                                                                                            Online Visitors                          Membership(3)                           Enrollment(5)
capabilities

                                                             ↑ 26%                                    ↑ 39%                                      200+                                  100K+                                  ↑ 86%
                                                                                                     Approved
Growing market share                                     2019-2020 YoY                              MA Members                                 Carrier                             Customer Center
                                                                                                                                                                                                                              Online Major
                                                                                                                                                                                                                             Medical Apps
                                                        Revenue Growth(2)                          2019-2020 YoY                           Partnerships(3)(4)                        Sign-Ups(3)
                                                                                                                                                                                                                             2019-2020 YoY

                                                           *Effective with the first quarter of 2021, we modified the calculation of adjusted EBITDA to exclude the amortization of capitalized software
                                                                                  development costs. Amortization of capitalized software development costs were $7.8 million in FY 2020.

         (1) Adjusted EBITDA is calculated by adding stock-based compensation expense, depreciation and amortization,                 (3) As of 3/31/2021.
             amortization of intangible assets, other income, net, and provision (benefit) for income taxes to GAAP net income (loss) (4) Includes Medicare, IFP, SMB and ancillary products at a sub-carrier level.
         (2) Fourth quarter 2019 and FY 2019 revenue and adjusted EBITDA exclude the positive impact of $42.3 million in revenue (5) Represents the % of 2020 Major Medical applications (MA+MS) that were online unassisted (no agent assistance
             resulting from a change in estimate for expected cash commission collections relating to existing Medicare Advantage         throughout enrollment process) and online assisted (application / enrollment submitted online, with some agent
                                                                                                                                                                                                                                                           2
             plans enrolled in prior to the fourth quarter of 2019. Excluding this positive impact, 2019 revenue was $464 Million.        involvement before submission by the consumer online)
             Including this positive impact, 2019 revenue was $506 Million.
Investor Presentation - May 2021 - eHealth, Inc.
Selecting Health Insurance is Challenging for
Consumers
Millions of Americans shopping for Health Insurance

Proliferation of Medicare Advantage Plans (36% growth in                                                         Only 1 out of 10
number of plans between 2018 and 2020 AEP)(1) adding
                                                                                                                 of Medicare
Further Complexity to an Already Challenging Process
                                                                                                                 beneficiaries
                                                                                                                 enrolled in
Traditional brokers offer Limited Choices                                                                        optimal plan(2)

Stakes High with consequence of making wrong decision
potentially devastating

Today’s environment drives significant need for customer-centric shopping and enrollment platform
            (1) Source: Medicare Advantage 2020 Spotlight: First Look, Kaiser Family Foundation, October 2019.
            (2) Source: Medicare Choice and Impact Report, eHealth, September 2018.
                                                                                                                                    3
Investor Presentation - May 2021 - eHealth, Inc.
Importance of Transparency in Digital Purchases
Need for Transparency

                        Consequence of Wrong Decision

                                                        4
Investor Presentation - May 2021 - eHealth, Inc.
eHealth Leverages Technology to Solve Critical
Challenges in a Large and Growing Market
  Industry Today

    Face-to-face interaction                              Omni-channel experience

    Narrow consumer choice                                Broad marketplace of plans

    Opaque price and coverage                             Full transparency

    Little to no research                                 Easy comparison shopping

    Complexity                                            Ease of transaction

                 eHealth empowers consumers with choice and transparency,
                        using the Company’s online shopping platform
                                                                                       5
Investor Presentation - May 2021 - eHealth, Inc.
Large and Growing Medicare Opportunity
Supported by Powerful Tailwinds
Medicare Advantage (MA) & Medicare                                                                                                                                                                      eHealth 2020
                                                                           Medicare Enrollees(1)
Supplement (MS) plan enrollment                                            (individuals mm)                                                                                                              Enrollment
expected to grow 37% between 2020
and 2028(1)                                                   Growth DriversMA & MS                                                                                                                       Growth

                                                                                                                                                                                                              10x
                                                                                                                                                 Other

Number of Medicare Advantage plans                                                                                                                             77
expected to increase 30% between                                                                                                   70                                                                  Growth rate of
2019 and 2021 AEP(2)                                                                                    63                                                                                             total Medicare
                                                                                                                                                                                                           Market
Penetration of Medicare Advantage
plans grew from 13% of total Medicare                                                                                                                                                                  Enrollments(6)
beneficiaries in 2005 to 40% in 2020(4)

$17bn+ TAM is largely untapped(5)
                                                                                                                                                                                                                  3x
                                                                                                        2020                       2024                       2028
                                                                                                                                                                                                       Growth rate of
                                                                             MA+MS                       39M                       46M                        53M
                                                                                                                                                                                                        MA Market(7)
                                                                             MA+MS
                                                                                                         62%                       66%                        70%
                                                                             Penetration
               (1) Source: CSG Actuarial; National Bureau of Economic Research.                                                  (5) Calculated by multiplying the number of individuals in the addressable market (63 Million) by average commission
               (2) Source: Medicare Advantage 2021 Spotlight: First Look, Kaiser Family Foundation, October 2020.                    collections per member collected by eHealth from Medicare policies in 2020 ($270 including MA, MS and PDP
               (3) Defined as the total number of MA approved policies between eHealth, GoHealth, and SelectQuote divided by the     members). 63 Million x $270 = $17.0 Billion.                                                                       6
                   number of total MA opportunities available for 2019.                                                          (6) FY 2020 Total Medicare enrollments grew 2.3%; eHealth estimated membership grew 23.3%.
               (4) Source: CMS November 2020 estimate.                                                                           (7) FY 2020 Total Medicare Advantage enrollments grew 9.3%; eHealth estimated membership grew 31.7%.
Investor Presentation - May 2021 - eHealth, Inc.
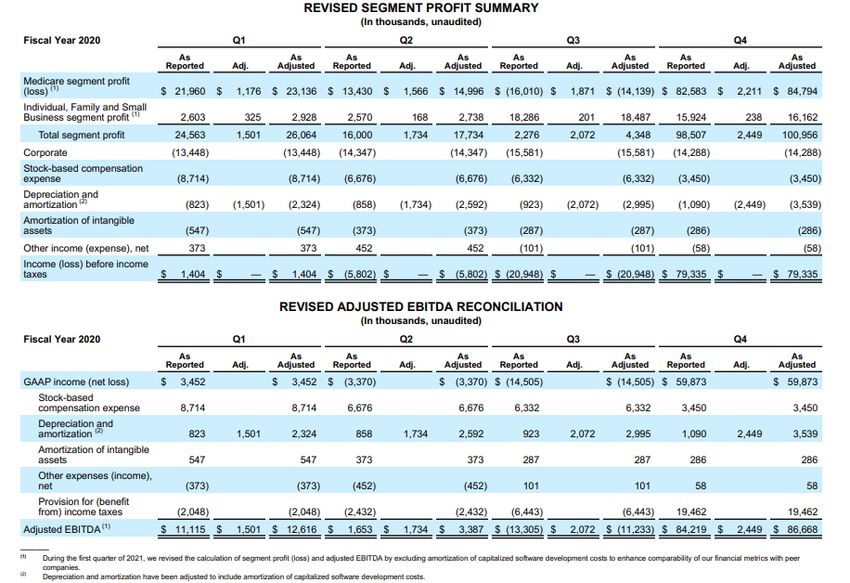
Strongly Positioned to Benefit from Increasing
Digital Adoption
     Secular Shift is Driving Online Usage                                                         eHealth Is Digitizing Medicare Shopping and Enrollment
                                                                                                       Fully Unassisted & Partially Agent Assisted Online Enrollments
                  % Internet Usage by Age                   Group(1)                                           (As % of Total MA & MS eHealth Applications)

                                                                  75%
           57%

                         Internet usage for
                           65+ age group

          2014E                                                 2021E

 Medicare distribution                                 Secular shift driving online                   Online enrollment enables            Broad consumer adoption of
 channels are rapidly shifting                         usage: 74% of seniors likely                   superior scaling vs. call            online shopping provides
 to DTC and e-commerce                                 to make a purchase online(2)                   center and direct in-person          strong tailwind
                                                                                                      sales models

                           eHealth’s strong online enrollment capabilities will allow the Company to
                                    significantly outpace its peers as it continues to scale
            (1) “Internet/Broadband Fact Sheet” (Pew Research Center, 2021).                                                                                            7
            (2) “Technology Use and Attitudes among Mid-Life and Older Americans” AARP Research.
Scratching the Surface of a Significant TAM

                                                                                                                                                             Today      Illustrative Opportunity*

                                                                                                                               Market size
Total Medicare
enrollment(1)
                                                                       62M                                                     (people)(1)
                                                                                                                                                             62M      62M       62M         62M

Individual Medicare                                                                                                            Market share                  ~1%      4%         6%         8%
Advantage and                                                            38M
Medicare Supplement
enrollment(1)                                                                                                                  Members                      0.9M(2)   2.5M      3.7M       5.0M

eHealth
                                                                           0.9M                                                         $17B+ current addressable Medicare market*
membership(2)

                 (1) Source: CMS.
                 (2) Estimated eHealth Medicare membership as of 3/31/2021.
                 *Calculated by multiplying the number of individuals in the addressable market (62 Million) by average commission collections per member                                           8
                 collected by eHealth from Medicare policies in 2019 ($270 including MA, MS and PDP members). 62 Million x $270 = $16.7 Billion.
Leading Health Insurance Distribution Platform
                                                                              Grew 10x Rate of total
   Omni-Channel is a Major                                                                                                 Taking Share From
                                                                              Medicare Market Enrollment
   Competitive Differentiator                                                                                              Traditional Channels
                                                                              Growth in 2020(1)
                                                                                             DTC Competitors         Traditional Brokers    Carriers
Broad Plan Selection                                                                                Mixed
Customer-First,                                                                                   Limited –
Carrier Agnostic                                                                              conflict of interest
Actively Enrolling
Online
Best-in-Class
Digital Experience
Agent Support

Scalability

              Based on company’s assessment of market participants’ capabilities.                                                                      9
              (1) Total Medicare enrollments grew 2.3%; eHealth estimated membership grew 23.3%.
Significant Value Proposition for Consumers and
Carriers

                            ~873K
                           Estimated
                                                                                            200+
                                                                                      Carrier Partnerships(1)(2)
                     Medicare Membership(1)

     (1) As of 3/31/2021.
     (2) Includes Medicare, IFP, SMB and ancillary products at a sub-carrier level.
                                                                                                                   10
Multi-Channel Customer Acquisition Strategy

                          TV

                                  Email

                                                     Television

                                             SEO

        Multi-Channel                                             Email
          Strategy                           Paid
                                            search

                                                                          SEO
                                 Partners

                        Direct
                         Mail
                                                                                Retail Pharmacy Partners

      Leveraging 20+ years of investments, technology and know-how to drive consumer
                               engagement at an attractive ROI

                                                                                                      12
Proven Brand and Digital Marketing Strategy

           Strong organic search results

     Medicare                        Individual & Family                                                   Dental                                                 Vision                                       Small Business

                                                                                          1.                                                      1.                                                     1.

2.                                 2.

           For IFP, Medicare and SMB based on STAT Enterprise Search Analytics. IFP = average share of voice for 1000 tracked high value keywords excluding brand name searches over the last 90 days, as of 2/25/20. Medicare = average share
           of voice for 2000 tracked high value keywords over the last 90 days, as of 2/25/20. SMB = average share of voice for 300 tracked high value keywords over the last 90 days, as of 2/25/20. For Dental: SEMrush, position tracked for the
           high search volume keyword “dental insurance”, validated by search engine results page as of 2/25/20. For Vision: Source: SEMrush, position tracked for the high search volume keyword “vision insurance”, validated by search engine      13
           results page as of 2/25/20.
Differentiated Technology Powers our Customer
Engagement Cycle
     eHealth Differentiation          Data Analytics to
•   Online enrollment capability
                                      drive attractive               e-Commerce
                                      ROI demand

•   Real time drug formulary
    and physician network data
                                       Omni-Channel
                                                                     Technology                    Carrier
                                         Demand                       Platform
•   Unified recommendation                                                                       Integration
    platform supporting both            Generation
    agents and online
    consumers
                                      Customer
•   Text & email plan proposals                                        Telesales
                                      Intelligence and
    for hybrid enrollment             Lead Scoring
    approach

      Moving away from over-reliance on call centers to empowering consumers with an omni-channel experience
                                                                                                               14
Telesales: Shifting to a Predominantly Internal
Agent-driven Model

              Flex Agent
                Capacity                                                Technology Drives
                                   High-Value                           Customer Value
                Remote
               Full-time           Customer Engagement                  and Efficiency
                Agents
                                    • Broad Choice                      • Data-driven Lead Scoring &
                                    • Decision Support Algorithms         Allocation
               Network of           • Proprietary Educational           • Proprietary Agent Tools
    Established Customer              Content                           • Customer Care Center
             Care centers           • Customer retention team           • Granular LTV forecast on a
                                                                          submitted application level

                   Leveraging robust technology platform to empower our agents

                                                                                                        15
1   Drive organic growth momentum

        2    Increase consumer engagement / retention

              3    Deepen online penetration

                    4    Maintain discipline on improving member economics
2021
Business                   5    Expand/Deepen strategic partner relationships

Goals                            6    Leverage technology leadership

                                                                                16
Executing on 2021 Goals: eHealth Q1 2021
Results
First quarter revenue
and adjusted EBITDA(2)                                         Revenue of $134.2M grew 26%                                                                                  Total acquisition costs per approved
                                                               compared to Q1 2020                                                                                          Medicare member declined 12%
significantly exceeded
                                                                                                                                                                            with agent cost per approved
our expectations.
                                                                                                                                                                            member down 24% compared to
                                                                                                                                                                            Q1 2020
Enhancements to call
center operations led                                         Adjusted EBITDA(2) of $17.3M,                                                                                 35% of Medicare major medical
to a meaningful                                               compared to $12.6M in Q1 2020;                                                                                applications submitted online,
increase in our agent                                         Net Loss of $0.8M                                                                                             compared to 24% in Q1 2020(1)
productivity

                                                              Medicare Advantage approved                                                                                   Net cash provided by operating
                                                              members grew 65% year-over-                                                                                   activities of $42.8M compared to
                                                              year                                                                                                          $8.9M in Q1 2020

                                           Effective with the first quarter of 2021, we modified the calculation of adjusted EBITDA to exclude the amortization of
                                           capitalized software development costs. The amortization of capitalized software development costs was $2.8 million
                                           and $1.5 million for the first quarter of 2021 and 2020, respectively.

              (1) Major Medicare plans include Medicare Advantage and Medicare Supplement plans; Online submission % represents a combination of unassisted and partially agent-assisted online enrollments.
              (2) Adjusted EBITDA is calculated by excluding the impacts of interest income and expense, income tax expense (benefit), depreciation and amortization, stock-based compensation expense, restructuring and reorganization charges,
                  purchase price adjustments, amortization of intangible assets, other income (expenses), net, convertible preferred stock dividends, amortization of capitalized software development costs and other non-recurring charges to GAAP net
                  income (loss). Other non-recurring charges to GAAP net income (loss) may include transaction expenses in connection with capital raising transactions (whether debt, equity or equity-linked) and acquisitions, whether or not
                  consummated, and the cumulative effect of a change in accounting principles. Effective with the first quarter of 2021, we modified the calculation of adjusted EBITDA to exclude the amortization of capitalized software development
                  costs. The amortization of capitalized software development costs was $2.8 million and $1.5 million for the first quarter of 2021 and 2020, respectively.
Strong Financial Fundamentals
                                                                              •        Q1 2021: 65% YoY Medicare Advantage Approved Member growth
     Core Medicare Business                                                   •        Q1 2021: 35% of Medicare major medical applications submitted online, compared to
                                                                                       24% in Q1 2020(1)
                                                                              •        Estimated membership: ~873K(2)

     Other Businesses
                                                                              •        IFP: Generates positive cash flow and provides option for future growth
                                                                              •        Small Business: Growing with potential to disrupt a large, highly fragmented market

                                                                              •        Operating leverage: Revenues are expected to outpace fixed costs growth
     Improving Profitability
                                                                              •        Variable costs: Sales agent costs expected to grow slower than revenues
     & Operating Leverage
                                                                              •        Reinvest operating leverage from online enrollments to accelerate growth

     Strong Balance Sheet
                                                                              •        $130M in Cash and Equivalents as of 3/31/2021
                                                                              •        $742M in Commissions Receivable as of 3/31/2021
                                                                              •        No debt; access to $75M Line of Credit(3)

     (1) Number of submitted applications for major Medicare products – Medicare Advantage & Medicare Supplement.
     (2) As of March 2021.                                                                                                                                          18
     (3) Actual availability is the lesser of $75mm and the Borrowing Base, which may be reduced from time to time pursuant to the Credit Agreement
eHealth: a Strong, Differentiated Growth Engine
Medicare Advantage Approved Members                                                                                                Medicare Approved Members
(In Thousands)                                                                                                                     (In Thousands)
600K                                                                                                                                  600K
                                                                                                                                                                                    3 Year CAGR:                                                     503
                       3 Year CAGR:
                                                                                                                                                                                        42%                            435
                           49%                                                                          388                           400K
400K
                                                                          280                                                                                                            240
                                                                                                                                                           176
200K
                118                         148                                                                                       200K

  0K                                                                                                                                     0K

                2017                       2018                          2019                          2020                                               2017                          2018                          2019                          2020
                                                                                                                                                                                        (1)
Medicare Segment Revenue                                                                                                           Medicare Segment Profit
(In Millions)                                                                                                                      (In Millions)
 $600M
                                                                                                        $517                                                                        3 Year CAGR:                              (2)
                                                                                  (2)                                                                                                   70%                           $116                         $109
                                                                                                                                     $120M
                                                                           $405
 $400M                 3 Year CAGR:
                           54%
                                                                                                                                       $80M                                              $62
                                             $211
 $200M           $142
                                                                                                                                       $40M                 $22

   $0M                                                                                                                                  $0M
                 2017                        2018                          2019                         2020                                              2017                          2018                          2019                         2020

            (1) During the first quarter of 2021, we modified the calculation of segment profit and adjusted EBITDA to exclude the amortization of capitalized software development cost. Amortization of capitalized software development costs within our
                Medicare Segment were $0.1 million in FY 2017, $0.7 million in FY 2018, $2.8 million in FY 2019 and $6.8 million in FY 2020. The modified calculation better aligns this non-GAAP metric to those of our peer companies. For additional
                information, see the earnings release issued by eHealth, Inc. on April 29, 2021 announcing its first quarter results for Revised Segment Profit Summary and Revised Adjusted EBITDA Reconciliation.                                           19
            (2) FY 2019 revenue and adjusted EBITDA exclude the positive impact of $42.3 million in revenue resulting from a change in estimate for expected cash commission collections relating to existing Medicare Advantage plans enrolled in prior
                to the fourth quarter of 2019.
Attractive Mix Driving Revenue and Adjusted
EBITDA Growth
Medicare Revenue as                                                                Total Revenue                                                                                 Total Adjusted EBITDA(2)
% of Total Revenue                                                                 ($mm)                                                                                         ($mm)
                                                                                                                                                                                                                      $137(1)
                                                                                                                                           $583

                                                                                                                         $506(1)
                                                                                                                         $464                                                                                            $95              $91

 75%                                     89%
                                                                                                         $251
                                                                                       $191                                                                                                            $36

  2017                                    2020
                                                                                                                                                                                       $6

                                                                                        2017             2018              2019             2020                                      2017             2018             2019              2020

         (1) Fourth quarter 2019 and FY 2019 revenue and adjusted EBITDA exclude the positive impact of $42.3 million in revenue resulting from a change in estimate for expected cash commission collections relating to existing Medicare
             Advantage plans enrolled in prior to the fourth quarter of 2019.
         (2) Adjusted EBITDA is calculated by adding stock-based compensation expense, depreciation and amortization, amortization of intangible assets, other income, net, and provision (benefit) for income taxes to GAAP net income (loss).
             During the first quarter of 2021, we modified the calculation of segment profit and adjusted EBITDA to exclude the amortization of capitalized software development cost. Amortization of capitalized software development costs were
                                                                                                                                                                                                                                                       20
             $1.5 million in FY 2017, $2.2 million in FY 2018, $3.8 million in FY 2019, and $7.8 million in FY 2020. The modified calculation better aligns this non-GAAP metric to those of our peer companies. For additional information, see the
             earnings release issued by eHealth, Inc. on April 29, 2021 announcing its first quarter results for Revised Segment Profit Summary and Revised Adjusted EBITDA Reconciliation.
Trailing Twelve Months (“TTM”) Medicare
Segment Commissions Cash Collections
Q1 21 TTM Medicare
Segment commissions                              TTM Medicare Segment Commissions Cash Collections
cash collections
                                                ($MM)
increased by 39%
year-over-year

Q1 21 TTM Medicare
Segment commissions
cash collections per
MA equivalent
member(1) of $431
grew 11% year-over-
year

                                                                                                                                                                                                                      (TTM)

             (1) MA Equivalent member is calculated as the total number of estimated Medicare Advantage and Medicare Supplement membership and 25% of the estimated Medicare Part D membership during the period presented.

                                                                                                                                                                                                                              21
eHealth – Growth and Digitization Strong…and
Just Getting Started
     A leading provider of consumer-first health e-commerce solutions

     Core Medicare market has strong long-term tailwinds

     Omni-channel platform enables high growth and creates strong barriers to entry

     Online enrollment and expanding telesales platforms driving revenue and profit growth well
     above market rates

     Strong balance sheet and potential for meaningful cash flow generation as we scale

                                                                                                  22
Appendix
Reconciliation of GAAP to Non-GAAP Financial
Measures

                                               24
You can also read