2017 RESULTS - Ebro Foods
←
→
Page content transcription
If your browser does not render page correctly, please read the page content below
2017 RESULTS

               1
CONTENTS
    BUSINESS UNIT RESULTS 2017

    1.1 Rice
    1.2 Pasta

    EBRO FOODS CONSOLIDATED RESULTS 2017

    2.1 P&L
    2.2 Sales distribution by area
    2.3 Debt performance

    CONCLUSION

    CORPORATE CALENDAR 2018

    LEGAL DISCLAIMER

                                           2
1. BUSINESS UNIT RESULTS
2017

                           3
1.1 RICE DIVISION

                    4
RICE
 During the last quarter we have seen higher inflation in the different rice markets, due to a variety of reasons:
      In southern Europe, a shortage of water in some regions may lead to a lower volume 18/19 harvest. Farmers
      are behaving more conservatively, which is creating price tensions compared with previous years.
      In Southeast Asia the waning of the Thai surplus meant that specific upturns in demand in countries like
      Indonesia and the Philippines, etc. could not be covered so easily, and before the arrival of the second harvest
      prices underwent a sharp increase of 15% in just a couple of weeks.
      In the USA, the harvest was particularly short in important rice-producing regions (Arkansas), and this,
      combined with heavy sales under special treaties (Iraq/USA), is also driving prices upwards.
      As regards aromatic varieties, basmati and jasmine rice from regions of designated origin, we have found that
      a significant rise in demand, combined with structural limits on production and restrictions on pesticide use
      have had a negative effect on prices.

 As regards the commercial performance of our different platforms in 2017:
       Herba has launched more than 80 new products, essentially linked to “convenience”, and almost all the brands
       have extended their portfolios to associated categories, such as ancient grains and pulses. We have achieved
       growth in terms of both volume and value, especially in the greater added value segments. Of particular note
       are the good results obtained in Germany and India.

      As regards the North American business, we had a record year in terms of both profitability and market share,
      despite the costs associated with hurricane Harvey. The categories that have seen the greatest growth are
      RTS and aromatics, which in both cases have grown significantly above market levels. The most recent
      product launches have mainly involved organics, ancient grain mixtures and couscous.

                                                                                                                     5
RICE 2017 Results
 Division sales grew by 4.8% to EUR1,345 million, owing to the recovery of sales in the USA following the hurricane
 and the strong performance of European business.

 Advertising, an important tool in the Group’s strategy, has remained at a level that is in line with the launch of new
 products, falling by just EUR2 million.

 The division’s Ebitda climbed by 5% to EUR206 million, increasing by a considerable 8% in terms of CAGR 17/15.
 The significant rise in the value of the dollar over the last financial year had a negative impact of EUR3.2 million on
 the division’s Ebitda.

 Operating profit grew 2.8% to EUR174 million; growing 8.2% in terms of CAGR 17/15.

                        EUR Thous.          2015        2016        2017       17/16   CAGR 17/15
                        Sales              1,287,726   1,283,853   1,345,026      4.8%        2.2%
                        Advertising           28,988      30,135      28,088     -6.8%       -1.6%
                        Ebitda               176,959     196,264     205,988      5.0%        7.9%
                        Ebitda Margin         13.7%       15.3%       15.3%
                        Ebit                147,509     163,561     172,522       5.5%       8.1%
                        Operating Profit    148,600     169,240     174,027       2.8%       8.2%

                                                                                                                       6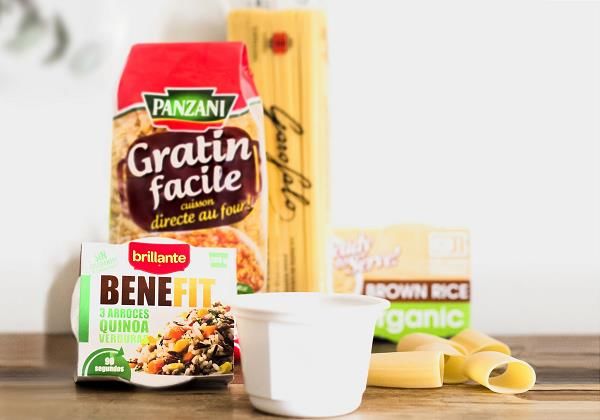
1.2 PASTA DIVISION

                     7
PASTA
 In Europe, the price of durum wheat experienced a significant spike over the summer, though this was corrected
 during the last part of the year as prices returned to the levels seen a year ago. In North America, the durum wheat
 market rallied during the summer on the back of fears of a poor harvest. In the autumn, the market returned to
 normality, though this situation has led to an increase in costs of around USD5 million in relation to our wheat
 supplies in the region.

 In 2017, Panzani was affected by the poor durum wheat harvest in France and the good harvest in Italy, which has
 meant that competitors established in Italy have enjoyed a price advantage and gained position in the more
 competitive products. Nevertheless, Panzani has consolidated its results and shown significant growth (5-13%)
 across all the categories in which it operates, with the exception of sauces.

 Riviana Pasta is dealing with a category that has shrunk by 1.3% during 2017, though its decline is not even half
 the percentage experienced by the market as a whole. Against this background, its brands have increased their
 market share. Its “Gluten Free” and “Super Greens” product categories are showing satisfactory growth, as to a
 lesser extent are its “Organics”.

 Garofalo continues to register double-digit growth, with returns growing significantly and the brand firmly
 establishing its Premium position. It is important to mention that we have begun to distribute Garofalo US through
 Riviana.

                                                                                                                    8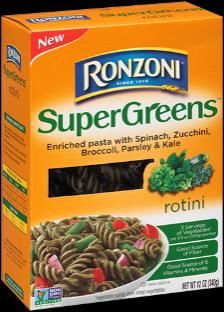
PASTA 2017 Results
 Division sales declined by 1.4% to EUR1,218 million, hit by the situation in North America.

 Advertising investment fell by EUR4.6 million to EUR66.2 million, mainly due to the strategy refocus in the US
 market.

 Ebitda grew 3.7% to EUR163 million. Currency exchange had a negative effect of EUR0.7 million.

 Operating Profit grew by 9.4%, to EUR102 million, due to the lack of extraordinary costs, in contrast with last year.

                         EUR Thous.        2015     2016      2017     17/16 CAGR 17/15
                         Sales           1,224,491 1,236,227 1,218,404   -1.4%     -0.2%
                         Advertising        58,173    70,840    66,154   -6.6%      6.6%
                         Ebitda            148,647   157,089   162,977    3.7%      4.7%
                         Ebitda Margin      12.1%     12.7%     13.4%     5.3%      5.0%
                         Ebit              110,477   113,544   117,420    3.4%      3.1%
                         Operating Profit 104,957     93,294   102,050    9.4%     -1.4%

                                                                                                                         9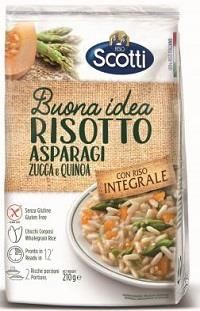
2. EBRO FOODS CONSOLIDATED RESULTS 2017

                                          10
2.1 P&L 2017
Group sales grew by 1.9% to EUR2,507 million, owing to the strong performance of the rice division.
Advertising investment temporarily fell by 7%, although in terms of CAGR 17/15 it increased by almost 3%. It
should be remembered that promotional marketing is now included in the (net) turnover figure, and a balance
between promotion and advertising is sought when providing support for brands.
Ebitda grew by 4.3% to EUR359 million, and the Ebitda margin climbed by 300 b.p. to 14.3%. Currency exchange
had a negative effect of EUR4 million on the Ebitda. At a constant value and exchange rate, the Ebitda figure would
stand at EUR359 million, with organic growth of 4%.
Operating Profit increased by 2.4%; particularly notable among other operational income items were the sale of a
plot of land in Houston and the sale of buildings in Lisbon and Madrid, along with allowance provisions for brand
depreciation in North America.
Net profit increased 30% to EUR220.6 million. This significant increase was mainly due to the tax-related measures
recently approved in the USA, which have led to net deferred tax amounts being updated to reflect the new rate
(down from 35% to 21%). Extraordinary income of EUR50.6 million has therefore been entered in the accounts in
respect of company tax.
EUR Thous. 2015 2016 2017 17/16 CAGR 17/15
Sales 2,461,915 2,459,246 2,506,969 1.9% 0.9%
Advertising 87,017 100,401 93,134 -7.2% 3.5%
Ebitda 314,724 344,141 359,000 4.3% 6.8%
Ebitda Margin 12.8% 14.0% 14.3%
Ebit 246,314 267,308 279,314 4.5% 6.5%
Operating Profit 242,377 264,608 271,079 2.4% 5.8%
Pre-tax Profit 229,722 259,410 264,131 1.8% 7.2%
Net Profit 144,846 169,724 220,600 30.0% 23.4%
ROCE 15.6 16.6 16.6
112.2 Sales Distribution by Area
As a result of the new tax reforms in the USA, which from 2018 will mean a reduction in outgoing tax payments of
around USD15-16 million, we feel it is appropriate to recall the significant contribution that sales made by the North
American business represent within the Group.
Sales 2016 Sales 2017
North Spain
North Spain
America 6.7%
America 6.0%
38.9% 37.0%
Western
Western Europe Others Europe
Others 47.8% 7.5% 48.8%
7.3%
122.3 Debt Performance
At year-end we have increased debt levels by EUR74 million, ending the year with a Net Debt of EUR517 million
after having carried out several investments in organic and non-organic development.
Debt stands at around 1.4 times the Ebitda figure, which represents a low level of debt that will allow us to maintain
a high level of flexibility when considering the Group’s inorganic development. Thus, following closure of the
accounts, in January 2018 we announced a binding agreement for the acquisition of a 70% stake in the Italian
company Bertagni 1882 (“Bertagni”). For the purposes of this transaction, Bertagni is valued at EUR130 million (the
value of 100% of the company, i.e. before any potential adjustment for debt).
Thous EUR 31 Dec 15 31 Dec 16 31 Dec 17 17/16 CARG 17/15
Net Debt 426.280 443.206 517.185 16,7% 10,1%
Average Debt 424.940 404.137 426.042 5,4% 0,1%
Equity 1.966.259 2.079.326 2.074.637 -0,2% 2,7%
Leverage ND 21,7% 21,3% 24,9% 17,0% 7,2%
Leverage AD 21,6% 19,4% 20,5% 5,7% -2,5%
x Ebitda (ND) 1,35 1,29 1,44
x Ebitda (AD) 1,4 1,2 1,2
13CONCLUSION
14Conclusion
The effects of inflation on raw materials in the rice division during the second half of the year did not prevent the
business from achieving a record year. The wisdom of the division’s strategy for diversification in terms of origin has
been borne out, allowing us to maintain an efficient supply line, though it is true that in 2018 our raw materials will
be more expensive.
Panzani has had a very good year as far as high-value products are concerned, though its more competitive
products have suffered as a result of the lower costs of its competitors.
Riviana Pasta is continuing with the reactivation of its brands, redefining its strategy in a digital environment. It is
also making investments to increase the flexibility of its products, formats and packaging.
The Group is placing particular importance on positioning the company, its brands and its products in the health,
convenience and premium segments. The strategies used are both organic development (e.g. pulses, ancient
grains), and the completion of acquisitions (Celnat, Vegetalia, Geovita, and the recent announcement of an
agreement to purchase Bertagni). This is the path that we shall continue to pursue in 2018.
15CORPORATE CALENDAR
As part of Ebro’s commitment to complete transparency, below we provide our Corporate Calendar for 2018:
28 February Presentation of YE2017 Results
3 April Four-month payment of ordinary dividend (EUR0.19/share)
25 April Presentation of 1Q Results
29 June Four-month payment of ordinary dividend (EUR0.19/share)
25 July Presentation of 1H results
1 October Four-month payment of ordinary dividend (EUR0.19/share)
24 October Presentation of 9M18 Results and Pre-YE 2018
16Legal Disclaimer
This presentation contains our true understanding to date of estimates on the future growth in the different business
lines and the global business, market share, financial results and other aspects of business activity and the positioning of
the Company. All the data included in this report has been put together according to International Accounting Standards
(IAS). The information included herein does not represent a guarantee of any future actions that maybe taken and it
entails risks and uncertainty. The true results may be materially different from the ones stated in our estimates as a
result of various factors.
Analysts and investors should not rely on these estimates, which only cover up to the date of this presentation. Ebro
Foods does not assume any obligation to publicly report the results of any review of these estimates that may be carried
out to reflect events and circumstances occurring after the date of this presentation - including but not limited to -
changes in Ebro Foods business or its acquisitions strategy, or to reflect unforeseen events. We encourage analysts and
investors to consult the Company’s Annual Report, as well as the documents filed with the Authorities and more
specifically with the Spanish National Securities Markets Commission (CNMV).
The main risks and uncertainties affecting the Group’s business are the same as those included in Note 28 of the
Consolidated Annual Accounts and the Management Report for the year ending 31 December 2016, which is available at
www.ebrofoods.es. We believe that there have been no significant changes during this financial year. The Group still has
some exposure to the raw materials markets and to passing on changes in prices to its customers. Likewise, there is
certain exposure to fluctuations in the exchange rate, especially the dollar, and changes in interest rates.
According to the guidelines set by the European Securities and Markets Authority (ESMA), the following is a list of the
indicators used in this report. These indicators are currently and consistently used by the Group to describe its business
performance and their definitions have not been altered:
Ebitda. Earnings before interest, taxes, depreciation and amortization, excluding results considered as
extraordinary or non-recurring (essentially profit earned from transactions relating to the Group’s fixed assets,
industrial restructuring costs, results from or provisions for lawsuits, etc.).
31/12/2015 31/12/2016 31/12/2017 Dif 17/16
EBITDA 314,724 344,141 359,000 14,589
Provision for amortisation -68,410 -76,833 -79,686 -2,853
Non-recurring income 8,110 25,598 11,144 -14,454
Non-recurring costs -12,047 -28,298 -19,379 8,919
OPERATING PROFIT 242,377 264,608 271,079 6,951
Net debt. Financial liabilities with cost, the value of shares and put/call options qualified as such, and where
applicable, dividends that have accrued and are pending payment, minus cash and cash equivalents.
CAPEX. Capital expenditure - payments for investment in production related fixed assets.
ROCE. Return on capital employed – a measure on yield on assets calculated as income before tax and interest
minus any income regarded as extraordinary or non-recurring for the period considered, divided by Net Average
Assets for the period, minus Financial Assets and Goodwill.
17You can also read