RESULTS 2019 PHARMA SECTOR - Reig Jofre
←
→
Page content transcription
If your browser does not render page correctly, please read the page content below

RESULTS
2019
P H A R M A   S E C T O R

DISCLO
                         SURE

                                                                                               This presentation may contain forward looking statements including statements regarding
                                                                                               Reig Jofre’s intent, belief or current expectations with respect to the businesses and
                                                                                               operations, market conditions, results of operation and financial condition, capital
                                                                                               adequacy, specific provisions and risk management practices. Readers are cautioned not
                                                                                               to place undue reliance on these forward-looking statements.
This presentation contains no confidential material and may include publicly available
market information which has not been independently verified by Reig Jofre.                    Reig Jofre does not undertake any obligation to publicly release the result of any
                                                                                               revisions to these forward-looking statements to reflect the occurrence of unanticipated
This information is given in summary form and does not purport to be complete.                 events. While due care has been used in the preparation of forecast information, actual
Information in this presentation should not be considered as advice or a recommendation        results may vary in a materially positive or negative manner. Forecasts and hypothetical
to investors or potential investors in relation to holding, purchasing or selling Reig Jofre   examples are subject to uncertainty and contingencies outside Reig Jofre’s control.
shares and does not take into account your particular investment objectives, financial
situation or needs.                                                                            Past performance is not a reliable indication of future performance.
                                                                                                                                                                                          PAGE   2
01. REIG JOFRE TODAY

TABLE OF   02. EVOLUTION OF THE BUSINESS UNITS

CONTENTS   03. INTERNATIONAL PROGRESS

           04. PROFIT AND LOSS ACCOUNT

           05. BALANCE SHEET

           06. CYCLE CHANGE

           07. SHAREHOLDER BASE

           08. LINKS TO ADDITIONAL INFORMATION

                                                 PAGE   3
01.
LET’S TALK ABOUT

REIG JOFRE
TODAY

           4
REIG JOFRE TODAY                                                      PHARMACEUTICAL COMPANY FOCUSED ON THE RESEARCH, DEVELOPMENT,
                                                                          MANUFACTURE AND MARKETING OF PHARMACEUTICAL PRODUCTS AND
                                                                          NUTRITIONAL SUPPLEMENTS

3   G E N E R A T I O N S    A T      T H E        H E A D    O F     T H E       B U S I N E S S       Y E A R S S I N C E      T E A M                   T I C K E R
                                                                                                        F O U N D I N G

     1929
     Ramon Reig Jofre
     Founder
                            1970
                            Joan M. Biosca
                            Founder’s son-in-law
                                                        2006
                                                        Ignasi Biosca
                                                        Founder’s grandson and current CEO
                                                                                                          90 1121
                                                                                                             Founded in
                                                                                                          Barcelona in 1929                58%   42%
                                                                                                                                                           RJF
                                                                                                                                                           Quoted on the Spanish stock
                                                                                                                                                           exchange’s main market since 2015

                                                                                                                                            DEBT/                            EXPANSION
                                                                 SALES                         EBITDA                          NET
                                                                                                                                            EBITDA                             CAPEX
                                                                                                                              PROFIT

                                                             200            M€               19.7        M€                   4.9   M€     2.67        X                22.2                   M€

        PHARMA                                                   +11%                           +20%

        SECTOR
                                                         MAIN FIGURES
                                                        2019 closing Var. vs 2018

                                                                                                                                                                                     PAGE           5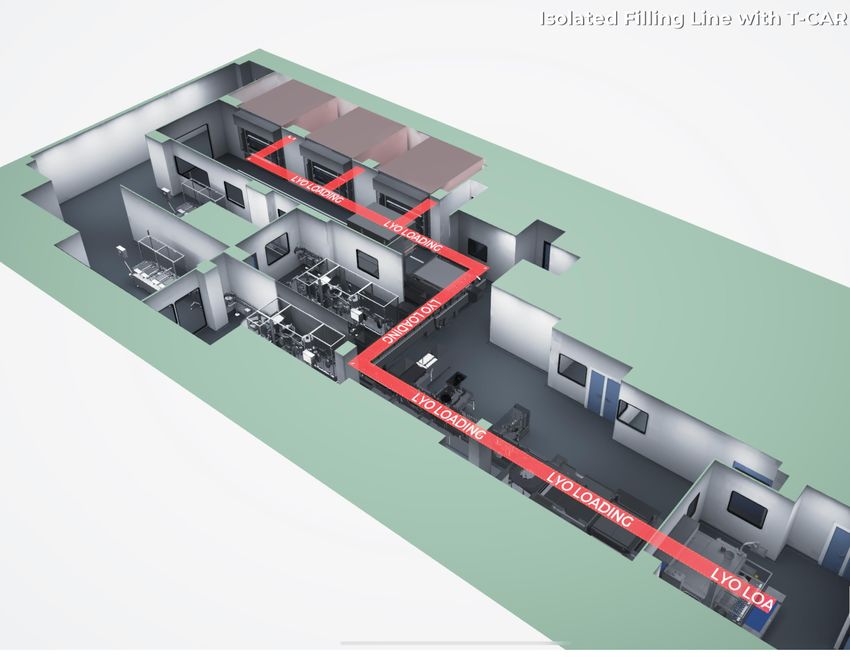
02.
LET’S TALK ABOUT

EVOLUTION OF THE
BUSINESS UNITS

                   6
2019
                                                        SALES

BUSINESS UNITS                                       200        M€
                                                        +11%

PHARMACEUTICAL                        SPECIALTY                                      CONSUMER
TECHNOLOGIES                          PHARMACARE                                     HEALTHCARE
Antibiotics                           Skin, hair and nails health                    Weight control
Injectables / lyophilized             Joint health & pain                            Energy
                                      Women’s health                                 Stress & sleep disorders
                                                                                     Beauty

                            99.5 M€                                  51.7 M€                                    49.0 M€
50%                          +2%        26%                           +41%           24%                         +6%
                     B2Business                                     B2Professional
                                                         B2Professional                               B2Consumer B2Consumer

                                                                                                                    PAGE   7
EVOLUTION OF THE BUSINESS UNITS

PHARMACEUTICAL                                                      SPECIALTY                                              CONSUMER
TECHNOLOGIES                                                        PHARMACARE                                             HEALTHCARE
1. Key player                                                       Joint health & pain                                    Caring vs healing

• 30% worldwide of remifentanil vials                               New therapeutic area integration in S2-19              Growth + 9% French market
• 25% beta-lactam antibiotics consumed in Spain                     Impact on sales (+ €13 M) in Spain mainly and Nordic   Historical leadership in weight control, enhanced with growth in
                                                                    markets                                                new categories:
2.   Product diversification
                                                                                                                           • Health: probiotics, sleep disorders, ENT
                                                                    Leading brands
• The main molecule (amoxicillin alone or in combination with                                                              • Drinkable natural energy (+ vitamins)
  clavulanic acid), does not concentrate more than 10% of           Condrosan
  sales                                                             Droglican

3. Geographic diversification

•    60% international positive evolution in Asia (Japan + 24% in
     2019)

                                                                                                                           • greater balance of the ranges
25 new commercial authorizations (of about 250 total
approx.) of 8 different molecules (of the 80 total approx.)
                                                                    Skin, hair and nails health                            • greater geographic diversification
in 20 countries
                                                                    Main leading brands
                                                                                                                                DISTRIBUTION OF PRODUCT RANGE                                SALES DISTRIBUTION BY COUNTRIES
                                                                    Complidermol 5α franchise
                                                                                                                                2006-2019                                                    2019
New line of injectable antibiotics Toledo                           Ony-tec                                                      76%                                                              %                       1%
• 2020: first full year impact on sales                                                                                                                                                         3  Africa & Middle East
                                                                                                                                                                                                                           Rest

                                                                    Zalve
                                                                                                                                        33 %
                                                                                                                                                                2006    2019
                                                                                                                                                                                              11%Benelux

New lyophilized injectable aseptic production plant
                                                                                                                                                     28%        12%
                                                                                                                                                                            11%        15%
                                                                                                                                                                                             26 %
                                                                                                                                                                                               Iberia
                                                                                                                                                10%        10%
Barcelona                                                                                                                                                              4%         0%
• 2021: start operations and sales                                                                                             Weight Control   Energy      Health     Beauty     Others        62%     France            PAGE    8
03.
LET’S TALK ABOUT

INTERNATIONAL
PROGRESS

            9
INTERNATIONAL PROGRESS                                                                                                        SALES
                                                                                                                               2019

                                                                                            BELGIUM
                                                                                                      SWEDEN
                                                                                                                        200           M€
                                                                                   UNITED
                                                                                  KINGDOM

     DIRECT SALE                                                                                                                             TOTAL
                                                                         FRANCE
      COUNTRIES                                                                                                                            COUNTRIES

            7                                                         PORTUGAL
                                                                                                                                            72

  120                                                                                                                                      130
                                                                         SPAIN

                                                                                                                                                       BUSINESS
                         M€                                                                                                                            PARTNERS

E M P L O Y E E   G E O G R A P H I C A L   D I S T R I B U T I O N
                                                                                                                  SINGAPORE
                                                                                                                                            80         M€

                            9,5%
                            F R A N C E

                                                 Benelux
                                      3%         Portugal
                                                 United Kingdom
                                                 Singapore
78%
S P A I N                             9,5%
                                      S W E D E N

                                                                          45%                    45%
                                                                                                R E S T   O F
                                                                                                                10%
                                                                                                                R E S T    O F
                                                                          S P A I N
                                                                                                E U R O P E     T H E     W O R L D                    PAGE       10
04.
LET’S TALK ABOUT
PROFIT & LOSS
ACCOUNT
PAGE 11200 milion €
Sales
P&L
Profit and Loss Account 2019 2018
Sales + 11%
Gross
Margin 63%
on Sales
EBITDA + 20%
19,7
P&L 2019 expressed with IFRS 16 application, treatment of leases as asset amortization
milion €
EBITDA PAGE 12P&L
19,7 milion €
EBITDA Profit and Loss Account 2019 2018
EBITDA
10%
on Sales
Depreciation
6,5%
on Sales
Financial
Result 0,6%
on Sales
5,3
milion € Other results include
PROFIT Allocation of Grants
Impairment and gains or losses on disposals of non-current assets
BEFORE TAXES PAGE 13
Results from entities valued using the equity methodAcquisition of Joint Health and Pain Portfolio
Impacts on Profit and Loss Account | 2nd half of 2019
01 Sales 02 Amortization of 03 Non recurrent
Intangibles Transaction Costs
+ 13,3 n
milion € [1 semester]
- 2,4
milion € [1 semester]
- 2,3 milion €
Total of 51 people join RJF, P&L impacts in Personnel Intangible Assets (brands, products) depreciated over Integration Operational Expenses, M&A
Expenses, R+D, Salesforce and Marketing. a 10 year period Advisory, Legal and other Expenses related to
Overheads Structure is not incorporated Capital Increase in June 2019
Profitability of the new therapeutic area does not have relevant incremental Overheads associated, thus bringing in higher than average profitability to Reig Jofre as a result.
Intangible assets associated with the products and brands acquired are amortized according to their estimated useful life. Goodwill is not amortized in IFRS
PAGE 14Adjusted P&L 2019 Adjusted
Adjusted Profit and Loss Account
2019 2018
22,0
milion €
ADJUSTED EBITDA
*
7,6
milion €
NIIF 16 Adjustment
ADJUSTED PROFIT
Transactional Costs Adjustment BEFORE TAX
* INTANGIBLE DEPRECIATION FOR THE NEW PORTFOLIO 2,4 M€
Depreciation Expenses in 2019 include a 2,4 milion € impact, related to the
half year depreciation of Intangible Assets acquired on July 1th. PAGE 1505.
LET’S TALK ABOUT
BALANCE
SHEET
PAGE 16Balance Sheet 2019
A SSETS LIABILITIES
TOTAL BALANCE SHEET
Intangible
116 M
Equity
178 M
314
Assets milion €
220
84
milion €
Property, Plant
19
and Equipment M
Other non-current
18
liabilities M 2019 2018
63
Other Non-Current
Assets M
M
96
Financial Debt
+94
54
Current VARIATION
Assets M Other current 2019|2018
liabilities M milion €
PAGE 17Balance Sheet 2019
A SSETS LIABILITIES
217 M 178 M
EQUITY
NON-CURRENT ASSETS NON FINANCIAL
LIABILITIES 34 M
47 M NET FINANCIAL
DEBT
53 M
WORKING CAPITAL
PAGE 18A SSETS VAR 2019-2018
INVESTMENTS
2019 Investments 2019 71M
+79 71M
217 M + Investment in Financial Assets
net variation CAPEX
M 1,2 M New technologies and
increase in capacity
2019 R+D
22,2 M
CAPITALISED
New
+ 5,6M Injectable
Plant (17,1M)
NIIF 16
IMPACT
Joint Health and
13M
48,1 M
Pain portfolio
NON-CURRENT ASSETS
+ acquisition
WORKING
47 +5
CAPITAL/SALES
M
WORKING CAPITAL
M
24% + 11% + 11P %
AGE 19L IABILITIES V AR 2019-2018 Balance Sheet 2019
178 M +28
EQUITY
M 24,5 M - 0,8 M 4,1 M
CAPITAL INCR. DIVIDEND
EQUITY CORP.OPERATION [-359 K€]+
+ CAP.INCREASE TREASURY STOCK 2019 RESULTS +
SCRIP [0,5M] [-238 k€] OTHER
NON FINANCIAL
LIABILITIES 34 M +28 M
NON FINANCIAL
LIABILITIES
2M
GRANTS
26 M
OTHER
TAXES LIABILITIES
NET FINANCIAL
DEBT
53 M +28 NET
M 12,8 M 11,6 M 5,7 M
FINANCIAL DEBT NON CURRENT CURRENT
NIIF 16 LIABILITIES LIABILITIES
PAGE 20DEBT/EBITDA FINANCIAL DEBT
13
LEASE DEBT
APPLICATION OF NIIF 16
NET FINANCIAL DEBT M
GROSS
FINANCIAL DEBT
53
milion €
63 M
BANK DEBTS
50 M
24
milion € Loans 24% Financial Leases
57%
AVERAGE
2019 2018 MATURITY
3 years Credit
facilities 8%
DEBT / EBITDA
COST OF DEBT Public Organizations
2,67 1,49
Debts 11%
2019
1,95%
Variable
Fixed Rate 66%
Rate 34%
2019 2018
PAGE 2106.
LET’S TALK ABOUT
BUILDING UP
REIG JOFRE 2025
PAGE 22Strategic plan REIG JOFRE 2020
Strategic plan Strategic plan
2020 2025
2020
2015
PAGE 23REIG JOFRE 2013 - 2019
Sales evolution EBITDA evolution
milion € milion €
200 19,7
180
168 17,1
161 15,8 16,4
153 157 15,0
14,3
13,5
118
2013 2014 2015 2016 2017 2018 2019 2013 2014 2015 2016 2017 2018 2019
Expenditure evolution + R+D Investment INVESTMENT evolution 71,5
milion € milion €
11,8
10,6
9,9
9,1
16,1
6,5 6,6 6,6 13,0
11,8
10,0
4,5
3,7
2013 2014 2015 2016 2017 2018 2019 PAGE 24
2013 2014 2015 2016 2017 2018 2019INVESTMENTS 2015-2019
INORGANIC GROWTH | NEW TECHNOLOGIES AND R&D PROJECTS [EXPENSE +
BRANDS EXTENSION CAPACITY INVESTMENT]
52M 40M
profitability horizon
48M
profitability horizon
profitability horizon
2020 2020-2023 2021-2025
PAGE 25Building up REIG JOFRE
2025
STRATEGIC PLAN STRATEGIC PLAN
2020 2025
2020
2015
PAGE 26INVESTMENTS 2015-2019
NEW TECHNOLOGIES AND PROJECTS [EXPENSE + INVESTMENT]
INORGANIC GROWTH BRANDS |
EXTENSION CAPACITY R&D
JV
1 2 3
2014 NEW ANTIBIOTICS LINE
2017-2019 TOLEDO
6%
FORTE PHARMA sales
NEW INJECTABLE PLANT
2016 2018-2020 BARCELONA
6
Pharmaceutical
RJ UK Technologies
Consumer
M 17,2 Healthcare
11% 54%
2019
9,0
JOIN HEALTH
48 M
3,2
4,8
5,8
Specialty
Pharmacare
35%
2.016 2.017 2.018 2.019 2.020
52 M
40 M 48 M
PAGE 27Non-Organic Growth
1
Acquisition Business Health and Joint Pain
Acquisition July 2019 Opportunity Strategic fit.
Growing market
✓ Aging ► New Business Integration Experience
► € 26M Annual Sales ✓ Overweight ► Know How in Marketing Product of
✓ Exercise wear Medical Visit (professional)
► Medication and Nutrition
► Pharmacy (consumer)
Supplements Portfolio 44 M€
6 M€
► Capacity of New Developments and
144 M€
► National 90% International 10% solutions in the therapeutic area
87 M€
► International Growth, supported by
► New Therapeutic Area Group Companies and RJF International
TAM Dic 2011 TAM Junio 2019
Fuente: IMS/HMR Partners
The profitability of the new therapeutic area, since it does not have relevant incremental Overheads associated, is higher than the average of Reig Jofre before the acquisition PAGE
282 New Technologies and Capacity Expansion
Plant Extension New Plant Lyophilized
Toledo antibiotics Injectables Barcelona
Demand Demand
• Access to new markets, new innovative
products and non-patent biological or
Capacity chemical base
• 33% capacity increase
• 25 M annual vials
Demand Capacity Capacity
• 50 M vials at full capacity (vs 15 M in
Specialization 2016 and 3.5 M in 2008)
• Compulsory specialization of dedicated
plants
Quality
• Aseptic Production
• Few world producers
Profitability • Insulator Technology, without human
contact
• Global product: International growth • Products with more added value
platform
Efficiency
• Cutting-edge technology markets with • Automated process
higher profitability • 20% increase in productivity
Fully operational 2020 Fully operational 2021 PAGE 292 New Technologies and Capacity Expansion
New Plant Lyophilized Injectables Barcelona
PAGE 303 Strategy and Pipeline R&D
RJF +University
100% RJF In-house - COLLABORATION +
+Start-up
PHARMACEUTICALS PHARMACEUTICALS/MEDICAL DEVICE
(time to market) /FOOD SUPPLEMENT
(time to market)
• UNDER DEVELOPMENT (>2 years) • UNDER DEVELOPMENT (>2 years)
• 3 Injectable/lyophilised • Biosimilar
• 2 β-lactam antibiotic
• CLINICAL DATA PRESENTATION
• Fungic infection – Phase III (>2 years)
• PLANNED SUBMISSION (2 years) • Nife-Par – Post Approval
• 1 β-lactam antibiotic • GynEC – Post Approval
• UNDER SUBMISSION (1 year)
• UNDER SUBMISSION (1 year) • Impetigo
• 3 Injectable/lyophilised
• 2 β-lactam antibiotic • PRE-MARKET
• Nail regeneration
• Men fertiliy
• Molluscum
Out of patent - INNOVATION + Patented
PAGEREIG JOFRE 2020 - 2025
STABILITY PROFITABILITY
CAPEX INVESTMENT
Investment effort in
Industrial Capacity
focused on recurring Generation Business
CAPEX Investments made
2016-2020
PAGE 3207.
LET’S TALK ABOUT
SHAREHOLDER
BASE
PAGE 33SHAREHOLDERS
BASE
31/12/2019
Free Float evolution Scrip Dividend Remuneration of 0,045€/share with cash option payment or
subscription of new shares. 87,3% of shareholders subscribed the
May 2019
Capital increase. Issued 1M new shares [1,5% Capital]
2017 13,5%
Capital Bookbuilding process to Main Investors 24M€
Increase Issued 10M new shares @ 2,40 €/share.
2018 15,7% June 2019 Entry of new main shareholders: Onchena, Quaero Capital
23% international investors, Mix retail/institutionals
2019 21,2%
Shareholder change Entry of a main shareholder Kaizaharra with 10,1%, due to the
Novembre 2019 acquisition of Natra’s stake PAGE 34RJF share performance in 2019
2,85
Analysts Coverage
Closing
Price
2,70 Solventis
2,52€
2,55
Bankinter
2,40
Estrategias de Inversión
2,25
2,10
1,95
31/12 31/01 28/02 31/03 30/04 31/05 30/06 31/07 31/08 30/09 31/10 30/11 31/12
Share Profitability 10,5% Target Value
Estimated by analysts
3,80 3,66
Highlights
2019
► Joint the IBEX SMALL CAP December 2019
► Regular Roadshows in Spain, Portugal, France and UK €/share €/share
► Temporary Share Buy-back Program H2 2019
► Liquidity Contract January 2020
PAGE 3508.
LET’S TALK ABOUT
ADDITIONAL
INFORMATION
36A SSETS thousand euros 31/12/2019 31/12/2018
ASSETS
Goodwill 29.730 27.598
Other intangible assets 85.879 39.121
Property, plant and equipment 83.917 54.728
Investments in equity-accounted investees 1.220 307
Non-current financial assets measured at fair value 1.204 1.167
Other non-current financial assets 658 425
Deferred tax assets 14.585 14.469
TOTAL NON-CURRENT ASSETS 217.193 137.815
Inventories 38.353 34.563
Trade and other receivables 40.542 33.856
Current tax assets 4.144 11
Other current financial assets 924 2.687
Other current assets 2.288 2.474
Cash and cash equivalents 10.171 8.269
TOTAL CURRENT ASSETS 96.422 81.860
TOTAL ASSETS 313.615 219.675
PAGE 37L IABILITIES thousand euros
EQUITY AND LIABILITIES
31/12/2019 31/12/2018
Share capital 38.031 32.525
Share Premium 19.000 0
Reserves 118.559 110.183
Treasury shares -1.138 -900
Own equity instruments 62 34
Profit attributable to the parent company 4.942 9.266
Exchange differences -1.146 -1.193
Other comprehensive income -110 -115
Equity attributable to parent company 178.200 149.800
Non-controlling interests -62 -59
TOTAL EQUITY 178.138 149.741
Capital grants 1.729 105
Provisions 897 803
Financial liabilities with credit institutions 8.893 7.020
Lease liabilities 33.603 14.036
Other financial liabilities 5.681 5.683
Deferred tax liabilities 3.103 3.242
Other non current liabilites 13.000 0
TOTAL NON-CURRENT LIABILITIES 66.907 30.889
Provisions 82 45
Financial liabilities with credit institutions 6.518 3.649
Lease liabilities 7.582 1.536
Other financial liabilities 542 808
Trade and other payables 36.241 29.911
Current tax liabilities 2.508 902
Other current liabilities 15.098 2.194
TOTAL CURRENT LIABILITIES 68.571 39.045
TOTAL EQUITY AND LIABILITIES 313.615 219.675
PAGE 38P ROFIT & thousand euros 31/12/2019 31/12/2018
L OSS
Turnover 200.207 180.468
Procurements -75.426 -70.267
Changes in inventories 1.515 2.648
Gross margin 126.296 112.848
Work carried out for fixed assets 5.625 4.824
Other operating income 94 839
Personnel expenses -57.132 -52.140
Other operating expenses -55.192 -49.979
EBITDA 19.691 16.393
Depreciation and amortization -13.148 -7.605
Government grants for non-financial assets and others 23 40
Impairment and results on disposals -243 1.192
Operating income 6.323 10.020
Financial expenses -1.048 -768
Other financial income¬expenses -85 76
Financial result -1.133 -692
Results from entities accounted by the equity method 113 155
Profit before taxes 5.303 9.483
Income tax -364 -231
Net result 4.939 9.252
Adjusted EBITDA (IFRS 16 + Transaction Costs) 19.284 16.393
PAGE 39LINKS TO ADDITIONAL INFORMATION
LAST NEWS
www.reigjofre.com/en/news
WEBCAST OF RESULTS
http://www.reigjofre.com/en/investors/webcasts
SUBSCRIPTION CENTER
http://www.reigjofre.com/en/news/subscription-center
PAGE 40Tabla de
Av. de les Flors
08970 Sant Joan Despi Barcelona, Spain
T. +34 93 480 67 10
www.reigjofre.com
Investor Relations
investors@reigjofre.com
41You can also read