RESULTS Q2 2020 ANALYST CONFERENCE CALL CEWE STIFTUNG & CO. KGAA AUGUST 6, 2020 - CEWE IR

Page created by Marshall Sanders
 
CONTINUE READING
RESULTS Q2 2020 ANALYST CONFERENCE CALL CEWE STIFTUNG & CO. KGAA AUGUST 6, 2020 - CEWE IR
Results Q2 2020
Analyst Conference Call

CEWE Stiftung & Co. KGaA

August 6, 2020
RESULTS Q2 2020 ANALYST CONFERENCE CALL CEWE STIFTUNG & CO. KGAA AUGUST 6, 2020 - CEWE IR
This presentation contains forward-looking statements that are based on current assumptions and
    forecasts of the management of CEWE. Known and unknown risks, uncertainties and other factors
    could lead to material differences between the forward-looking statements given here and the actual
    development, in particular the results, financial situation and performance of our Company. The
    Company assumes no liability to update these forward-looking statements or to conform them to future
    events or developments.

    All numbers are calculated as exactly as possible and rounded for the presentation. Due to this,
    rounding differences might occur.

2
RESULTS Q2 2020 ANALYST CONFERENCE CALL CEWE STIFTUNG & CO. KGAA AUGUST 6, 2020 - CEWE IR
Dr. Olaf Holzkämper   Dr. Christian Friege
    CFO                   CEO

3
RESULTS Q2 2020 ANALYST CONFERENCE CALL CEWE STIFTUNG & CO. KGAA AUGUST 6, 2020 - CEWE IR
CEWE acts with clear priorities in Corona crisis

     1   We focus on health and safety of our employees

     2   We secure production capabilities of our laboratories and printing plants

     3   We keep online and mobile sites up and communicate with our customers

     4   We ensure cost reductions and review investments

     5   We prepare the re-start of Retail and Commercial Online-Print

     6   We seek „Corona-upsides“

 4
RESULTS Q2 2020 ANALYST CONFERENCE CALL CEWE STIFTUNG & CO. KGAA AUGUST 6, 2020 - CEWE IR
Photofinishing overcompensates corona-driven declines in
COD and Retail: EBIT in Q2 EUR 2.4 million ahead of PY
ƒ       Turnover in Photofinishing rose also due to coronavirus-related “stay-at-home” effect by strong
        13.8% to EUR 110.6 million, EBIT improved by exceptional EUR 6.3 million to EUR 5.1 million.
        Sales of the CEWE PHOTOBOOK increased by 11.1% to 1.37 million copies. Besides additional
        contributions to profits from the increase in sales, the cost-reduction programme initiated as early as
        in March also improved the EBIT.

ƒ       Commercial Online-Print is significantly affected by the corona crisis, turnover at EUR 10.9
        million is 56.5% below the previous year's level. Efficient cost management and the conversion to
        performance-oriented depreciation kept the decline in earnings under control: EBIT of EUR -2.8
        million is EUR 1.7 million weaker than in the previous year.

ƒ       The corona shutdown hits (Hardware-)Retail, turnover declines by 28.8% to EUR 7.6 million.
        Continuation of the optimisation strategy accelerated: EBIT of EUR -3.2 million includes EUR -1.7
        million for shop closures and EUR -1.5 million value adjustments on stocks.

ƒ       Group EBIT is EUR 2.4 million ahead of last year’s EBIT: EUR -1.0 million (Q2 2019: EUR -3.4
        million). All in all a good second quarter.

    5
RESULTS Q2 2020 ANALYST CONFERENCE CALL CEWE STIFTUNG & CO. KGAA AUGUST 6, 2020 - CEWE IR
CEWE recognized by
Deloitte, Wirtschaftswoche, Credit Suisse and BDI

 6
RESULTS Q2 2020 ANALYST CONFERENCE CALL CEWE STIFTUNG & CO. KGAA AUGUST 6, 2020 - CEWE IR
Agenda
1. Corporate Development by Business Segments

  1.1 Photofinishing
  1.2 Retail
  1.3 Commercial Online-Print
  1.4 Other

2. Group Results

3. Financial Details

4. Q&A-Session
RESULTS Q2 2020 ANALYST CONFERENCE CALL CEWE STIFTUNG & CO. KGAA AUGUST 6, 2020 - CEWE IR
1.1
Photofinishing
RESULTS Q2 2020 ANALYST CONFERENCE CALL CEWE STIFTUNG & CO. KGAA AUGUST 6, 2020 - CEWE IR
Boots: First shops up and running

                                                                                                       E-commerce
                                                                                     In-house          Website                    App
                                                                                     production

                                                                     Marketing
                                                                     approach

                                                                                                                                        Desktop
                                                                                                                                        software

                                                    360° Content
                                                    (all channels)

                                                                                                                                         Online
                                                                                                                                         software

                                                  KPI measurement/
                                                  dashboard

                                                                                                                                   In-Store
                                                                                                                                   solution
                                                                                                                                   (Kiosk)
    “Boots Photo powered by CEWE”                            Storage
                                                             (customer
                                                             projects)
    New strategic partnership in UK and Ireland                                                                     In-Store
                                                                                                                    maintenance
                                                                                 Delivery
                                                                                 in stores &      Customer
                                                                                 at home          services (24/7)

9
RESULTS Q2 2020 ANALYST CONFERENCE CALL CEWE STIFTUNG & CO. KGAA AUGUST 6, 2020 - CEWE IR
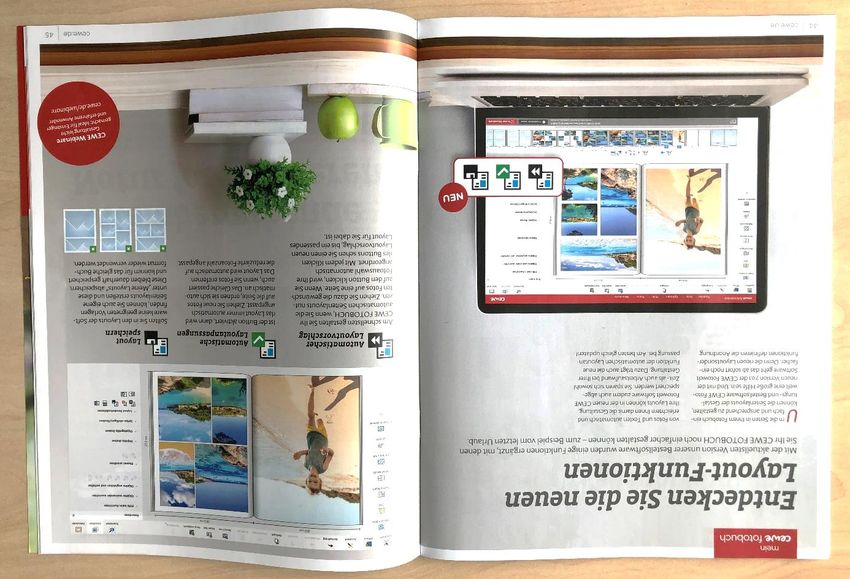
CEWE ordering software with new layout features

                                                  Automatic
                                                  layout proposal

                                                  Automatic
                                                  layout adjustment

                                                  Save layout

  10
Number of prints and turnover Photofinishing Q2
                                                                                                                                 +13.8%
Total prints
in millions                                  Value per photo                  +10.8%   Turnover Photofinishing
                                             Turnover / photo                          in Euro millions
                                             (Euro cent / photo)                                                                110.6
                             +2.7%
                            pre-corona                                        23.78                                  97.2
                         perspective 2020:
                            +2% to +4%                                21.46                                85.9
                                                              19.85                    81.1     82.1
                                                      19.36
                                             18.36
                      453      465
 442     424   432

2016    2017   2018   2019    2020           2016    2017     2018    2019    2020     2016     2017       2018      2019       2020

     Rising share of value-added-products increases turnover per photo
     WhiteWall supports increase of turnover per photo
                                                                                              Rounding differences may occur.
11
Number of prints and turnover Photofinishing H1
                                  +1.5%                                                                                           +12.2%
                                  pre-corona
                              perspective 2020 :                                        +10.6%     Turnover photofinishing
 Total prints                    +2% to +4%        Value per photo
 in millions                                       Turnover / photo                                in Euro millions
                                                                                                                                      225.3
                                  973
                                                   (Eurocent / photo)
                       959
 924                                                                                     23.15
                898                                                                                                       200.8
         862                                                                    20.93                            180.3
                                                             19.46      20.07
                                                                                                 166.6   167.7
                                                    18.02

2016    2017    2018   2019       2020              2016    2017        2018    2019     2020    2016    2017    2018     2019        2020

                                                                                                                         Rounding differences may occur.
     Rising share of value-added-products increases turnover per photo
     WhiteWall supports increase of turnover per photo
12
CEWE PHOTOBOOK Q2 und H1
 Number of CEWE PHOTOBOOKS Q2                              Number of CEWE PHOTOBOOKS H1
 in thousands                            +11.1%            in thousands                                            +6.5%
                                          pre-corona                                                               pre-corona
                                       perspective 2020:                                                        perspective 2020:
                                         +2% bis +4%                                                              +2% bis +4%
                                                                                                   2,732
                                     1,369                                            2,566
                                                           2,474
                                                                           2,369
                                                                   2,279
                             1,232
     1,197

             1,120   1,121

     2016    2017    2018    2019    2020                  2016    2017    2018        2019         2020
                                                                              Rounding differences may occur.

     CEWE PHOTOBOOK with strong growth in Q2 also due to corona-related “stay-at-home”effect

13
Photofinishing-Turnover by Quarter
Seasonal distribution: CEWE 2016 to 2020 – Share in turnover by quarter as a million
                                                                                                                                                        251.1
                                                                                                                                                218.3
                                                                                                                                  190.0 195.4

                                      114.7                                                                               116.2
                     94.5
                             103.5                                                    97.2
                                                                                              110.6   95.4   96.3 100.5
     85.5   85.6                                           81.1     82.1     85.9

 2016 2017 2018 2019 e2020                                 2016 2017 2018 2019 e2020                  2016 2017 2018 2019 e2020   2016 2017 2018 2019 e2020
                                                                                                                                       Rounding differences may occur.
Turnover pre-corona                     Q1 pre-corona                          Q2 pre-corona
perspective* 2020                       perspective*                           perspective*
approx. 588 to 613 m€**                 111.7 to 116.5 m€                      100.0 to 104.2 m€

!         Comparison
       against pre-corona
       perspective* 2020
                                        Q1 Actual
                                        114.7 m€            9                   Q2 Actual
                                                                                110.6 m€
                                                                                                 9
      Photophinishing turnover in Q2 is clearly above the range of pre-corona perspective* for 2020
       * due to corona situation no targets have been set for 2020 so far
14     ** group turnover w/o targets of segments retail, commercial online-print and other.
Business segment Photofinishing Q2
in Euro millions                                                ƒ   Photofinishing also grew thanks to the coronavirus-related “stay-
                                                                    at-home” effect (customers used the time spent at home to order
                                                                    photo products - including products using older photos from the
  Umsatz
  Turnover                                                          past) by a good 13.8% in Q2
                                                       +13.8%
                                                                ƒ   Acquired wall-art specialist WhiteWall still contributed non-
                                                                    organically to this growth in April and May
          81.1      82.1       85.9       97.2      110.6

                                                                ƒ   Photofinishing EBIT grew by a highly presentable 6.3 million
         2016       2017       2018      2019       2020            euros

   EBIT                                                         ƒ   Besides additional contributions to profits from the increase in
                                                                    turnover, the cost-reduction programme initiated as early as in
                                                                    March also improved the EBIT against that of the previous year
                      0.2                               5.1

           -0.7                  -1.8        -1.2               ƒ   Q2 2020 special effects: -1.1 million euros
                                                                           Effects from the DeinDesign purchase-price allocation: -0.1 million euros
                                                                           Effects from the Cheerz purchase-price allocation: -0.5 million euros
          2016       2017       2018        2019       2020
                                                                           Effects from the WhiteWall purchase-price allocation: -0.5 million euros

                                                                ƒ   Previous-year special effects in Q2 2019: -0.7 million euros
        Coronavirus-related “stay-at-home” results in                      Effects from the DeinDesign purchase-price allocation: -0.1 million euros
        additional sales in Q2 and, together with cost                     Effects from the Cheerz purchase-price allocation: -0.5 million euros
                                                                           Effects from the WhiteWall purchase-price allocation: -0.1 million euros
        reductions, in a considerable improvement to earnings

   15                                                                                       Rounding differences may occur.
Business segment Photofinishing H1
in Euro millions                                              ƒ   Photofinishing grew by a very positive 12.2% in Q2 2020, with
                                                                  acquired wall-art specialist WhiteWall still contributing non-organically
    Umsatz                                                        to this growth in the period from January to May
   Turnover
                                                    +12.2%    ƒ   As of mid-March the coronavirus pandemic also had an impact on
                                                                  photofinishing: Instant-print POS business was affected by shop
                              180.3      200.8      225.3         closures, while online photofinishing business saw the “stay-at-home”
           166.6    167.7
                                                                  effect having a positive influence on incoming orders

           2016     2017      2018       2019       2020

   EBIT
                                                              ƒ   Photofinishing EBIT grew by a highly presentable 6.6 million euros

                                                    8.4       ƒ   Besides additional contributions to profits from the increased
          0.5      1.6                   1.8
                                                                  turnover, the cost-reduction programme initiated as early as in March
                             -0.4                                 also improved the EBIT against that of the previous year

                                                              ƒ   HY1 2020 special effects: -2.2 million euros
        2016       2017      2018       2019       2020                 Effects from the DeinDesign purchase-price allocation: -2.2 million euros
                                                                        Effects from the Cheerz purchase-price allocation: -1.0 million euros
                                                                        Effects from the WhiteWall purchase-price allocation: -1.0 million euros
    Marked improvement in photofinishing earnings in HY1
                                                              ƒ   Previous year HY1 2019 special effects: -1.3 million euros
    Also staying at home due to the coronavirus resulted in             Effects from the DeinDesign purchase-price allocation: -0.2 million euros
                                                                        Effects from the Cheerz purchase-price allocation: -1.0 million euros
    additional sales and, together with cost reductions, to             Effects from the WhiteWall purchase-price allocation: -0.1 million euros

    this outstanding improvement
                                                                                                 Rounding differences may occur.
   16
Photofinishing-EBIT by Quarter
     Seasonal distribution: CEWE 2016 to 2020 – EBIT by quarter in % of full year EBIT
     2016 2017 2018 2019 e2020                            2016 2017 2018 2019 e2020
                                                                                                                                          96.1% 96.0%
                                                                                                                            87.9% 89.5%

                                                                                                10.7% 7.6%
     2.3% 2.5% 2.4% 4.4% 5.0%                                                                              4.5% 1.3%
                                                                   0.4%

                                                          -0.9%             -3.1% -1.7% -3.0%   2016 2017 2018 2019 e2020   2016 2017 2018 2019 e2020

                                                                                                                                    Rounding differences may occur.
EBIT pre-corona                        Q1 pre-corona                        Q2 pre-corona
perspective* 2020                      perspective* 2020                    perspective* 2020
64.6 to 70.6 m€**                      +3.2 to +3.5 m€                      -1.9 to -2.1 m€

!      Comparison
    against pre-corona
    perspective* 2020
                                       Q1 Actual
                                       +3.3 m€
                                                        9                   Q2 Actual
                                                                            +5.1 m€

          Q2-EBIT in Photofinishing due to „Corona-stay-at-home“-effect and cost management
                                                                                            9
          clearly above expectations of pre-corona perspective* 2020
          * due to corona situation no targets have been set for 2020 so far
     17   ** group EBIT w/o targets of segments retail, commercial online-print and other
1.2
Retail
Retail with focus on photofinishing business

                                      ƒ Own retail stores in NO, PL, CZ, SK
                                      ƒ Strategic focus on photofinishing and
                                        online business
                                      ƒ EUR 43.7 million revenue (2019) with
                                        photo-hardware (cameras, lenses, …)

      Retail segment contains hardware revenue only, photofinishing
      business is shown in photofinishing segment
19
Business segment Retail* Q2                                   ƒ   As a result of coronavirus-related business closures, hardware
                                                                  retailing was impacted strongly by the shutdown as of mid-
                                                                  March, with Q2 sales dropping by 28.8%
in Euro millions                                              ƒ   Due to a focus on photofinishing business and refraining from
                                                                  low-margin hardware business, the active reduction in sales
                                                                  before the pandemic started was still at around a strategic   -
Turnover
Umsatz * *                                                        10% to -15%

                                                     -28.8%
                                                              ƒ   Coming out of the crisis stronger: CEWE is closing altogether
       14.5       13.2       12.4       10.6                      more than 30 stores in all the countries in which the company
                                                   7.6            conducts retail business
                                                              ƒ   Corona-induced accelerated continuation of optimisation
      2016       2017       2018       2019       2020            strategy with focus on photofinishing and online business
                                                              ƒ   Around 1.7 million euros in restructuring provisions was
EBIT *                                                            allocated for shop closures in Q2
                                                              ƒ   Over and above this, around 1.5 million euros in value
                                                                  adjustments were undertaken on inventory in hardware retailing
       0.0        -0.1        -0.2       -0.3
                                                              ƒ   Before these one-off effects, retailing achieved an operative
                                                    -3.2          EBIT of 0.0 million euros in the second quarter of 2020, an
       2016       2017       2018       2019       2020           improvement of 0.3 million euros (Q2 2019: -0.3 million euros)
                                                              ƒ   Q2 2020 special effects: -3.2 million euros
                                                                     Restructuring provisions for retailing: -1.7 million euros
     Hardware retailing has been strongly affected by                Allowances for inventories of stocks: -1.5 million euros
     coronavirus-related shop closures
                                                              ƒ   Previous-year special effects in Q2 2019: none
     Accelerated continuation of optimisation strategy
     initiated                                                                                * only hardware, no photofinishing
                                                                                               Rounding differences may occur.
20
Business segment Retail* H1                                 ƒ   As a result of coronavirus-related business closures, hardware
                                                                retailing was impacted strongly by the shutdown as of mid-
                                                                March, with HY1 sales dropping by 28.2%
in Euro millions                                            ƒ   Due to a focus on photofinishing business and refraining from
                                                                low-margin hardware business, the active reduction in sales
Umsatz * *
Turnover                                                        before the pandemic started was still at around a strategic   -
                                                                10% to -15%

                                                   -28.2%
                                                            ƒ   Coming out of the crisis stronger: CEWE is closing altogether
       27.3       25.0       23.3       21.0      15.1          more than 30 stores in all the countries in which the company
                                                                conducts retail business
      2016       2017       2018       2019       2020      ƒ   Corona-induced accelerated continuation of optimisation
                                                                strategy with focus on photofinishing and online business
EBIT *                                                      ƒ   Around 1.7 million euros in restructuring provisions were
                                                                allocated for shop closures in HY1
                                                            ƒ   Over and above this, around 1.5 million euros in value
                                                                adjustments were undertaken on inventory in hardware retailing
       -0.4       -0.4       -0.7        -0.7
                                                            ƒ   Before these one-off effects, retailing achieved an operative
                                                    -3.7        EBIT of -0.5 million euros in the first half of 2020, an
                                                                improvement of 0.2 million euros (HY1 2019: -0.7 million euros)
      2016       2017        2018       2019       2020
                                                            ƒ   HY1 2020 special effects: -3.2 million euros

     Hardware retailing has been strongly affected by              Restructuring provisions for retailing: -1.7 million euros
                                                                   Allowances for inventories of stocks: -1.5 million euros
     coronavirus-related shop closures
                                                            ƒ   Previous-year special effects in HY1 2019: none
     Accelerated continuation of optimisation strategy
     initiated                                                                             * only hardware, no photofinishing
21                                                                                          Rounding differences may occur.
1.3
Commercial
Online-Print
Commercial Online-Print

         Industrial printer   Small editions      Metropolitan area
                                                       Berlin

         Business and advertising prints: flyers, business cards,
         stationery, packaging, promotional items, etc.
23
Business segment Commercial Online-Print Q2
in Euro millions                                              ƒ   Since as early as mid-March, COP in B2B printing business has
                                                                  been strongly impacted by the coronavirus, with sales declining
                                                                  very considerably in Q2, by 56.5%
Turnover
 Umsatz
                                                              ƒ   Aggregated as at the end of February, COP was still increasing at
                                                   -56.5%         a single-digit growth rate

                             24.7       25.0                  ƒ   The coronavirus-related decline in sales also caused the EBIT to
        20.7      19.9
                                                   10.9           fall below that of the previous year
                                                              ƒ   Efficient cost management and the conversion to performance-
                                                                  oriented depreciation kept the decline in earnings under control in
       2016       2017       2018      2019       2020
                                                                  spite of heavy losses in turnover
EBIT                                                          ƒ   Coming out of the crisis stronger: In order to ensure that a
                                                                  renewed stimulation of the online printing brands after the
                                                                  coronavirus crisis is focussed and efficient, CEWE will be
                                                                  streamlining the commercial online printing brand portfolio, with a
       0.3
                                                                  focus on the Saxoprint, Viaprinto and Laserline brands
                  -0.3       -1.5       -1.1                  ƒ   Q2 2020 special effects: 0.4 million euros
                                                   -2.8
                                                                        Effects from the Laserline purchase-price allocation: -0.1 million euros
       2016      2017       2018        2019       2020                 Conversion to performance-related AFD for Saxoprint: 0.5 million euros

     In a B2B business environment, COP was hit particularly ƒ    Previous-year special effects in Q2 2019: -0.2 million euros
     strongly by the coronavirus crisis                                 Effects from the Saxoprint purchase-price allocation: -0.1 million euros
                                                                        Effects from the Laserline purchase-price allocation: -0.1 million euros
     Efficient cost management kept the decline in earnings
     under control                                                                            Rounding differences may occur.
24
Business segment Commercial Online-Print H1
in Euro millions                                               ƒ   Since as early as mid-March, COP in B2B printing business has
                                                                   been strongly impacted by the coronavirus, with sales declining
                                                                   very considerably by 33.4% in HY1
Turnover
 Umsatz                                                        ƒ   Aggregated as at the end of February, COP was still increasing at
                                                 -33.4%
                                                                   a single-digit growth rate

                             49.1      50.2                    ƒ   The coronavirus-related decline in sales also caused the EBIT to
       41.1       40.5                            33.4
                                                                   fall below that of the previous year
                                                               ƒ   Efficient cost management and the conversion to performance-
       2016      2017       2018       2019       2020             oriented depreciation kept the decline in earnings under control in
                                                                   spite of heavy losses in turnover
EBIT                                                           ƒ   Coming out of the crisis stronger: In order to ensure that a
                                                                   renewed stimulation of the online printing brands after the
                                                                   coronavirus crisis is focussed and efficient, CEWE will be
       0.8
                                                                   streamlining the commercial online printing brand portfolio, with a
                  -0.2                                             focus on the Saxoprint, Viaprinto and Laserline brands
                             -1.8       -1.4
                                                   -3.4        ƒ   HY1 2020 special effects: 0.5 million euros
       2016      2017        2018       2019       2020
                                                                         Effects from the Laserline purchase-price allocation: -0.2 million euros
                                                                         Conversion to performance-related AFD for Saxoprint: 0.6 million euros
     In a B2B business environment, COP was hit particularly
     strongly by the coronavirus crisis                        ƒ   Previous year HY1 2019 special effects: -0.3 million euros
                                                                         Effects from the Saxoprint purchase-price allocation: -0.1 million euros
     Efficient cost management kept the decline in earnings              Effects from the Laserline purchase-price allocation: -0.2 million euros

     under control
                                                                                               Rounding differences may occur.
25
1.4
Other
Business segment Other Q2
in Euro millions                                                       Structural and corporate costs and profits arising
                                                                       from real estate property and company investments
                                                                       are shown in the "other" business segment.
                                                          +13.3%
Turnover
Umsatz
                                                  1.5
                                       1.3
                             1.0
                  0.7                                              ƒ    The 1.5 million euros in turnover is to be exclusively
        0.5                                                             allocated to futalis (Q2 2019: 1.3 million euros)

       2016      2017       2018      2019       2020
                                                                   ƒ    EBIT mainly improved through futalis: futalis
EBIT                                                                    continues to grow most positively, with earnings
                                                                        clearly moving towards break even
                                                                   ƒ    IR costs lower than in the previous year as AGM was
       -0.7       -0.9       -0.6       -0.9       -0.1                 moved to October 6, due to the pandemic

       2016      2017       2018       2019       2020

     Segment for other business raises turnover and improves earnings

                                                                                         Rounding differences may occur.
27
Business segment Other H1
in Euro millions                                                       Structural and corporate costs and profits arising
                                                                       from real estate property and company investments
                                                                       are shown in the "other" business segment.
Turnover                                                  +20.0%
 Umsatz

                                       2.6       3.1
                  1.4       1.8
       1.0
                                                                   ƒ    The 3.1 million euros in turnover is to be exclusively
                                                                        allocated to futalis (HY1 2019: 2.6 million euros)
       2016      2017      2018       2019      2020

EBIT                                                               ƒ    EBIT mainly improved through futalis: futalis
                                                                        continues to grow most positively, with earnings
                                                                        clearly moving towards break even
                             -1.0                  -0.3
        -1.4      -1.4                  -1.2                       ƒ    IR costs lower than in the previous year as AGM was
                                                                        moved to October 6, due to the pandemic

       2016      2017       2018       2019       2020

     Segment for other business raises turnover and improves earnings

                                                                                         Rounding differences may occur.
28
2.
Group Results
Q2 2020
Group Turnover Q2
 in Euro millions                                                                   -2.7%
                                                                                  fx-adj.: -2.2%

                                                      134.2             130.6
                                       123.9           1,3               1,5
            116.8        116.0          1,0
             0,5          0,7                           10,6             7,6
                                         12,4                            10,9                      Retail:
                                                                                                   -28.8%
                                                                                                                       Turnover development in Retail and
             14,5          13,2                         25,0
                                                                                                   (fx-adj.: -24.0%)   Commercial Online-Print effected by
                                         24,7
             20,7          19,9                                                                                        Corona-shutdown: Until end of February
                                                                                                                       hardware-retailing according to strategy
                                                                                                   Commercial
                                                                                                   Online-Print:
                                                                                                                       with focus on photofinishing products
                                                                                                   -56.6%              only down by around 10-15%, COP with
                                                                        110,6                      (fx-adj.: -56.7%)   slight single digit growth
                                                        97,2
             81,1          82,1          85,9
                                                                                                   Photofinishing:     Photofinishing nearly compensates
                                                                                                   +13.8%              decrease in other segments: “stay-at-home-
                                                                                                   (fx-adj.: +14.0%)   effect” brought additional growth
                                                                                                                                        Rounding differences may occur.

            2016         2017          2018           2019              2020

             Pho tofinishing   Comme rci al O nline-P rint     Retail     Other

     Photofinishing nearly compensates decrease in other segments

30
Group Turnover H1
in Euro millions                                                                 +0.9%
                                                                                fx-adj.: +1.2%

                                                     274.6            277.0
                                      254.5
                        234.6                         2.6             3.1
           236.0                       1.8            21.0            15.1
             1.0                       23.3                           33.4                  Retail:
                          1.4                                                                                    Turnover development in Retail and
                                                      50.2                                  -28.2%
            27.3          25.0                                                              (fx-adj.: -24.3%)    Commercial Online-Print effected by
                                       49.1                                                                      Corona-shutdown: Until end of February
            41.1          40.5                                                                                   hardware-retailing according to strategy
                                                                                             Commercial
                                                                                             Online-Print:
                                                                                                                 with focus on photofinishing products
                                                                                             -33.4%              only down by around 10-15%, COP with
                                                                                             (fx-adj.: -33.6%)   slight single digit growth
                                                                      225.3
                                                     200.8
            166.6        167.7         180.3
                                                                                            Photofinishing:      Photofinishing overcompensates decrease
                                                                                            +12.2%               in other segments: “stay-at-home-effect”
                                                                                            (fx-adj.: +12.4%)    brought additional growth

                                                                                                                                  Rounding differences may occur.
           2016         2017          2018           2019             2020

            Pho tofinishing   Comme rci al O nline-P rint    Retail     Other

     Photofinishing overcompensates decrease in other segments

31
EBIT
                                                              operating profit before                                                                  operating profit before
                                                                  special items:                                                                           special items:
      EBIT nach Restrukturieung                                                         EBIT nach Restrukturieung
      Q2                                                      3.0 million euros         H1                                                             6.0 million euros
                                                         (+5.5 million euros vs. PY)                                                                (+5.8 million euros vs. PY)
      in Euro millions                                                                  in Euro millions
                                                                                                                                             1.0
                                                 -0.1
      -0.7                        -0.6
                    -0.9                  -0.9           -1.0
                           -1.0   -0.2                           Photofinishing            -0.5       -0.4                            -0.3         Photofinishing
             -1.1                                                                       -1.4 0.8   -1.4
                                                                                                                -1.0    -1.2   -1.5
      -0.7          -0.3 0.2              -0.3
             0.3                                                 Commercial Online-                       1.5   -0.7
                                  -1.5                                                  -0.4 0.5   -0.4                 -0.7                       Commercial Online-
                                          -1.1   -3.2            Print                             -0.2
                                                                                                                                      -3.7
                                                                                                                               1.8                 Print
                                                                 Retail                                         -1.8    -1.4
                                                                                                                                                   Retail
                                                                                                                -0.4                         8.4
                                          -1.1                   Other
                                                                                                                 -3.8
                                  -1.8                                                                                                             Other
                                                        5.1
                                          -3.4                                                                                        -3.4

                                   -4.1
                                                 -2.8

     2016           2017          2018    2019   2020                                   2016       2017         2018    2019          2020

     Photofinishing increases significantly in Q2, COP and Retail with a more negative contribution to
     earnings than in the previous year due to the coronavirus and retailing burdened by restructuring
     and value adjustments on stocks
     Operating profit before specials items* considerably increased
                                                                                                                        * explained in detail in the segment reporting

32                                                                                                                                    Rounding differences may occur.
3.
Financial details
Consolidated profit and loss account Q2
Figures in millions of euros                           Q2 2019    Q2 2020    ∆ as %     ∆ as m€    Increase of turnover in Photofinishing does not quite balance
Revenues                                                 134.2      130.6       -2.7%       -3.6   corona driven decrease in segements Commercial
Increase / decrease in finished and unfinished goods       -0.1        0.1      172%         0.2   Online-Print and Retail
Other own work capitalised                                  0.2        0.4      105%         0.2
Other operating income                                      4.9        4.2    -14.2%        -0.7   (+) Cost of material following reduced turnovers in Retail and
Cost of materials                                         -40.7      -33.5    -17.6%         7.2       Commercial Online-Printing
Gross profit                                               98.4     101.7        3.4%        3.3
Personnel expenses                                        -44.8      -43.4       3.1%        1.4   (+) Cost containment (e.g. delayed replacement, overtime reduction,
Other operating expenses                                  -43.6      -45.4      -4.2%       -1.9        short-time allowance)
EBITDA                                                     10.0       12.9     28.3%         2.8   (+) Integration of Laserline printing facility into Saxoprint production
Amortisation/Depreciation                                 -13.4      -13.8      -3.2%       -0.4   (-) Restructuring retail
Earnings before interest, taxes (EBIT)                     -3.4       -1.0    -71.1%         2.4   (-) Acquisition of WhiteWall
Financial income                                            0.2        0.0    -99.4%        -0.2
Financial expenses                                         -0.3       -0.3       0.4%        0.0   (-) Acquisition of WhiteWall
Financial result                                           -0.1       -0.3     -201%        -0.2   (+) Cost containment (e.g. marketing)
Earnings before taxes (EBT)                                -3.5       -1.2    -64.3%         2.2   (-) Mailorder costs

Rounding differences may occur.

          “Stay-at-home” effect in Photofinishing and broad cost containment – partly initiated
          last year (Commercial Online-Print) – improve profit situation

  34
Balance Sheet at 30 June

               Assets
              Aktiva                                                                               Liabilities
                                                                                                  Passiv                                                    Positive earnings
                                                          Purchase price allocation -
              in
               in Mio.
                  EuroEuro
                       millions                           depreciation: -€ 9.5 million             in Mio.
                                                                                                  in  EuroEuro
                                                                                                           millions                                         reinforce equity
                                          508.7   491.4                                                                          508.7          491.4       +€ 27.9 million
                                                          IFRS 16 Leasing rights of
                                                          use -€ 8.1 million
                                  402.9                                                                               402.9
                                                                                                                                235.9
                         308.8                                                                                                 = 46.4%      263.8           IFRS 16 Long-term
              300.2                       381.8                                                    300.2      308.8
                                                                                                                              Equity ratio = 53.7%
                                                  366.9                                                                                                     leasing liability:
                                                                                                                      212.6                                 -€ 8.4 million
                                  281.2                                               Equity                                              Equity ratio
Non-current
    assets    185.2      185.8                                                                     169.8      191.3              97.1
                                                                                                                                                            Short-term financial
                                                                                                                      35.7                   90.1           liabilities:
                                                                             Non-current                                                                    -€ 46.5 million
    Current                                                                    liabilities          32.7      29.7
                                          126.9                                                                       154.6       175.7                     Trade payables:
     assets   115.0      123.0    121.6           124.5                          Current                                                       137.5
                                                                                                    97.7      87.8                                          +€ 6.9 million
                                                                               liabilities
              2016      2017      2018    2019    2020    Increase in inventories mainly in on-    2016       2017    2018        2019         2020
                                                          site-finishing: +€ 2.3 million
                                                                                                                          Rounding differences may occur.
          Assets reduced due to                           -€ 5.2 million in receivables from
                                                          income tax refunds resulting from
          planned depreciation                            deferred advance tax payments

                                                          Trade receivables: -€ 11.7 million
          Equity ratio strong at 53.7%,                   Corona-driven reduction.
                                                          c
                                                          Cash Position: +€ 11.7 million
          w/o IFRS 16 even at 61.3%
  35
From Balance Sheet to Management Balance Sheet
                  Balance Sheet                                       Management Balance Sheet

                                                   Equity                                           Equity
                                                                      Non-current
     Non-current assets                                                 assets
                                             Non-current                                        Gross financial
                                              liabilities                                          liabilities

                                                                                                Non-operating
                                                                     Working Capital
                                                                                                  liabilities
                                                   Current
       Current assets
                                                  liabilities
                                                                      Balance sheet total: 377 Euro millions

                                                                The balance sheet total is reduced to capital
         Balance Sheet total: 491 Euro millions                 elements "to be paid for" (by way of dividends or
               Short-term operative debts/                      interest) in the management balance sheet
              non-interest-bearing liabilities:
               114 Euro millions

36
Management-Balance Sheet at 30 June

                   Capital Employed                                                              Capital Invested
                   Capital Employed                                                              Capital Invested
                   in Euro millions                                                               in Euro millions
                   in Mio. €                   402.2   377.4                                     in Mio. €                       402.2
                                                                                                                                               377.4     Positive results
                                                                                                                                                         strengthen equity
                                                                Depreciation of purchase                                                                 +€ 27.9 m.
                                       305.3
                                                                price allocation:                                    305.3
                                                                -€ 9.5 m.

                                                                IFRS 16 right of use
                                                                                                                                 235.9                   Financial
                               222.6                            assets: -€ 8.1 m.
                                                                                                  209.9    222.6                              263.8      liabilities:
                     209.9                                                                                                                               -€ 47.0 m.
     Non-current                               381.8   366.9                                                         212.6                               IFRS 16 leasing
         assets
                                       281.2                                           Equity                                                            liability (long- and
                                                                                                                                                         shortterm)
                    185.2      185.8                                                              169.8    191.3                 126.3                   -€ 7.5 m.

                                                                            Gross financial                          58.8                      71.8
          Cash                                                                    liabilities     8.7      2.4
                     15.3      22.3    11.7                                                       31.4               33.9         40.0         41.8
                               14.5    12.3    12.5
                                                7.9    24.2                  Non-operating                 28.9
 Net Working          9.4                              -13.6
      Capital                                                                      liabilities
                    2016      2017     2018    2019    2020                                       2016     2017      2018        2019         2020
                                                          Current trade receivables
                                                                                                                       Rounding differences may occur.
                                                          - € 11.7 m. Corona-driven
                                                          decrease.

                                                          Current receivables from
                                                          Income tax refunds:
                                                          - € 5.2 m.

          “Stay-at-home” effect reduces current trade receivables (faster payment methods in
          Photofinishing and less turnover in Commercial Online-Print and Retail)
37
Capital employed I: T-3
Figures in millions of euros               Mar. 31, 2020   Jun. 30, 2020   ∆ as %   ∆ as m€

Property, plant and equipment                     213.6           214.6      0.5%       1.0   (-) Scheduled depreciation > Investments
Investment properties                              17.2            17.5      1.4%       0.2
Goodwill                                           77.8            77.8      0.0%       0.0
Intangible assets                                  37.2            35.0     -5.9%      -2.2   (-) Scheduled depreciation purchase price
Financial assets                                    6.2             6.3      1.7%       0.1       allocation-assets and software
Non-current financial assets                        1.3             1.4      6.1%       0.1
Non-current other receivables and assets            0.1             0.5     764%        0.4   (+) Paper stock for Onsite Finishing
Deferred tax assets                                14.0            14.0      0.2%       0.0   (-) Inventory RETAIL
Non-current assets                                367.2           366.9     -0.1%      -0.3
                                                                                              (-) Receivables from B2B photofinishing as more
Inventories                                        44.5            48.4      8.9%       3.9       online business with shorter payment terms
Current trade receivables                          35.0            29.6    -15.4%      -5.4   (-) Receivables income Commercial Online Print
Operating gross working capital                    79.5            78.1     -1.8%      -1.5
Current trade payables                             55.6            59.9      7.8%       4.3   (+) Financing inventories for photo kiosks
Operating net working capital                      23.9            18.2    -24.1%      -5.8

Rounding differences may occur.

         Corona driven trade receivables reduction reduces net working capital …

 38
Capital employed II: T-3
Figures in millions of euros                  Mar. 31, 2020   Jun. 30, 2020   ∆ as %   ∆ as m€

Current receivables from income tax refunds             6.2             6.9     12%        0.7   (+) Claims against social security insurance related
Current financial assets                                3.4             4.5    32.9%       1.1       to short-time allowance
Other Current receivables and assets                   12.2            10.9   -10.7%      -1.3
Other gross working capital                            21.8            22.3     2.5%       0.5   (-) VAT claims
Current tax liabilities                                 7.3             6.5   -11.7%      -0.9
Current other accruals                                  6.4             7.2    12.3%       0.8   (-) Payment of income tax for previous years
Current financial liabilities                           8.5             6.8   -20.5%      -1.7
Current other liabilities                              32.0            33.6     4.9%       1.6   (+) Provisions for restructuring RETAIL
Other net working capital                             -32.6           -31.8    -2.4%       0.8
                                                                                                 (-) Payment of purchase price CHEERZ
Operating net working capital                          23.9            18.2   -24.1%      -5.8
Other net working capital                             -32.6           -31.8    -2.4%       0.8   (+) Deferral of social security
Net working capital                                    -8.6           -13.6   -57.7%      -5.0       contributions France

Non-current assets                                   367.2           366.9     -0.1%      -0.3
Net working capital                                   -8.6           -13.6    -57.7%      -5.0
Cash and cash equivalents                             19.7            24.2     22.7%       4.5
Capital employed                                     378.2           377.4     -0.2%      -0.8

Rounding differences may occur.

          … and enhances the cash position at the end of Q2

39
Capital invested: T-3
Figures in millions of euros                         Mar. 31, 2020   Jun. 30, 2020   ∆ as %   ∆ as m€
Equity                                                      263.4           263.8      0.1%       0.3   (+) Positive overall result of the
Non-current accruals for pensions                            35.9            36.3      1.2%       0.4       last four quarters
Non-current deferred tax liabilities                          3.4             2.7    -19.3%      -0.7   (+) Dividend payout for 2019 outstanding
Non-current other accruals                                    0.4             0.5      3.7%       0.0
Non-current financial liabilities                             1.9             1.9      0.0%       0.0   (-) Release of defered tax liabilities due to
Non-current other liabilities                                 0.5             0.5      0.0%       0.0       planned depreciation of purchase price
= non operating liabilities                                  42.0            41.8     -0.5%      -0.2       allocation assets
Non-current interest-bearing financial liabilities            1.0             1.0     -2.9%       0.0
Non-current leasing liabilities                              48.6            47.4     -2.6%      -1.3
Current interest-bearing financial liabilities               12.9            12.6     -2.4%      -0.3   (-) Payment of lease liabilities
Current leasing liabilities                                  10.2            10.9      6.6%       0.7   (+) Accrual for termination payments for lease
brutto financial debt                                        72.8            71.8     -1.3%      -0.9       contracts of restructured RETAIL shops
Capital Invested                                            378.2           377.4     -0.2%      -0.8

Rounding differences may occur.

        Composition of capital invested nearly unchanged during Q2

40
Free cash flow Q2
                Cash Flow from                            Outflow of funds from                          Free-Cash Flow
                operating business                        investment aktivities                          in euro millions
                in euro millions                          in euro millions
               2016       2017   2018   2019   2020       2016      2017     2018    2019    2020        2016    2017   2018     2019      2020

                                               18.1

                                                      +                                              =
                                                                                                                                            4.5
                    7.7                 7.3

                          1.0    0.7
                                                                                                          -5.6
                                                                    -9.3     -10.5                               -8.3    -9.8
+€ 2.8 m EBITDA
                                                          -13.3                              -13.5

Higher cash flows
from operating net
W/C (mainly from                                            Acquisition of
trade receivables)                                          WhiteWall
+€ 4.2 m                                                    -€32.0 m                                                             -36.6
Less cash out for                                                                    -43.9
incme taxes
+€ 3.3 m                                                                                                            Rounding differences may occur.

                +2.8 Euro million more operational profit plus substantial working capital and tax
                payment reductions increase cash from operative business
                Investments in fixed assets at regular level after acquisition of WhiteWall previous year
  41            Free cash flow turns positive
Consolidated free cash flow Q2
Figures in millions of euros                                                  Q2 2019    Q2 2020     ∆ in %     ∆ as m€
                                                                              Q2 2019    Q2 2020     ∆ in %    ∆ in Mio €
EBITDA                                                                            10.0       12.9    28.3%             2.8   (+) Increased income
Non-cash factors                                                                  -2.4       -1.2    49.7%             1.2
Decrease (+) / increase (-) in operating net working capital                       1.6        5.8    -262%             4.2   (+) Reduction in trade receivables in commercial
Decrease (+) in other net working capital (excluding income tax items)             3.1        2.3    25.4%            -0.8       online printing
Taxes paid                                                                        -5.0       -1.7    66.3%             3.3
Interest received                                                                  0.0        0.0    69.2%             0.0   (+) Reduction n advance tax payments
Cash flow from operating activities                                                7.3       18.1    -146%           10.7
Outflows from investments in fixed assets                                        -10.8      -13.8   -26.9%            -2.9   (-) Investments for the roll-out for Boots (UK)
Outflows from purchases of consolidated interests / acquisitions                 -34.0       -1.5      96%           32.5
Outflows (-) / inflows (+) from investments in financial assets                    0.0       -0.1          -          -0.1   (+) Q2 2019 acuisition of WhiteWall
Outflows (-) / inflows (+) from investments in financial instruments               0.0       -0.1     664%            -0.1   (-) Payments for put/call options for CHEERZ
Inflows from the sale of property, plant and equipment and intagible assets        0.9        1.9    -107%             1.0
Cash flow from investing activities                                              -43.9      -13.5    69.2%           30.4
Free cash flow                                                                   -36.6        4.5     112%           41.1

Rounding differences may occur.

42
ROCE                                                   12-month EBIT
                                                       excluding IFRS 16
                                                       and restructuring:                            Average capital employed
                                                       € 66.0 million                                before IFRS 16:
                                                                                                     € 321.4 million

                                                                              Avarage capital
             12-months-EBIT                                                                                                     ROCE *
                                                                              employes in the past 4
             in euro millions                                                 quarters                                          in %
 12-month EBIT                                                                in euro millions
 excluding IFRS 16:
 € 55.7 million                                 59.3                                                                                    20.6%
                                        56.1                                    Average capital
                                                                                                                                19.8%                         20.3%**
                                                                                employed excluding                                                      18.1%**
                                                                                IFRS 16:

                                                                                                                         =
                       47.0 45.8                                                € 307.5 million                                                 16.4%
               43.0                                                                                          383.1
                                                                                                     339.7                                              16.5%   15.5%
                                                                                            279.5
                                                                              217.6 228.0

               2016 2017 2018 2019 2020                                        2016 2017 2018 2019 2020                         2016     2017   2018    2019    2020

      IFRS 16 and the WhiteWall acquisition increase average capital employed to 383.1 million euros
      Positive development of earnings increases ROCE before IFRS 16 and restructuring to 20.3 %
     * ROCE = EBIT / ‡ Capital Employed. Rounding differences may occur.
     ** before IFRS 16 balance sheet total increase and restructuring costs
43
Outlook
Due to corona situation, no targets for 2020 have been set so far
   CEWE                                                       PY 2019          Pre-Corona Perspective 2020

   Photos                             billion photos            2.40                     2.4 to 2.5
   CEWE PHOTO BOOK                    millions                  6.62                     6.7 to 6.9
   Investments                        Euro millions             39.3                        57
   Revenue                            Euro millions             714.9                   725 to 755
   EBIT                               Euro millions             57.8                     58 to 64
   EBT                                Euro millions             54.3                    56.5 to 62.5
   Earnings after tax                 Euro millions             31.8                     38 to 43
   Earnings per share                 Euro                      4.41                    5.34 to 5.90

         CEWE is stable and expects to achieve a solid annual result in 2020, as well
         How the corona pandemic will continue to impact the company's business in the next few
         months cannot be predicted reliably – within the usual confidence interval
         Q3, in which turnover as a percentage of annual sales has already been declining for years,
         could see an additional negative impact in 2020 resulting from changed holiday-travel behavior
         due to the coronavirus
  45
4.
Q&A-Session
Analyst Conference Call Q2 2020
You can also read