Economic Forecast Almanac - November 2017 - Calnan Flack
←
→
Page content transcription
If your browser does not render page correctly, please read the page content below

Economic Forecast
    Almanac

   November 2017
XAO Forecasting Record

                   All forecasted dates are included in this chart

A FORECAST IS NOT A SUBSTITUTE FOR A PERSONAL TRADING PLAN!

       Authorised Representatives of PGW Financial Services Pty Ltd – AFSL 384713. ©Copyright 2017 All Rights Reserved

                                                           P a g e |2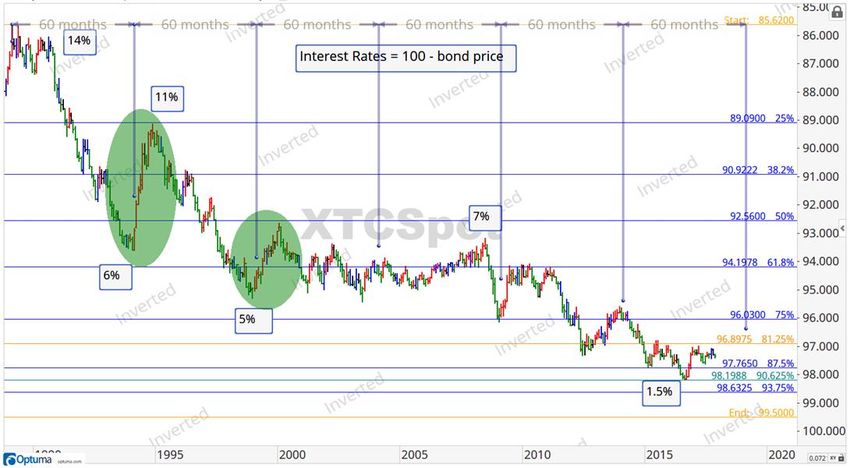
Major Index Forecasts
 All Ordinaries Index
                                                           17 Apr
                                                                                 18 May

                                                                                                           27 Jul

                                                                             14 May
                                            27 Feb                                        4 Jun
                     8 Jan

                                                         28 Mar

                               24 Jan

     27 Nov

 Dow Jones Index
                                         27 Feb
                                                                           17 Apr

                   27 Dec

                                                                                                       4 Jun

                                  24 Jan

                                                                   28 Mar                  14 May

      27 Nov

                                                                                                       20 Jun

YOU HAVE OUR HIGH PROBABILITY REVERSAL DATES – USE THEM

     Authorised Representatives of PGW Financial Services Pty Ltd – AFSL 384713. ©Copyright 2017 All Rights Reserved

                                                         P a g e |3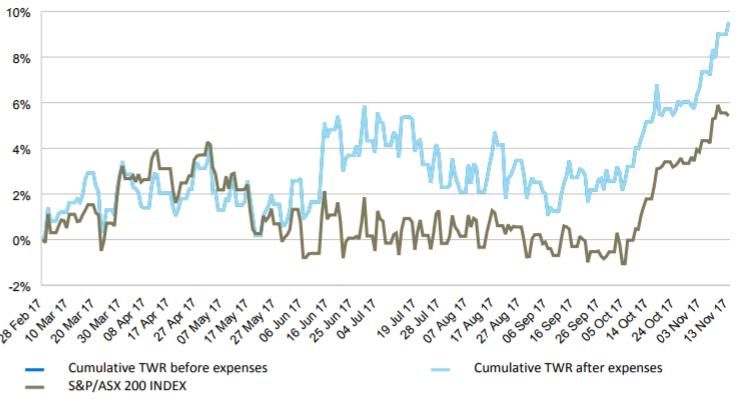
S&P 500 Index
                             24 Jan                                    23 Apr             17 May
                                                6 Mar

                  27 Dec              9 Feb
                                                                                   10 May

                                                        16 Mar

                           12 Jan
                2
           5 Dec
                                                                                                          9 Jul
                  22

               20 Dec

27 Nov

FTSE Index
                                                                17 Apr

                                                                                                    13 Jun

                                                    5 Mar
                                                                                     14 May
                                                                                                          4 Jul

                                                                28 Mar
                     22 Dec

         30 Nov                        24 Jan

                      YOU MUST TRADE WHAT YOU SEE
                     AND NOT WHAT YOU’VE PREDICTED!
                        2 7 Jun

     Authorised Representatives of PGW Financial Services Pty Ltd – AFSL 384713. ©Copyright 2017 All Rights Reserved

                                                         P a g e |4
NASDAQ 100 Index
                                                                 15 Feb

                                                                                                              17 Apr

                                 27 Dec

                                                                                             16 Mar

                                                               24 Jan

Gold
Gold looks to have started a new Long-Term Up-Trend confirming the low in
Dec 2015 $1046 as forecasted in Nov 2015.
Expect Gold to range around the indicated levels. A close above $1296 could be
an entry signal. A close above $1359 then $1376 would be a sign of further
strength.
Watch for change of trend around 27th Dec 2017.
The Levels on this chart are from the low of $1124 in December 2016 to the high of $1297 in April 2017.

        Authorised Representatives of PGW Financial Services Pty Ltd – AFSL 384713. ©Copyright 2017 All Rights Reserved

                                                            P a g e |5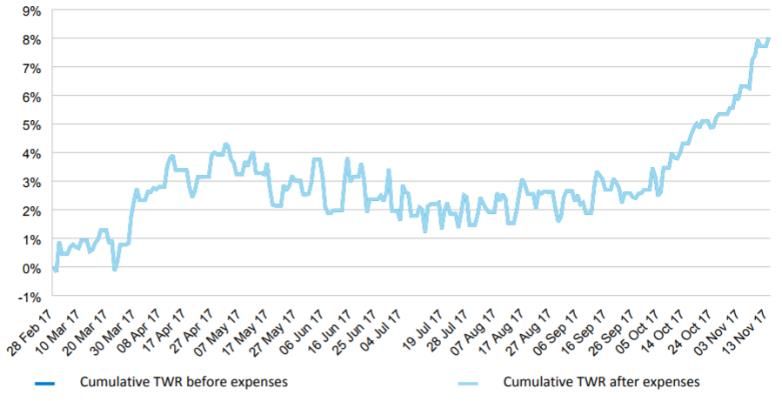
Australian Interest Rates
The chart speculates that the Interest rates set by the RBA may go as low as
0.25% – 0.50%.
January 2019 (360 Months since the top) is an important time to watch.
This chart is the inverse of the 10year Bond Chart on the SFE.
The inverse indicates Aus Interest rates as the bonds are calculated as (100 – current interest rates).

AUDUSD
The AUDUSD has established an uptrend since bottoming in Jan 2016. If
AUDUSD closes above the 0.8125 high in Sep 2017 expect it to reach Jan 2015
high of 0.8295. Next level 0.8452. Support is at 0.7535.
The levels on this chart are from the high of 1.108 in July 2011 and the low of 0.6828 in Jan 2016

        Authorised Representatives of PGW Financial Services Pty Ltd – AFSL 384713. ©Copyright 2017 All Rights Reserved

                                                            P a g e |6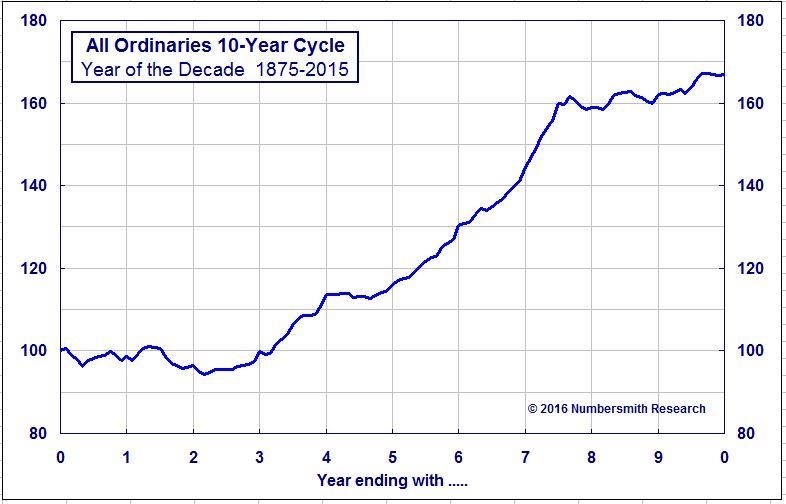
Crude Oil
Oil has bottomed as we suggested in Nov 2016. If Oil closes above 55.25 next
resistance is 62.58 (May 2015 high), next level would be 74.20.
The levels on this chart are from the low of 42.20 in Nov 2016 and the high of 55.24 in Jan 2017.

Forecast Dates
     DOW                     FTSE                   NASDAQ                    S&P500                       XAO

  27-Nov-17              30-Nov-17                  27-Dec-17                27-Nov-17                 27-Nov-17
  27-Dec-17              22-Dec-17                  24-Jan-18                 5-Dec-17                  8-Jan-18
   24-Jan-18             24-Jan-18                  15-Feb-18                20-Dec-17                 24-Jan-18
  27-Feb-18               5-Mar-18                  16-Mar-18                27-Dec-17                 27-Feb-18
  28-Mar-18              28-Mar-18                  17-Apr-18                 12-Jan-18                28-Mar-18
  17-Apr-18              17-Apr-18                                            24-Jan-18                17-Apr-18
  14-May-18              14-May-18                                            9-Feb-18                 14-May-18
   4-Jun-18              13-Jun-18                                            6-Mar-18                 18-May-18
  20-Jun-18                4-Jul-18                                          16-Mar-18                  4-Jun-18
                                                                              23-Apr-18                 27-Jul-18
                                                                             10-May-18
                                                                             17-May-18
                                                                               9-Jul-18

        Authorised Representatives of PGW Financial Services Pty Ltd – AFSL 384713. ©Copyright 2017 All Rights Reserved

                                                            P a g e |7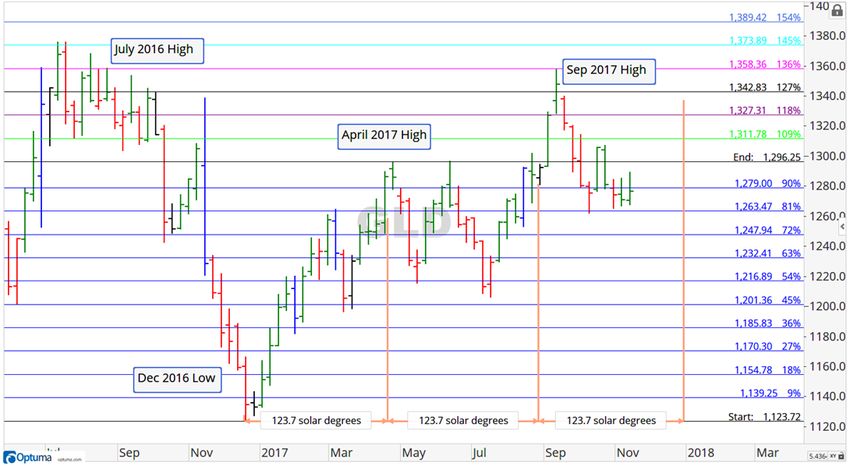
Australian Stock Market – ASX Sectors

XDJ Consumer Discretionary                                        XJR Resources
In uptrend, buy the dips.                                         New uptrend confirmed after 249
XEJ Energy                                                        weeks down. Buy the dips. Look for
Bottom in place after 91 month down-                              outperforming stocks in the sector.
trend from 3/6/08 to 20/1/16. Look for                            XPJ Property Trusts
outperforming stocks in the sector.                               Look for buying opportunities above
XFJ Financials                                                    1559.
In uptrend, buy the dips. Look for                                XXJ Financial X Property
outperforming stocks in the sector.                               Look for buying opportunities above
XHJ Health Care                                                   7883.
Buy the dips above 23000.                                         XTL Top 20
XIJ Info Tech                                                     Uptrend. Buy the dips.
Buy the dips. Look for outperforming
stocks in the sector.
XMJ Materials                                                      Summary
Triple bottom 16/5/05 – 21/11/08                                   The suggested strategy is to buy the
(1288d) 14/12/15 is (2628d). Start of                              strongest stocks in the Green
long term uptrend. Buy the dips. Look                              (strongest) sectors.
for outperforming stocks in the sector.
XNJ Industrials                                                    Regularly reviewing the sectors
In uptrend. Buy the dips.                                          watching levels as suggested will
XSJ Consumer Staples                                               result in very positive investing.
Start of long term uptrend. Other
Sectors offer better risk/reward.                                  This is a good time to be in the
                                                                   market and use the dips as
XTJ Telecommunications
Look elsewhere until new uptrend in                                opportunities to increase exposure.
place.
XUJ Utilities
In uptrend. Buy the dips.                                          ASX Shares to Trade
XEC Emerging Companies                                             IAG
Beginning of new uptrend, buy the
dips. Look for outperforming stocks in                             BXB
the sector.
                                                                   MQG
XGD Gold
Wait for uptrend to confirm and break                              RIO
of recent congestion

                TRADE THE MARKET - NOT THE FORECAST

      Authorised Representatives of PGW Financial Services Pty Ltd – AFSL 384713. ©Copyright 2017 All Rights Reserved

                                                          P a g e |8
References
XAO Decade Cycle

All Time New Highs
The ASX has taken more time than ever before to reach its previous all-time high
in a new cycle.

 Previous All
 Time
 High 2007

 Cycle Bottom
 2009

 New All
 Time High?

       Authorised Representatives of PGW Financial Services Pty Ltd – AFSL 384713. ©Copyright 2017 All Rights Reserved

                                                           P a g e |9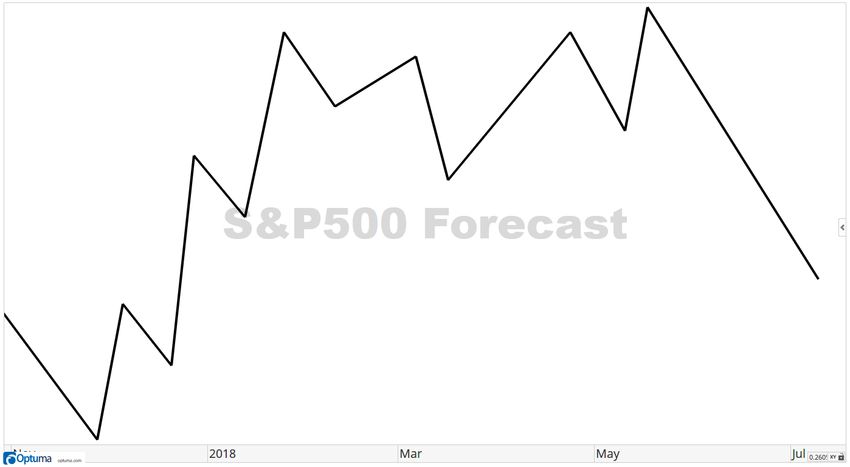
All Ordinaries Composite Trend and Vagg Levels

10,000                                                                                                                        10,000
                       Average Trend Growth
                 All Ords Price Index: 5.7% pa                        All Ords Price Index
              Productivity Contribution: 1.8% pa
 1,000          Inflation Contribution: 3.9% pa                                                                               1,000

                                                                                             Inflation Contribution
  100                                                                                                                         100

                                                                                     Productivity Contribution
   10                                                                                                                         10

                                                                                                © Numbersmith Research 2017
    1                                                                                                                     1
    1900        1910     1920     1930      1940     1950     1960     1970     1980     1990     2000       2010      2020

         Authorised Representatives of PGW Financial Services Pty Ltd – AFSL 384713. ©Copyright 2017 All Rights Reserved

                                                             P a g e | 10
Relative Strength of Major World Markets
10000.0 10000.0
Global Stock Price Indices Aus
Scaled to 1875 = 5.0
US
Ger
1000.0 1000.0
UK
100.0 100.0
Fra
10.0 10.0
1.0 1.0
© Numbersmith Research 2017
0.1 0.1
1875 1885 1895 1905 1915 1925 1935 1945 1955 1965 1975 1985 1995 2005 2015 2025
300% 300%
Recov eries from GFC Lows
S&P500
250% 250%
DAX
200% 200%
N225
150% 150%
CAC40
FTSE100
100% 100%
AOrd
50% 50%
0% 0%
Bottom 2009 2010 2011 2012 2013 2014 2015 2016 2017
Authorised Representatives of PGW Financial Services Pty Ltd – AFSL 384713. ©Copyright 2017 All Rights Reserved
P a g e | 11Dow Jones - Projecting Forward
Presidential Cycle
2017 2018
2020
2019
100,000 100,000
80574
Dow Jones Industrials Index - 1900-2030 49797
with Composite Trend and Trend Reversal Levels 39148
30777
24195
19021
14953
11756
10,000 10,000
7265
4490
2775
1715
1,000 1060 1,000
655
405
250
155
100 9 100
59
37
© 2017 Numbersmith Research
10 10
1900 1910 1920 1930 1940 1950 1960 1970 1980 1990 2000 2010 2020 2030
THE COMPOSITE LINE PROVIDES A REFERENCE POINT FOR THE MODEL BASED
ON 140+ YEARS OF HISTORY
Authorised Representatives of PGW Financial Services Pty Ltd – AFSL 384713. ©Copyright 2017 All Rights Reserved
P a g e | 12Other Dates to Watch
▪ Solstice Dec 22 2017 ▪ Lunar Eclipse 31 Jan 2018
▪ Equinox Mar 21 2018 ▪ Solar Eclipse 15 Feb 2018
▪ Solstice Jun 21 2018 ▪ Solar Eclipse 13 Jul 2018
▪ Equinox Sep 23 2018 ▪ Lunar Eclipse 28 Jul 2018
▪ Solstice Dec 22 2018 ▪ Solar Eclipse 11 Aug 2018
https://www.timeanddate.com/eclipse/in/australia/sydney
http://science.knowledgeevolution.net/solstice.php#Melbourne
2018 FOMC Meetings
January 30-31
March 20-21*
May 1-2
June 12-13*
Jul/Aug 31-1
September 25-26*
November 7-8
December 18-19*
* Meeting associated with a Summary of Economic Projections and a press conference by the Chair.
http://www.federalreserve.gov/monetarypolicy/fomccalendars.htm
Authorised Representatives of PGW Financial Services Pty Ltd – AFSL 384713. ©Copyright 2017 All Rights Reserved
P a g e | 13Authorised Representatives of PGW Financial Services Pty Ltd – AFSL 384713. ©Copyright 2017 All Rights Reserved
P a g e | 14Phil Anderson’s Economic Clock
Authorised Representatives of PGW Financial Services Pty Ltd – AFSL 384713. ©Copyright 2017 All Rights Reserved
P a g e | 152017/18 Solar Dates
Solar Market Dates 2017/18
Probable dates for changes in trend and the highs & lows each month
Solar Angle Solar Angle Solar Angle XAO 2017 XAO 2017
High Low
Reference Angle 13 55 18 24 41 51 00 27 32
2017
November 5 16 22
December 5 16 21
2018
January 6 15 20
Febuary 2 13 18
March 4 15 20
April 3 14 20 11
May 4 15 21
June 4 15 21 8
July 5 17 23
August 6 17 23
September 6 17 23
Note – If the date is a weekend the likely change of trend date may be the Friday or Monday
Summary of Opportunities
Foundations
Successful Investor Mindset
Plan – Action - Review
Invest with the Cycle – Review the Calnan Flack Cycle Map and Share Market Timetable Monthly
Set aside a regular time to study the Calnan Flack Bogs and Forecast Updates
Review and analyse the Vagg Levels and Composite Trend Lines
Take Action
Trading Plan
Review and Finalise your Trading Plan
Invest in assets which have the best probability of growth in the current market
Review your Trading Plan and Calendar to include how you will leverage the Forecast Dates
Review the markets you will trade based on the Calnan Flack Forecasts
Current Opportunities for Property Investors
Invest in property early in the cycle
Plan property portfolio of multiple properties
Credit, Lending & Investing
Use your cycle Knowledge to leverage finance opportunities
The Australian Share Market Opportunities
Leverage the run up to the Mid Cycle Peak at approx. 10650 (13550) expected Nov 2019
Focus Share Market Investing in the Calnan Flack Green Sectors and Avoid the Red
Look for the Strongest Shares in the Green Sectors
Evaluate if you have time to do it yourself or should you use the Calnan Flack SMA’s solution to
invest with the economic and investment cycles
Authorised Representatives of PGW Financial Services Pty Ltd – AFSL 384713. ©Copyright 2017 All Rights Reserved
P a g e | 16Warning & Important Notice
Forecasting is a very difficult exercise and should be undertaken with care. Anything that is
represented here should be treated with great caution and not relied upon. Anyone can make a
forecast but it should NOT be assumed that it will be correct. Forecasting will NOT make you any
money, for most it is purely an intellectual exercise. DISCIPLINED TRADING AND INVESTING MAKES
YOU MONEY.
A FORECAST IS NOT A SUBSTITUTE FOR A PERSONAL INVESTMENT PLAN!
These predictive models rely on certain assumptions including but not limited to, the market continuing
to revert to the mean as defined by the Vagg Composite Line. That the cycle drivers of technology,
infrastructure, population, credit & government granted licences will continue to drive and manifest in
an investment and credit cycle. That future investment cycles will continue to behave in the same or
similar manner as past cycles. These models may have limitations. Known and unknown risks and
other uncertainties may arise which impact the assumptions used in the modelling. This may result in
expected estimates and timing being materially different from actual outcomes. Calnan Flack and
associates make no claim or guarantee as to the future accuracy or reliability of these models.
The strategies shown in this workshop are based upon scientific and repeatable processes. This process
can be repeated, but the outcomes or results of these forecasts can vary widely to the actual market
action. While providing a framework for your thinking, expectation and helping you focus your
attention NO claim or guarantee is being made that these actual concepts and methods shown will
result in investment or trading profits.
The price and value of investments and their income fluctuates. Past performance is no guarantee of
future performance and all examples shown are for illustration purposes only.
There is an inherent risk and the possibility of losses in investing and trading just as there is the
possibility of profits. Trading and investing may not be appropriate for all attendees as some people do
not have a suitable risk profile/psychological aptitude.
Any advice provided should be considered General Advice as it does not take into account your
personal needs and objectives or your financial circumstances. You should therefore consider these
matters yourself before deciding whether the advice is appropriate for you and whether you should act
upon it.
Invest and Trade at your own risk and take responsibility for your own actions.
Jeremy Calnan, Ian Flack, Cathy Stacey, Jonathan Evans and Calnan Flack Pty Ltd (ACN 165 717 448
AR 446976) are all authorized Representatives of PGW Financial Services Pty Ltd, ABN 15 123 835
441, AFSL 384713
COPYRIGHT 2017 - ALL RIGHTS RESERVED
No part of this workshop may be reproduced or transmitted in any form or by any means without the
prior written permission of the authors.
THE ECONOMY NEVER DOES WHAT THE MAJORITY OF PEOPLE ARE PREPARING
FOR – THEIR PREPARATION ENSURES IT WON'T HAPPEN!
Authorised Representatives of PGW Financial Services Pty Ltd – AFSL 384713. ©Copyright 2017 All Rights Reserved
P a g e | 17Notes
________________________________________
________________________________________
________________________________________
________________________________________
________________________________________
________________________________________
________________________________________
________________________________________
________________________________________
________________________________________
________________________________________
________________________________________
________________________________________
________________________________________
________________________________________
________________________________________
________________________________________
________________________________________
Authorised Representatives of PGW Financial Services Pty Ltd – AFSL 384713. ©Copyright 2017 All Rights Reserved
P a g e | 18CALNAN FLACK
Separately Managed Accounts
Calnan Flack has two SMA Models on the Powerwrap Platform.
Complete Investment Solution
The Calnan Flack SMA’s offer a complete investment solution to investors seeking to invest their funds into the
Australian share market using our expert knowledge of economic cycles.
Australian Share Fund Dynamic Asset Allocation Index Fund
With an “Opportunistic” investment style and a focus This fund seeks to enhance investment returns by
on Growth, this Australian shares fund consists making changes to the underlying asset allocation of the
predominately of shares from the ASX 300 index and fund based on changing market conditions. This fund is
Listed ETFs. This fund is benchmarked to the ASX200 benchmarked to the cash rate plus 2%.
Index.
Returns to 13/11/2017 Returns to 13/11/2017
HOLDINGS - Australian Share Fund HOLDINGS – Dynamic Asset Allocation
Code Name Code Name
ASX ASX LIMITED SFY SPDR S&P/ASX 50 FUND ETF
BRG BREVILLE GROUP STW SPDR S&P/ASX 200 FUND ETF
BSL BLUESCOPE STEEL VAS VANGUARD AUSTRALIAN SHARES INDEX ETF
CBA COMMONWEALTH BANK OF AUSTRALIA IAA ISHARES ASIA 50 ETF
GMG GOODMAN GROUP IVV ISHARES S&P 500 ETF
IAF ISHARES CORE COMPOSITE BOND ETF
GUD G.U.D. HOLDINGS LIMITED
VAF VANGUARD AUSTRALIAN FIXED INTEREST
LLC LENDLEASE GROUP
INDEX ETF
MND MONADELPHOUS GROUP VAP VANGUARD AUSTRALIAN PROPERTY
MQG MACQUARIE GROUP LIMITED SECURITIES INDEX ETF
NST NORTHERN STAR RESOURCES
PPT PERPETUAL LIMITED *Performance returns and Holdings are as at 13th November 2017
SUN SUNCORP GROUP
WBC WESTPAC BANKING CORPORATION
This document provides general information only and has not been prepared having regard to your objectives, financial situati on or needs. Before making an investment decision, you
need to consider whether this information is appropriate to your objectives, financial situation and needs. No person should act on the basis of any matter contained in this document
without obtaining specific professional advice. This is not an offer document and does constitute a recommendation, offer or a solicitation of an offer to buy or sell securities. This material
has been prepared as general information only and is only intended to provide a summary of the subject matter covered. Further information can be found in the Product Disclosure
Statement and accompanying Approved Product List that can be found on the Powerwrap website.
This document contains or is based upon information that we believe to be accurate and reliable. While every effort has been made to ensure its accuracy Calnan Flack Pty Ltd makes no
representations or warranties as to the accuracy of the information presented and takes no responsibility or liability (including for indirect, consequential or incidental damages), for any
error, omission or inaccuracy in the data supplied. To the fullest extent allowed by law, Calnan Flack Pty Ltd, PGW Financial Services Pty Ltd and Powerwrap Limited exclude all liability
(whether arising in contract, from negligence or otherwise) in respect of all and each part of the document, including without limitation, any errors or omissions. The price and value of
investments and their income fluctuates. Past performance is not an indication of future returns. All amounts are quoted in Australian Dollars ($AUD). Calnan Flack Pty Ltd is an Authorised
Representative of PGW Financial Services
Authorised Representatives of PGWPty Ltd – AFSL
Financial 384713.
Services Copyright
Pty © Calnan
Ltd – AFSL Flack Pty
384713. Ltd 2017. All
©Copyright rights
2017 Allreserved.
Rights Reserved
P a g e | 19Authorised Representatives of PGW Financial Services Pty Ltd – AFSL 384713. ©Copyright 2017 All Rights Reserved
P a g e | 20You can also read