Financial Update Q1 FY21 - NYSE: CRM @Salesforce_ir - Salesforce Investor Relations
←
→
Page content transcription
If your browser does not render page correctly, please read the page content below

Financial Update
    Q1 FY21
      NYSE: CRM
      @Salesforce_ir
Safe Harbor
"Safe harbor" statement under the Private Securities Litigation Reform Act of 1995. This presentation contains forward-looking statements about the company's financial and operating results, which
may include expected GAAP and non-GAAP financial and other operating and non-operating results, including revenue, net income, earnings per share, operating cash flow growth, operating margin
improvement, expected revenue growth, expected current remaining performance obligation growth, expected tax rates, stock-based compensation expenses, amortization of purchased intangibles,
shares outstanding, market growth, environmental, social and governance goals, expected capital allocation, including mergers and acquisitions, capital expenditures and other investments,
expectations regarding closing contemplated acquisitions and contributions from acquired companies. The achievement or success of the matters covered by such forward-looking statements
involves risks, uncertainties and assumptions. If any such risks or uncertainties materialize or if any of the assumptions prove incorrect, the company’s results could differ materially from the results
expressed or implied by the forward-looking statements it makes.

The risks and uncertainties referred to above include -- but are not limited to --the impact of the COVID-19 pandemic, related public health measures and resulting economic downturn and market
volatility; our ability to maintain service performance and security levels meeting the expectations of our customers, and the resources and costs required to avoid unanticipated downtime and
prevent, detect and remediate performance degradation and security breaches; the expenses associated with our data centers and third-party infrastructure providers; our ability to secure and costs
related to additional data center capacity; our reliance on third-party hardware, software and platform providers; the effect of evolving domestic and foreign government regulations, including those
related to the provision of services on the Internet, those related to accessing the Internet, and those addressing data privacy, cross-border data transfers and import and export controls; current and
potential litigation involving us or our industry, including litigation involving acquired entities such as Tableau, and the resolution or settlement thereof; regulatory developments and regulatory
investigations involving us or affecting our industry; our ability to successfully introduce new services and product features, including any efforts to expand our services beyond the CRM market; the
success of our strategy of acquiring or making investments in complementary businesses, joint ventures, services, technologies and intellectual property rights; our ability to realize the benefits from
strategic partnerships, joint ventures and investments; our ability to successfully integrate acquired businesses and technologies; our ability to compete in the market in which we participate; the
success of our business strategy and our plan to build our business, including our strategy to be the leading provider of enterprise cloud computing applications and platforms; our ability to execute
our business plans; our ability to continue to grow unearned revenue and remaining performance obligation; the pace of change and innovation in enterprise cloud computing services; the seasonal
nature of our sales cycles; our ability to limit customer attrition and costs related to those efforts; the success of our international expansion strategy; the demands on our personnel and infrastructure
resulting from significant growth in our customer base and operations, including as a result of acquisitions; our dependency on the development and maintenance of the infrastructure of the Internet;
our real estate and office facilities strategy and related costs and uncertainties; fluctuations in, and our ability to predict, our operating results and cash flows; the variability in our results arising from
the accounting for term license revenue products; the performance and fair value of our investments in complementary businesses through our strategic investment portfolio; the impact of future
gains or losses from our strategic investment portfolio including gains or losses from overall market conditions that may affect the publicly traded companies within our strategic investment portfolio;
our ability to protect our intellectual property rights; our ability to develop our brands; the impact of foreign currency exchange rate and interest rate fluctuations on our results; the valuation of our
deferred tax assets and the release of related valuation allowances; the potential availability of additional tax assets in the future; the impact of new accounting pronouncements and tax laws;
uncertainties affecting our ability to estimate our tax rate; uncertainties regarding our tax obligations in connection with potential jurisdictional transfers of intellectual property, including the tax rate,
the timing of the transfer and the value of such transferred intellectual property; uncertainties regarding the effect of general economic and market conditions; the impact of geopolitical events;
uncertainties regarding the impact of expensing stock options and other equity awards; the sufficiency of our capital resources; risks related to our 2023 and 2028 senior notes, revolving credit facility
and loan associated with 50 Fremont; our ability to comply with our debt covenants and lease obligations; and the impact of climate change, natural disasters and actual or threatened public health
emergencies, including the ongoing COVID-19 pandemic.

Further information on these and other factors that could affect the company’s financial results is included in the reports on Forms 10-K, 10-Q and 8-K and in other filings it makes with the Securities
and Exchange Commission from time to time. These documents are available on the SEC Filings section of the Investor Information section of the company’s website at www.salesforce.com/investor.

Salesforce.com, inc. assumes no obligation and does not intend to update these forward-looking statements, except as required by law.

                                                                                                                                                                                                                     2
Company Overview
Delivering durable growth at scale

 - Salesforce is the #1 CRM software provider worldwide by revenue for 7 consecutive years1

 - Consistently delivering durable revenue growth, more than doubling from $8.4 billion in FY17 to $17.1 billion in FY20

 - Fastest growing top five enterprise software company with $17.1B in revenue in FY20 (~29% Y/Y)

 - Uniquely positioned to help our customers drive broad-based digital transformation

        1
         Source: IDC, Worldwide Semiannual Software Tracker, April 2020.. CRM market includes the following IDC-defined functional markets: Sales Force
        Productivity and Management, Marketing Campaign Management, Customer Service, Contact Center, Advertising, and Digital Commerce Applications.     3
Financial Overview
    Quarterly Results

                        4
Q1 FY21 Results Highlights
    Durable top-line growth
    • Revenue of $4.87 Billion, up 30% year-over-year, 31% in constant currency1
    • Operating Cash Flow of $1.86 Billion, down 5% year-over-year
    • Current Remaining Performance Obligation of approximately $14.5 Billion, up 23% year-over-year, 24% in constant
      currency1
    • Remaining Performance Obligation of approximately $29.3 Billion, up 18% year-over-year
    • Guidance2
        ◦ Updates FY21 Revenue to $20.0 Billion, approximately 17% year-over-year growth
        ◦ Initiates Q2 FY21 Revenue of $4.89 Billion - $4.90 Billion, approximately 22% to 23% year-over-year growth
        ◦ Updates FY21 GAAP EPS to ($0.06) to ($0.04)
        ◦ Updates FY21 Non-GAAP EPS to $2.93 to $2.953
        ◦ Updates FY21 Operating Cash Flow growth to approximately 10% to 11%
        ◦ Initiates Q2 FY21 Current Remaining Performance Obligation growth of approximately 16% to 17% year-over-
          year

1
 Refer to slides 9 and 10 for an explanation of non-GAAP constant currency (“CC”) growth rates for revenue and current remaining performance obligation, respectively.
2
 Guidance provided for Q2 FY21 Revenue and Q2 GY21 Current Remaining Performance Obligation on May 28, 2020. Guidance provided for FY21 Revenue on December 3, 2019,
updated on February 25, 2019 and again on May 28,2020. All other guidance provided February 25, 2020, updated May 28, 2020. This guidance does not reflect any potential future
gains or losses on our strategic investment portfolio resulting from the future impact of ASU 2016-01 as it is not possible to forecast future gains and losses, and is based on estimated
GAAP tax rates that reflect the company’s currently available information, and excludes forecasted discrete tax items such as excess tax benefits from stock-based compensation. The
GAAP tax rates may fluctuate due to future acquisitions or other transactions.
3
 Non-GAAP EPS is a non-GAAP financial measure. Refer to the Appendix for an explanation of non-GAAP financial measures, and why we believe these measures can be useful, as well
as a reconciliation of non-GAAP financial measures to the most comparable GAAP measures, when applicable.                                                                                    5
Q1 FY21 Financial Summary

                                                                                                          GAAP                                                                Non-GAAP1
                                                                                      Quarterly Results          Increase (Decrease) Y/Y                         Quarterly Results           Increase (Decrease) Y/Y

                                                             Revenue                    $4,865M                            30%                                     $4,907M                             31%

     Current Remaining Performance Obligation                                             $14.5B                           23%                                          N/A                            24%
         Total Remaining Performance Obligation                                           $29.3B                           18%                                          N/A                             N/A
                                                                                                                                                                                  2
                                               Operating Margin                           (2.9)%                       (850) bps                                     13.1%                         (520) bps
                                Diluted Earnings Per Share 3                               $0.11                          (78)%                                        $0.70                          (25)%
                                          Operating Cash Flow                           $1,859M                            (5)%                                         N/A                             N/A

1
 The Non-GAAP columns present non-GAAP financial metrics and the related non-GAAP growth rates as compared to prior periods. Non-GAAP revenue and non-GAAP current remaining performance obligation (CRPO)
represent CC results. Refer to slides 9 and 10 for explanations of non-GAAP CC revenue growth and non-GAAP CC CRPO growth, respectively. Non-GAAP operating margin and non-GAAP EPS are non-GAAP financial
measures. Refer to the Appendix for an explanation of non-GAAP financial measures and a reconciliation of non-GAAP financial measures to the most comparable GAAP measures, when applicable.
2
 Non-GAAP Operating Margin is the proportion of non-GAAP income from operations as a percentage of GAAP revenue.
3
 Diluted EPS is calculated using GAAP revenue.

                                                                                                                                                                                                                       6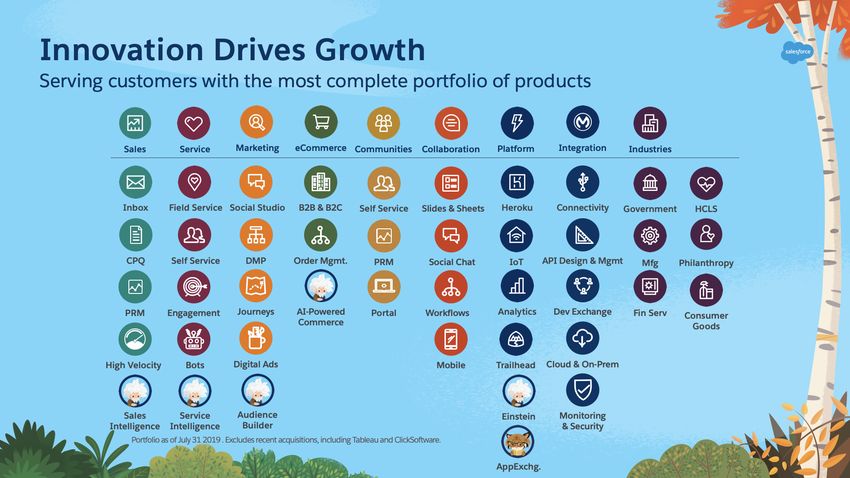
Total Quarterly Revenue and Operating Margin

                                                                                                                             $4,865
                                                                      18.2%
             17%

                                                                                                                               13.1%                                               Q1 FY21
                                                                    $3,737                                                                                                        Y/Y Growth

          $3,006
             6.4%
                                                                      5.6%
                                                                                                                                                              +  30% / +31% CC                                              1

                                                                                                                                                                                      Revenue
                                                                                                                               (2.9)%

                                                                                                                                                                           (850) bps
                                                                                                                                                                         GAAP Operating Margin

            Q119          Q219          Q319           Q419          Q120          Q220           Q320          Q420           Q121                                          (520) bps
                            Quarterly Revenue                 Operating Margin                Non-GAAP Operating Margin
                                                                                                                              2                                     Non-GAAP Operating Margin2

1
 Refer to slide 9 for an explanation of non-GAAP revenue CC growth rate as compared to the comparable prior period.
2
 Non-GAAP Operating Margin is the proportion of non-GAAP income from operations as a percentage of GAAP revenue and is a non-GAAP financial measure. Refer to the Appendix for an explanation of which items are excluded
from our non-GAAP financial measures, and why we believe these measures can be useful, as well as a reconciliation of non-GAAP financial measures to the most comparable GAAP measures, when applicable.

                                                                                                                                                                                                                                7
Q1 FY21 Subscription and Support Revenue by Cloud
Complete portfolio of CRM products
 +16% Y/Y                                    +23% Y/Y                 +62% Y/Y           +27% Y/Y

                                                                              $1.4B
            $1.2B                                           $1.3B
 $1.1B                                      $1.0B
                                                                     $0.8B
                                                                                                 $0.7B
                                                                                         $0.6B

 Q120        Q121                            Q120            Q121    Q120     Q121        Q120   Q121
  Sales Cloud                               Service Cloud               Salesforce      Marketing Cloud
                                                                    Platform & Other   & Commerce Cloud

         Note: growth rates are based on reported results in USD.
                                                                                                          8
Q1 FY21 Revenue by Region
Incremental investments in international markets driving growth

        $3,370M                                                                     $1,034M                                       $461M
        +29% Y/Y                                                                    +37% Y/Y                                      +26% Y/Y
        +29% Y/Y CC1                                                                +41% Y/Y CC1                                  +28% Y/Y CC1

  1
   Non-GAAP revenue CC growth rates as compared to the comparable prior period. We present CC information for revenue to
  provide a framework for assessing how our underlying business performed excluding the effects of foreign currency rate
  fluctuations. To present CC revenue, current and comparative prior period results for entities reporting in currencies other
  than United States dollars are converted into United States dollars at the weighted average exchange rate for the quarter
  being compared to for growth rate calculations presented, rather than the actual exchange rates in effect during that period.

                                                                                                                                                 9
Remaining Performance Obligation
     Represents future revenue under contract
                                                                                                                 $29.3B
                                                                                                                                                                              Q1 FY21
                                                            $24.9B                                                                                                           Y/Y Growth

        $20.4B                                                                                                     $14.8B                             +   23% / +24% CC                                               2

                                                              $13.1B                                                                                                 Current RPO (cRPO)

                                                                                                                                                                               18%
         $10.8B

                                                                                                                                                                           +
                                                                                                                                                                              Total RPO
                                                                                                                   $14.5B
                                                              $11.8B                                                                       Remaining Performance Obligation (RPO) is a metric disclosed
          $9.6B
                                                                                                                                             with the adoption of Topic 6061. RPO represents all future
                                                                                                                                            revenue under contract that has not yet been recognized as
                                                                                                                                              revenue. Current RPO represents future revenue under
                                                                                                                                            contract that is expected to be recognized as revenue in the
        Q119          Q219         Q319         Q419         Q120         Q220         Q320          Q420         Q121                     next 12 months. RPO is influenced by several factors, including
                                                                                                                                            seasonality, the timing of renewals, average contract terms,
                                           Current Remaining Performance Obligation                                                                     and foreign currency exchange rates.
                                           Noncurrent Remaining Performance Obligation
1
 Topic 606 introduced remaining transaction price, which is different than unbilled deferred revenue under previous accounting guidance. Transaction price allocated to the remaining performance obligations represents contracted revenue
that has not yet been recognized, which includes unearned revenue and unbilled amounts that will be recognized as revenue in future periods. Transaction price allocated to the remaining performance obligation is influenced by several
factors, including seasonality, the timing of renewals, average contract terms and foreign currency exchange rates. Unbilled portions of the remaining transaction price denominated in foreign currencies are revalued each period based on the
period end exchange rates. As with unbilled deferred revenue under previous accounting guidance, the portion of the remaining transaction price that is unbilled is not recorded on the balance sheet.
2
 To present CC CRPO growth, CRPO balances in local currencies in previous comparable periods are converted using the United States dollar currency exchange rate as of the most recent balance sheet date.

                                                                                                                                                                                                                                               10
Quarterly Operating Cash Flow
$1,965M
Q1 FY21
$1,859M Y/Y Growth
$1,466M (15)% (5)%
FCF1 OCF
Our fourth quarter has historically been our strongest
quarter for new business and renewals and we
generally invoice our customers annually.
As a result, our first quarter and, increasingly, our
fourth quarter are our largest collections and operating
cash flow quarters. Our second quarter and third
quarter are seasonally smaller in regards to collections
and operating cash flow.
Q119 Q219 Q319 Q419 Q120 Q220 Q320 Q420 Q121
Free Cash Flow1 Capex
1
Free cash flow is a non-GAAP financial measure. Refer to the Appendix for an explanation of non-GAAP financial measures, and why we
believe these measures can be useful, as well as a table including the components of Free cash flow.
11Cash, Cash Equivalents, and Marketable Securities
Strengthening Cash Balances
$9.8B
Q1 FY21
Y/Y Growth
54%
$7.2B
$6.4B
Total Cash and Marketable
Securities Y/Y Growth
Q119 Q219 Q319 Q419 Q120 Q220 Q320 Q420 Q121
Cash Marketable Securities
Note: Growth rate based on reported actuals, not the rounded figures shown in the graph.
12Business Overview
1314
15
15
16
Salesforce: #1 CRM
Worldwide CRM applications 2019 revenue market share by IDC

     Source: IDC, Worldwide Semiannual Software Tracker, April 2020. CRM market includes the following IDC-defined functional markets: Sales Force Productivity and Management, Marketing Campaign Management,
                                                                                                                                  Customer Service, Contact Center, Advertising, and Digital Commerce Applications.
                                                                                                                                                                                                                      17
18
19
20
21
51,613
Values Attract Top Talent
Unmatched scale focused on CRM

                                                                                           Headcount
                                                                                            Growth
                                                                                          Y/Y Q1 FY21

                                                                                          38%

~800

FY05 FY06 FY07 FY08 FY09 FY10 FY11 FY12 FY13 FY14 FY15 FY16 FY17 FY18 FY19 FY20 Q1 FY21
                                Total Company Headcount

                                                                                                        22
Strategic Technology Partners
Extending the capabilities of the Salesforce Customer 360
2324
Appendix

           25
Notes on our Financial Results
Topic 606 Accounting Standards
• Salesforce retrospectively adopted new accounting standard Topic 606 on February 1, 2018 (Q1 FY19)
• Topic 606 includes changes to accounting policies for revenue recognition and costs capitalized to acquire
revenue contracts (primarily commissions)
• Refer to the Q1 FY19 press release for additional information, including adjusted historical Statements of
Operations and Balance Sheets
• Adjusted information is based on best available information and reflects management's best estimate of the
potential impact as a result of the adoption of the new standard
• Reconciliations to prior standards will not be provided
26Non-GAAP Financial Measures
This presentation includes information about non-GAAP diluted earnings per share, non-GAAP income from operations, non-GAAP operating margin, free cash flow, and constant
currency revenue and constant currency current remaining performance obligation growth rates (collectively the “non-GAAP financial measures”). These non-GAAP financial
measures are measurements of financial performance that are not prepared in accordance with U.S. generally accepted accounting principles and computational methods may
differ from those used by other companies. Non-GAAP financial measures are not meant to be considered in isolation or as a substitute for comparable GAAP measures and
should be read only in conjunction with the company’s consolidated financial statements prepared in accordance with GAAP. Management uses both GAAP and non-GAAP
measures when planning, monitoring, and evaluating the company’s performance.
The primary purpose of using non-GAAP measures is to provide supplemental information that may prove useful to investors and to enable investors to evaluate the company’s
results in the same way management does. Management believes that supplementing GAAP disclosure with non-GAAP disclosure provides investors with a more complete view
of the company’s operational performance and allows for meaningful period-to-period comparisons and analysis of trends in the company’s business. Further, to the extent that
other companies use similar methods in calculating non-GAAP measures, the provision of supplemental non-GAAP information can allow for a comparison of the company’s
relative performance against other companies that also report non-GAAP operating results.
Non-GAAP diluted earnings per share excludes, to the extent applicable, the impact of the following items: stock-based compensation, amortization of purchased intangibles, and
income tax adjustments. These items are excluded because the decisions that give rise to them are not made to increase revenue in a particular period, but instead for the
company’s long-term benefit over multiple periods.
Non-GAAP Operating Margin is the proportion of non-GAAP income from operations as a percentage of GAAP revenue. Non-GAAP income from operations excludes the impact
of the following items: stock-based compensation, and amortization of acquisition-related intangibles.
The company defines the non-GAAP measure free cash flow as GAAP net cash provided by operating activities, less capital expenditures. For this purpose, capital expenditures
does not include our strategic investments.
Constant currency information is provided as a framework for assessing how our underlying business performed excluding the effect of foreign currency rate fluctuations. To
present constant currency revenue, current and comparative prior period results for entities reporting in currencies other than United States dollars are converted into United
States dollars at the weighted average exchange rate for the quarter being compared to for growth rate calculations presented, rather than the actual exchange rates in effect
during that period. To present current remaining performance obligation on a constant currency basis, we convert the current remaining performance obligation balances in local
currencies in previous comparable periods using the United States dollar currency exchange rate as of the most recent balance sheet date.
27GAAP to Non-GAAP Financial Reconciliation
(in millions) Three Months Ended April 30,
Non-GAAP income from operations 2018 2019 2020
GAAP income (loss) from operations $ 191 $ 210 $ (140)
Plus:
Amortization of purchased intangibles 69 129 271
Stock-based expense 252 343 504
Non-GAAP income from operations $ 512 $ 682 $ 635
(in millions) Three Months Ended April 30,
Components of Free cash flow, a non-GAAP measure 2018 2019 2020
GAAP net cash provided by operating activities $ 1,466 $ 1,965 $ 1,859
Capital expenditures (122) (159) (323)
Free cash flow $ 1,588 $ 1,806 $ 1,536
Three Months Ended April 30,
Non-GAAP diluted earnings per share 2018 2019 2020
GAAP diluted net income per share $ 0.46 $ 0.49 $ 0.11
Plus:
Amortization of purchased intangibles 0.09 0.16 0.30
Stock-based expense 0.33 0.43 0.55
Amortization of debt discount, net 0.01 0.00 0.00
(Income tax effects and adjustments) (0.15) (0.15) (0.26)
Non-GAAP diluted earnings per share $ 0.74 $ 0.93 $ 0.70
Shares used in computing Non-GAAP diluted net income
per share 754 793 913
28You can also read