Q2 2020 Investor Presentation - 17 July 2020 Oscar Werner - Sinch Investors

Page created by Eugene Obrien
 
CONTINUE READING
Q2 2020 Investor Presentation - 17 July 2020 Oscar Werner - Sinch Investors
Q2 2020
Investor Presentation
17 July 2020

Oscar Werner
CEO
Roshan Saldanha
CFO
Thomas Heath
Chief Strategy Officer & Head of Investor Relations
Q2 2020 Investor Presentation - 17 July 2020 Oscar Werner - Sinch Investors
SEK 6.0bn              SEK 708m                  SEK 45bn              822           37 countries with
       revenue in the         Adj. EBITDA in the        Market Cap            people        local presence
       past 12 months         past 12 months

                                                                     40 billion                 Publicly listed on
Customer engagement through mobile technology                        engagements per year       NASDAQ
                                                                                                in Stockholm

           Scalable cloud communications                                   Serving 8 of the 10 largest
           platform for messaging, voice and video                         U.S. tech companies

             100%       Consumer penetration                    Growing, global, multi-billion
                                                                USD market

           Profitable since our                    >600% growth in gross
      $    foundation in 2008                      profit since IPO in 2015
                                                                                                                     2
Q2 2020 Investor Presentation - 17 July 2020 Oscar Werner - Sinch Investors
Track record of profitable growth
                   3,500

                   3,000
                                                                                                                ACL                 •   Focus on Gross profit since pass-
                   2,500                                                                                                                through revenues vary between
                                                                                                                                        geographies
     SEK million

                                                                                                                SDI
                   2,000

                   1,500
                                                                                                                Wavy
                                                                                                                                    •   43% growth in Gross profit and
                                                                                                                        Synergies       55% growth in EBITDA in Q2 20
                   1,000                                                                                                ACL
                                                                                                                        SDI         •   Acquisitions of Wavy, SDI and
                    500
                                                                                                                                        ACL Mobile adding significantly
                                                                                                                        Wavy

                      0                                                                                                                 to our scale and profitability
                                  2016               2017              2018               2019              L12M

                                       Gross profit               Adj EBITDA                 Acquisitions

Acquisitions of Wavy and SDI are both pending regulatory approval. Sinch L12M includes Chatlayer. Synergies refer to
expected for Wavy and SAP Digital Interconnect, estimated mid-point, at full run rate. Exchange rates as of 12 June 2020.                                                   3
Q2 2020 Investor Presentation - 17 July 2020 Oscar Werner - Sinch Investors
Growth markets

Messaging                                       CPaaS
Application-to-Person (A2P) messaging is used   Communications Platform as a Service (CPaaS)
across the world for ever-more use cases        allows businesses to easily integrate
                                                messaging, voice and video services into their
                                                own applications
•   USD 17 bn market size for A2P SMS
    (MobileSquared), other estimates vary
    between USD 15-50 bn                        •   Juniper Research sees a 35% growth CAGR
                                                    (USD 1.1 bn in 2016 to 6.7 bn in 2022)
•   Business usage of SMS continues to grow
                                                •   Gartner expects a 50% growth CAGR
•   >100% growth rates expected in business
                                                    (USD 618 m in 2016 to 4.63 bn in 2021)
    messaging through next-generation
    messaging channels like WhatsApp & RCS      •   IDC forecasts a 57% growth CAGR
                                                    (USD 867 m in 2016 to 8.2 bn in 2021)

                                                                                                 4
Q2 2020 Investor Presentation - 17 July 2020 Oscar Werner - Sinch Investors
Playbook for profitable growth

                    • Empower businesses to leverage rich and conversational messaging
      Software-
                    • Increase our software value-add (CPaaS) in addition to our connectivity offering
     as-a-Service   • Increase stickiness with maintained scalability

                    • Ensure leading direct global connectivity without middlemen
     Connectivity   • Differentiate through superior quality, scale and reach
                    • Benefit from market growth and continue to win market share

                                                                                                         5
Q2 2020 Investor Presentation - 17 July 2020 Oscar Werner - Sinch Investors
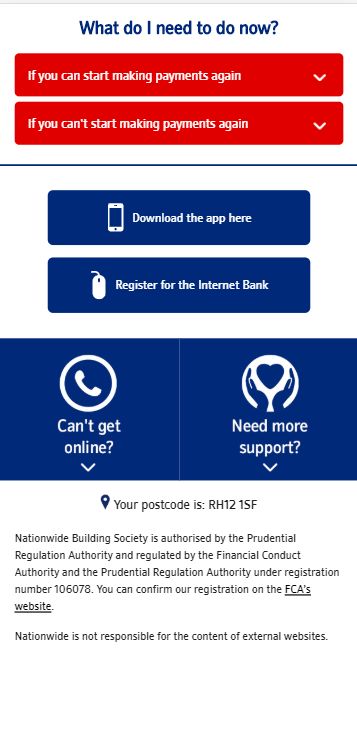
Strategic acquisitions

Founded as CLX
   Networks                   IPO                                                                                             One brand
                                    2016                              2017                        2018                   2019                       2020

      2008

   Technology &                                                                                                                                                        Innovation
   Go To Market                                                Voice, video,              Personalized      Rich messaging,
                                                                                                                                    Conversational AI            Next-generation
                                                               verification                  video           Low code tools                                        messaging

                                                                                                                                                        SAP Digital
      Scale and                                                                                                                                         Interconnect
                                                                                                                                          SMS
     profitability                USA,                  Germany,               Australia,
                                                                                                  Nordics                                          Americas,               India,
                              Western Europe          Central Europe         South East Asia                    Brazil          Latin America    Europe, APAC          Southeast Asia

                                                                                                                                                                                    6
 * Acquisitions of Wavy and SAP Digital Interconnect are pending regulatory approval
Customer case: Driving engagement for Nationwide
                                                             Nationwide objectives
                                                             •   Nationwide Payment holidays eases
                                                                 customers’ burden during covid-19
                                                             •   Looking for ways to improve the
                                                                 customer experience
                                                             •   Email has low open rates and sending
                                                                 physical mail a slow process

                                                             Sinch value proposition
     Your postcode is: NW8 9AY

      Hello George,
                                                             •   Hyper-personalized mobile campaigns
                                                                 using Rich SMS with a link to a landing
                                                                 page
                                 Your postcode is: NW8 9AY

                                                             Key performance indicators
                                                             •   4x click-through rate compared bank &
                                                                 finance sector average
                                                             •   91% engagement rate
                                                             •   “If you can start making payment again”
                                                                 was the most-clicked option
                                                                                                           7
Deal rationale: SAP Digital Interconnect
                •   Global cloud communications provider with operations in Americas, Europe and Asia Pacific
  SAP Digital   •   Programmable Communications (67% of revenue), Carrier Messaging (28%), Enterprise Solutions (5%)
 Interconnect   •   18bn business messages and 292bn person-to-person (P2P) messages in 2019
                •   Around 320 employees with headquarters in San Ramon, California

                •   1,500 enterprise customers, some of the world’s most valuable brands, diversifies Sinch customer base
    Deal        •   Highly accretive deal, fits Scale and Profitability category
  rationale     •   Significantly strengthened US presence, more people also in Asia Pacific and Europe
                •   Very strong operator relationships as trusted vendor to hundreds of carriers

                •   Await approval from competition authorities in multiple jurisdictions
                •   Combine operations across the USA, Europe, and Asia
 Integration
                •   Win synergies through SMS platform integration
                •   Cross- and upsell combined & broadened Sinch+SDI product portfolio

                • Sinch pays an enterprise value of EUR 225m
                • SAP Digital Interconnect recorded revenues of EUR 340m, gross profit of EUR 94m, and Adj EBITDA
  Financials      of EUR 15.4m in the 12 months ending March 2020. Revenue growth around 10% in the past two years.
                • Closing is subject to regulatory approval. Transaction expected to close in H2 2020

                                                                                                                            8
Deal rationale: ACL Mobile
               •   Leading cloud communications provider in India and Southeast Asia
               •   Strong customer base with leading position in Banking & Finance
 ACL Mobile    •   Significant scale with 47 billion business messages handled in the past 12 months
               •   288 employees in India, UAE and Malaysia

               •   Significant scale in the world’s second-largest mobile market with a 1.3 billion population
    Deal       •   More than 500 large enterprise customers, including the majority of India’s privately-owned banks
  rationale    •   Highly accretive deal, fits Scale and Profitability category
               •   Direct operator connections in India & competitive cost structure for further expansion in Asia

               • Maintained leadership with ACL founder & CEO Sanjay K Goyal joining Sinch
 Integration   • Utilisation of ACL’s direct operator connections in India, UAE and Malaysia for all Sinch customers
               • Further synergy assessment after ACL and SDI transactions have closed

               • Sinch pays a total enterprise value of INR 5,350m (SEK 655m)
               • Revenues of INR 4,959m, gross profit of INR 1,091m and Adj EBITDA of INR 480m in the last 12 months
 Financials      - this corresponds to revenues of SEK 607m, gross profit of SEK 134m, and EBITDA of SEK 59m
               • Like-for-like gross profit growth of 13 percent in the 12 months ending March 2020
               • Transaction expected to close in Q3 2020 with 82% acquired upfront and 18% on or after Dec 1, 2020
                                                                                                                       9
India
         •    2nd largest mobile market in the world
              with a population exceeding 1.3 billion1
 India
India
         •    1.2 billion mobile subscribers2 and ~50%
              smartphone penetration
         •    World’s highest data usage per
              smartphone3 at 9.8 GB/month
         •    Rapidly digitalizing economy;
              second only to Indonesia4
         •    World’s largest WhatsApp market5 with
              400 million users in July 2019

         Sources:
         (1) World Bank (2) Telecom Regulatory Authority of India (TRAI), January 2020 (3) Ericsson
         Mobility Report, June 2019 (4) McKinsey “Digital India”, March 2019 (5) Techcrunch         10
April – June 2020
•   Gross profit rising 43% to SEK 460.3 million (321.1)
•   Adjusted EBITDA rising 55% to SEK 176.5 million (114.2)
•   Adjusted EBIT excl. acquisition-related amortization of SEK 161.7 million (104.1)
•   Profit after tax of SEK 37.1 million (53.3)

•   Organic Gross profit growth of 24% in local currency
•   COVID-19 causing reduced voice traffic and lengthened sales cycles
•   High scalability means that EBITDA grows faster than Gross profit despite
    increased opex to handle greater business volumes, strengthen our go to market
    and develop new products

                                                                                        11
Key growth drivers

             1.                        2.                    3.
     Volume growth & new         Acquisition of TWW,
                                                       Strong performance
     use cases with US big         myElefant and
                                                            in Brazil
        tech companies               Chatlayer

Growing both with new and existing customers
                                                                            12
Four investment areas

                                 Operational                  New                      Integration
    Organic growth
                                  efficiency               technology

•   Continuous             •   COGS efficiency       •   Software for            •   TWW, myElefant &
    investment in          •   Internal automation       advanced, interactive       Chatlayer
    platform scalability       for improved              messaging               •   ACL Mobile
•   Supporting growth          scalability           •   New channels like           (expected to close in
    with existing          •   Client self-service       WhatsApp and RCS            Q3 2020)
    customers                  tools                 •   Unified cross-          •   SDI (pending
•   Greater focus on                                     channel                     regulatory approval)
    lead gen and new                                     Conversation API        •   Wavy (pending
    sales                                            •   RCS-as-a-Service            regulatory approval)
                                                         and SMSF for
                                                         mobile operators                                    13
Accelerating growth in Messaging

                     Messaging (SEKm)
1,800                                                      •   US tech companies continue
1,600                                                          to fuel growth
1,400
1,200
                                                           •   Rising volumes as businesses shift
                                                               from email to mobile messaging
1,000
 800                                                       •   myElefant & TWW included since
 600                                                           mid-October 2019, Chatlayer since
 400                                                           April 2020
 200
                                                           •   Investments in software for next-
   0
                                                               generation messaging
        Q1 Q2 Q3 Q4 Q1 Q2 Q3 Q4 Q1 Q2 Q3 Q4 Q1 Q2

           2017              2018            2019   2020
                  Revenue   Gross profit   EBITDA

                                                                                                   14   14
Rising message volumes

      Number of transactions per month (billions)          •   Acquisition of TWW and myElefant
                                                               adding significant volumes in
4.0                                                            October-November 2019
3.5                                                        •   Significant volume increase in
3.0                                                            March 2020 was partly related to
                                                               Covid-19
2.5

2.0                                                        •   Growth from existing customers,
                                                               new customers, new use cases
1.5

1.0                                                        •   58% growth in transactions
0.5                                                        •   32% growth in Gross profit
0.0

         2016       2017      2018       2019       2020

                                                                                                  15
Gross profit per transaction

OPEX/transaction & Gross profit/transaction (SEK)

0.050                                                                                                  •   Gross profit is the primary
                                                                                                           bottom line driver
0.040
                                                                                                       •   GP/transaction stable compared to
0.030                                                                                                      the same period last year

0.020
                                                                                                       •   Reduced Opex/transaction due to
                                                                                                           economies of scale
0.010

0.000
        1 2 3 4 5 6 7 8 9 10 11 12 1 2 3 4 5 6 7 8 9 10 11 12 1 2 3 4 5 6 7 8 9 10 11 12 1 2 3 4 5 6

                  2017                      2018                       2019                2020

              GP/transaction (R3M)                        OPEX/transaction (R3M)

                                                                                                                                               16
Rising margin in Messaging

                Messaging EBITDA/Gross profit
                                                                                                     •   Revenue and gross margin depend
60%                                                                                                      on mix of terminating markets
50%                                                                                                  •   EBITDA/Gross profit shows margin
                                                                                                         excluding mobile operator charges
40%

                                                                                                     •   Adding traffic volume increases
30%
                                                                                                         gross profit more than it increases
20%
                                                                                                         opex

10%                                                                                                  •   Continued opex investments to
                                                                                                         capture growth
0%
      1 2 3 4 5 6 7 8 9 10 11 12 1 2 3 4 5 6 7 8 9 10 11 12 1 2 3 4 5 6 7 8 9 10 11 12 1 2 3 4 5 6

                2017                      2018                       2019                2020

                                                                                                                                               17
Covid-19 impact on Voice and Video

                  Voice and Video (SEKm)
80
70                                                                     •   Sharp decrease in demand for
60                                                                         Number masking from ride hailing
50                                                                         customers as Covid-19 reduces
40                                                                         travelling
30
                                                                       •   Positive underlying trends in
20
                                                                           products for Number verification
10
 0                                                                     •   Increasing OPEX to ensure quality
-10                                                                        of service and add functionality
      Q1   Q2 Q3 Q4    Q1   Q2 Q3 Q4        Q1    Q2 Q3 Q4   Q1   Q2

           2017             2018                   2019      2020

                  Revenue    Gross profit        EBITDA
                                                                                                              18   18
Headwind in Operators

                   Operators (SEKm)
50

40                                                       •   Lengthened sales cycles as with
                                                             lower operator investments due to
30                                                           Covid-19
20                                                       •   Currency headwinds
10                                                       •   Investments in 5G SMSF and RCS-
                                                             as-a-Service for mobile operators
 0

-10
      Q1 Q2 Q3 Q4 Q1 Q2 Q3 Q4 Q1 Q2 Q3 Q4 Q1 Q2

         2017             2018             2019   2020
                Revenue   Gross profit   EBITDA                                              19   19
Q2 2020
Financials
Income statement
                                          Q2        Q2
                                                                                 •   Non-recurring items of SEK 30.8
SEK million                            2020       2019        2019      R12M
                                                                                     million in Q2 20 relate to
Net sales                             1,621.9    1,176.7   5,035.6    6,003.2
                                                                                     acquisitions and integration cost
Cost of goods sold and services       -1,161.6   -855.6    -3,641.4   -4,312.7
Gross profit                           460.3      321.1     1,394.1   1,690.5    •   Amortization of acquisition-related
Other operating income                   34.1      25.6       103.1     118.6        assets does not affect cash flow
Work performed and capitalized           17.7        9.1      38.6       56.2
Other external costs                   -125.7     -79.6     -328.7     -416.4    •   Adjusted EBIT excludes non-
Employee benefits expenses            -198.0     -132.6     -537.6     -667.6        recurring items as well as
Other operating expenses                -42.8     -29.4      -113.9     -131.2       amortization of acquisition-related
EBITDA                                  145.7     114.2      555.5      650.1        assets
Depreciation, amort. and impairment     -57.6      -41.1    -183.9     -213.8    •   Adjusted EBIT of SEK 161.7 million
EBIT                                     88.1      73.2      371.6     436.2         (104.1) in Q2 20
Finance income                            2.0       0.8        18.6    -145.2
Finance expenses                       -33.8       -8.3       -35.2      111.7
Profit before tax                       56.3       65.7      355.0     402.8

Current tax                            -34.3      -18.2      -83.8      -127.2
Deferred tax                              15.1      5.8        3.3        21.3
Profit for the period                    37.1      53.3      274.5     296.9
                                                                                                                           21
Accelerating Gross profit growth
                           Organic                        Acquisitions FX
SEKm
                            +24%                             +19%      +1%
500                                                           60             4    460     •   43% growth in Gross profit despite
                91           -10        -5         0                                          headwinds in Operators and Voice
400
                                                                                              and Video
       321
300                                                                                       •   24% organic Gross profit growth

200                                                                                       •   19% contribution from acquisitions

100
                                                                                          •   Big US tech companies and
                                                                                              acquisitions fuelling growth
  0
                                                                                          •   SEK 11m negative FX effect on
       Q2 19

               Messaging

                                       Operator

                                                                                  Q2 20
                           Voice and

                                                              Acquisitions
                                                  Other

                                                                             FX
                                                                                              Adjusted EBITDA in the quarter
                            Video

                                                                                                                                   22
Headcount increase
                                                              +47%
                                                                              794
800                                                                     744         •   Headcount rising due to
700                                                               654
                                                                                        recruitment and acquisitions
600                                                   542
                                                            573
                                                                                    •   Near-term negative effect on
500                                   462 469
                                                496                                     EBITDA before new initiatives
                                441
            392 412 412
                        420                                                             translate into higher revenues and
      366
400                                                                                     gross profit
300
                                                                                    •   Headcount at 822 at end of Q1
200

100                                                                                 •   Headcount increase in line with
                                                                                        previous quarters excluding
 0
                                                                                        acquisitions
      Q1    Q2   Q3   Q4   Q1   Q2    Q3   Q4   Q1    Q2    Q3    Q4    Q1    Q2

             2017                2018                  2019              2020       •   Cautious recruitment during Q2
                                                                                        due to Covid-19
       Average number of employees         Average number of consultants

                                                                                                                          23 23
Reconciling Cash flow with EBITDA

                                    Q2      Q2
SEK million                       2020    2019    2019     R12M
                                                                    •   Strong underlying cash generation
Adjusted EBITDA                   176.5   114.2   573.5    708.0
Paid interest                      -9.5    -6.0   -20.8    -24.6    •   Delayed tax payments in the
Paid taxes                         -6.4   -34.7   -117.4    -71.6       United States
Other                             -33.9     0.5    18.2     -15.9
Cash flow before changes in                                         •   72% cash conversion from Adjusted
working capital                   126.7   74.0    453.5    595.9        EBITDA to Cash flow before
                                                                        changes in working capital in Q2 20
Cash flow before changes in
working capital/Adjusted EBITDA   72%     65%      79%      84%
                                                                    •   87% cash conversion from EBITDA
                                                                        which also includes costs related to
                                                                        acquisitions and integration

                                                                                                            24
Cash flow
                                        Q2       Q2
SEK million                           2020     2019      2019     R12M
Cash flow before changes in
working capital                       126.7    74.0     453.5     595.9
Changes in working capital            137.0     56.2    -126.2     -38.6
Cash flow from operating activities   263.6    130.2    327.3     557.3
                                                                            •   Positive development in Net
Net investments in fixed assets                                                 Working Capital
and intangible assets                 -24.2    -12.0    -56.0      -80.7
Change in financial receivables         -1.4    -3.0      12.1       11.5   •   Successful directed new share
Acquisition of subsidiary             -81.4    -74.4   -668.5     -708.4
                                                                                issues contributing SEK 700 million
Cash flow from investing activities   -107.1   -89.4    -712.4    -777.7
                                                                                to fund acquisitions
New borrowing                              -       -   1,453.4   1,453.4
Amortization of bank loan             -211.4   -24.1   -756.7     -921.1
Amortization lease liability            -7.1    -6.3     -25.8     -27.3
New share issue/warrants              700.8      0.5       2.1    2,211.7
Cash flow from financing activities   482.4    -29.9    673.1    2,716.7
Cash flow for the period              638.9     10.9    288.0    2,496.3

                                                                                                                  25
Integration process

Deal scouting       Signing                                                               Closing

    Due diligence                            Integration planning                                   Integration phase

                                               • Purchase agreement signed March 2020                 • Transaction closed October 2019
                                               • Regulatory approval process is ongoing               • Platform integration ongoing
                                               • Expected to close H2 2020
                                               • Integration planning together with Wavy
                                                                                                      • Transaction closed October 2019
                                                 management, as applicable under
                                                 competition rules                                    • Completed first stage of U.S. launch
                                                                                                      • Continued integration with Sinch
                                                                                                        platform is ongoing
                                               • Purchase agreement signed May 2020
                                               • Regulatory approval process is ongoing
                              SAP Digital                                                             • Transaction closed April 2020
                                               • Expected to close H2 2020
                              Interconnect                                                            • AI-powered conversations now powered
                                               • Integration planning together with SDI                 by Sinch connectivity
                                                 management, as applicable under                      • Deeper integration is ongoing
                                                 competition rules

                                               • Purchase agreement signed June 2020
                                               • Expected to close Q3 2020
                                               • Further synergy assessment after ACL and
                                                 SDI transactions have closed

                                                                                                                                               26
Financial targets
                                                                                 Targets:

          Adjusted EBITDA per share, rolling 12 months                           •   Adjusted EBITDA per share to grow
                                                                                     20% per year
14.0
                                                                                 •   Net debt < 2.5x adjusted EBITDA
12.0                                                                                 over time
10.0

8.0
                                                                                 Performance:

6.0
                                                                                 •   Adjusted EBITDA per share grew
                                                                                     57% in Q2 20, measured on a rolling
4.0                                                                                  12 month basis
2.0                                                                              •   Net debt/EBITDA of -2.1x, measured
0.0
                                                                                     on a rolling 12 month basis
       Mar Jun Sep Dec Mar Jun Sep Dec Mar Jun Sep Dec Mar Jun Sep Dec Mar Jun

            2016            2017            2018            2019        2020

                                                                                                                         27
Financial leverage

                      Pro forma net debt/Adjusted EBITDA

                                                                                                        2.2
                                                                                1.6
                                                                                                              •   Pro forma calculation includes last
                                                                                                                  12 months of Adj EBITDA for
                                                                                                                  acquired entities
                                                                                                              •   Financial target is to maintain Net
                                                                                                                  debt < 2.5x adjusted EBITDA over
                                                          -1.1                                                    time
              -2.1                  -2.1                                                                      •   Leverage expected to decline in
                                                                                                                  coming periods as EBITDA grows
           Q2 20               + TWW,                   + ACL                 + SDI                + Wavy         and cash is generated
          reported           myElefant &
                              Chatlayer

Acquisitions of Wavy and SDI are both pending regulatory approval.                                                                                      28
Adj EBITDA for the 12 months ending 31 March is used to calculate impact of SDI, Wavy and ACL Mobile.
Key priorities ahead

Continued growth with US-based, global tech companies
Initiatives for broadened growth across the base

Closing of pending transactions
Integration planning for ACL, SDI, and Wavy

Continued strengthening of our connectivity offering
Investment in SaaS products for advanced, next-generation messaging

                                                                      29
Thanks!

Copyright© 2019 CLX Communications AB (publ). All rights reserved. NDA Confidential.   30
You can also read