3U HOLDING AG Success in Megatrends Corporate Presentation Spring 2021 - weclapp SE
←
→
Page content transcription
If your browser does not render page correctly, please read the page content below
3U HOLDING AG
Success in Megatrends
Corporate Presentation Spring 2021
SUCCESSFUL BUSINESS IN THREE MEGATRENDS

            ITC Segment                 Renewable            SHAC Segment
           Information and               Energies            Sanitary, Heating,
    Telecommunication Technology         Segment              Air Conditioning

        – Cloud Computing          – Power Generation      – E-Commerce
          ERP-Platform for SME
                                   – Project               – Planning
        – Telecommunications         Acquisitions and
                                     Disposals             – Production
        – DCS
                                   – Project development   – Logistics
        – Software-Licensing

                                                                                  2
INVESTMENT CASE 3U HOLDING
3U Growth Strategy:
Enhance Technologies, Overcome Barriers to Growth, Tap Potential
Group purpose: Increase shareholder value to the benefit of customers, suppliers, staff, and stakeholders
Successful business models in three megatrends:
cloud computing
e-commerce
renewable energies
Ongoing strategic focus on the core growth areas:
Cloud Computing and E-Commerce – Goal: Market leadership positions!
Profitable business models in all three segments
Dividend increased for five years in a row
Significant organic revenue growth ahead for 2021 and beyond
Development and employment of leading edge technologies from Next Generation Networks in Telecommunications
and DCS to Artificial Intelligence / Machine Learning in Cloud Computing and E-Commerce
Option: possible IPO of weclapp SE
3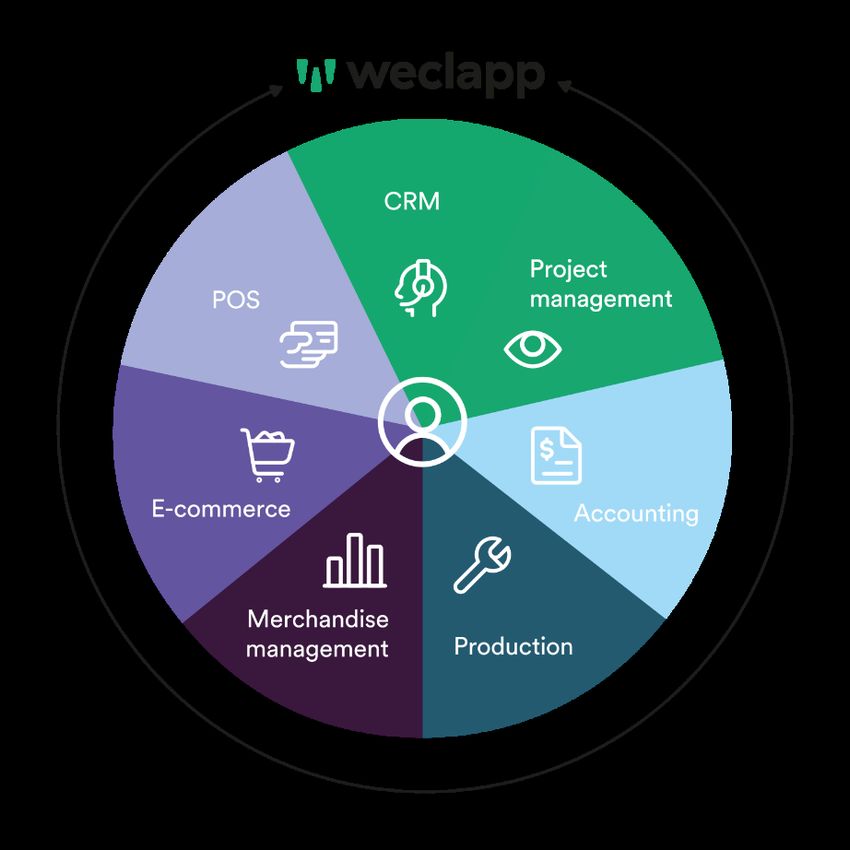
Renewable Energies:
Wind and solar power

                       4
PLEASING EARNINGS AND CASH FLOW
IN THE RENEWABLE ENERGIES SEGMENT
Successful project manager in the field of renewable energy
• Cash flow is generated from income from power generation
• Power generation capacity currently at around 54 MW
• Results mainly depend on weather conditions
• Value creation through acquisitions and disposals of wind farms
5Key strategic focus areas :
E-Commerce and Cloud Computing
6KEY GROWTH DRIVERS AND STRATEGIC FOCUS AREAS:
E-COMMERCE AND CLOUD COMPUTING
Revenue in EUR mn CAGR: 35 %
23.7 ≈ 25.0
20.6
17.4
15.7
11.7 12.9
9.5
6.0
4.0
1.5
2011 2012 2013 2014 2015 2016 2017 2018 2019 2020 2021 (e)
CAGR: ≈ 100 %
7.3 ≈ 11.0
4.6
3.0
1.9
1.0
0.3 0.5
0.1
2013 2014 2015 2016 2017 2018 2019 2020 2021 (e)
Organic Growth Continues – Strategic Acquisitions Intended 7Selfio :
Successful in online trading
thanks to high quality of advice
and marketing
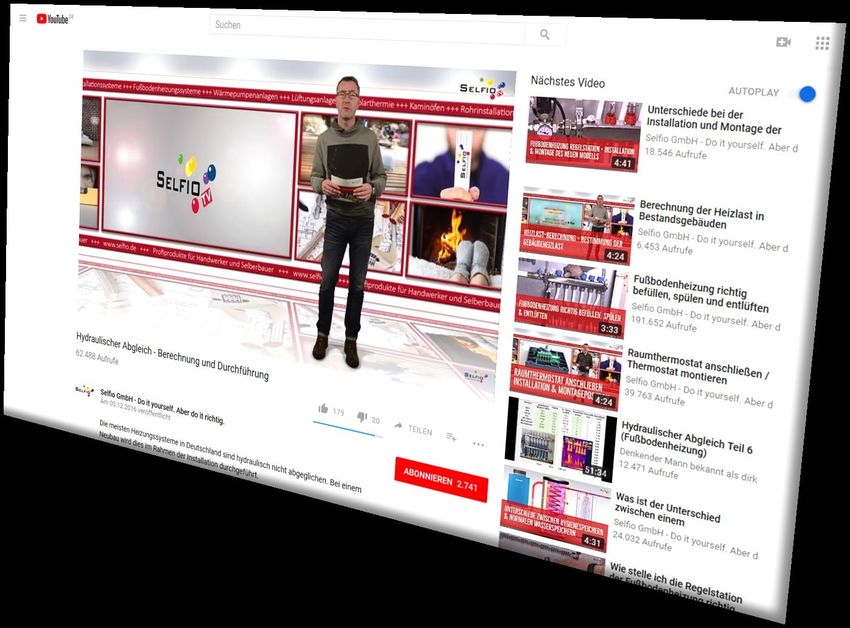
8SELFIO: FACTS AND FIGURES
• Founded in 2011, Selfio operates an online shop (www.selfio.de) for professional DIY products, including well-known
brands such as Buderus, Wilo, Grundfos, Biral, Junkers, Viessmann and Wolf.
• USP: high quality of advice – online and personal
• Over 9 million video clicks on our YouTube channel SelfioTV –
more than 100 videos with installation instructions and tips
• Over 10,000 YouTube subscribers
over 24,500 followers on Facebook
• Over 1.9 million unique visitors to the website each month
• Over 150,000 paying customers in FY 2020: 90% end customers,
10% business customers
• Tailwind from the market: E-commerce demand in the SHAC sector
set to rise at an above-average rate of over 10% p.a. up to 2030
Strategy: Expansion of 3U’s online trading activities into a leading,
profitable trading platform for sanitary, heating and air conditioning technology (SHAC)
9SELFIO: TAILWIND FROM THE MARKETS
Strategy
• Expansion of 3U’s online trading activities into a
leading, profitable trading platform for sanitary,
heating and air conditioning technology (SHAC)
by means of internal and external growth
• Improvement in profitability
Growth rate German online trading per industry
• E-commerce demand in the
SHAC sector set to rise at an
Growth rate 2010 – 2018 in %
above-average rate of over
10 % p.a. up to 2030
• Shift in demand for SHAC
towards online trading has
only just begun
• 3U playing an active role in
consolidation of the market
Growth rate 2015 – 2018 in %
Source: HDE Online-Monitor 2019 10SELFIO GROWTH STRATEGY
GOALS
Improve
Profitability
Increase
Market Share
Top 100
Online Vendors
GROWTH
DRIVERS
CONTINUOUS IMPROVEMENT
Supply chain optimisation and enhancement
Optimisation of data usage/algorithms/software
11weclapp :
Technology leader
Price leader
Goal : Market leader !
12WECLAPP: BUILT FOR TEAMS
One login. One user interface. One platform
Genuinely cloud-based:
consistent, scalable, expandable, universal, low price
Platform: Java EE kernel, many extensions, partly open source,
API first (i.e. provide customers with multiple access points to
third party applications)
weclapp helps master SMB challenges
comprehensive business process coverage
enabling and encouraging collaboration,
making business processes more efficient and comfortable
providing competitive advantage
Business model:
Software as a Service – 90 % recurring revenue
Advance payment for 12- and 24-months contracts
Cutting-edge technology at a very reasonable price
No inherent barriers to growth
13WECLAPP CLAIMS THE POLE POSITION:
TECH LEADER AND PRICE LEADER
ERP ERP
2.0 3.0
On-premises ERP Cloud-based systems weclapp’s
becomes obsolete are superior to ERP 2.0 competitive advantage:
no inherent barriers to growth
• Server installation tedious and • Quick onboarding, • Based on operating business
expensive no in-depth customization processes rather than financial
• Updates and new versions • Updates by pushing a button accounting
need to be implemented on • Collaboration • Community and marketplace
site • Designed for global use –
• Big Data as prerequisite for
• Customization requires time designing and implementing no regional or industry bias
and money and results in machine learning algorithms • Multi-language versions
isolated solutions per client available
• No collaboration • Best price-/performance-ratio
• No “Big Data” • Quest for market leadership
14ADVANCING ALONG THE GROWTH PHASE!
• Revenue growth of over 100 % (CAGR)
over the past years
• Currently more than 3,500 corporate customers
and more than 10,000 concurrent users per day
in 35 countries, 7 languages with a focus on
Germany, Austria, Switzerland
• EBITDA sustainably > 25 %
3.500
3.000
Medium and long-term goals
Total net customers
2.500
• Grow faster than the market (organic and through
2.000 acquisitions)
1.500 • Become the preferred ERP platform for SMB around
the globe
1.000
• weclapp to become one of the leading cloud CRM and
500
ERP providers in Germany (in Europe, and worldwide)
0
Jul 13
Jul 14
Jul 15
Jul 16
Jul 17
Jul 18
Jul 19
Jul 20
Jan 13
Jan 14
Jan 15
Jan 16
Jan 17
Jan 18
Jan 19
Jan 20
Jan 21
15WECLAPP GROWTH STRATEGY
Market Leadership
International
Expansion
IPO
GROWTH
DRIVERS GOALS
16Events and Results
of the 2020 financial year
19EVENTS DURING THE 2020 FY
COVID 19 measures only selectively affect 3U / positive special effects in some business areas /
revenue growth of >18 % / profitability mostly improved
In November 2020, staff was requested to work from home again; return to two shift operation in distribution centre
Cloud Computing (weclapp) is persistently driving growth with high contribution to earnings
COVID-19 measures are leading to a further surge in digitisation and even stronger demand for cloud computing
Telecommunications business area shows revenue growth, partly due to COVID-19-caused special demand for
telephony
12-point-plan in place to increase profitability in SHAC segment: focus on procurement, product mix (incl. own brands),
marketing efficiency
Wind yield and solar irradiation overall at a good level
Roge wind farm consolidated for the first time (+ revenue, EBITDA, depreciation, minority interests)
Sale of the externally used parts of the Adelebsen property – transaction closed in the meantime, effects to be
recognized in Q1/2021
Sale of participation in ClimaLevel Energiesysteme GmbH – enhanced focus on online trading in SHAC segment
Sale of Lüdersdorf wind farm
Construction projects Würzburg, Koblenz on schedule
20STRONG GROWTH IN 2020 – “RESILIENT” BUSINESS MODELS
Group revenue and earnings in EUR mn: Q4/2019 vs. Q4/2020 and FY/2019 vs. FY/2020
Revenue
• 3U business models mostly “resilient”
61.1
51.4
• Enhanced efficiency and better margins throughout
• Prior year earnings boosted by sale of company site
• Higher depreciation and amortisation as well as
higher tax, as expected
16.6
13.2 • 2020 effects from sale of assets as planned
2019/Q4 2020/Q4 2019/FY 2020/FY
EBITDA Net result
11.6
10.1
4.0 4.1
3.3
5.7 5.1 2.7
2019/Q4 2020/Q4 2019/FY 2020/FY 2019/Q4 2020/Q4 2019/FY 2020/FY
21ONLY SELECTIVELY AFFECTED BY ANTI-COVID MEASURES
WFH-TREND SUPPORTS DEMAND DEVELOPMENT
Segment revenue and EBITDA in EUR mn: Q4/2019 vs. Q4/2020 and FY/2019 vs. FY/2020
■ Revenue ITC
EBITDA • ITC: Strong growth in Cloud Computing; increased
demand for telephony and value added services
19.3 • Renewable Energies: Roge wind farm included
14.1 for the first time; wind yield, solar irradiation at a
good level
5.5
3.7 5.0 • SHAC: Still higher expenses due to
2.8
0.9 1.3 COVID-19-measures, 12-point-plan for increased
2019/Q4 2020/Q4 2019/FY 2020/FY profitability shows positive effects
Renewable Energies SHAC
Effect from sale of wind farm in 2020 33.1
30.4
9.1
7.2 8.8
4.9 7.9 9.2
3.2
1.7 2.0
0.6 1.5 1.1
0.0 -0.1
2019/Q4 2020/Q4 2019/FY 2020/FY 2019/Q4 2020/Q4 2019/FY 2020/FY
22STRONG BALANCE SHEET AND CASH POSITION
INVESTMENT IN NEW DISTRIBUTION CENTRE
in EUR mn / % 31 December 31 December
2020 2019
Total assets 85.9 80.5
Inventory 8.6 7.8
Cash and cash equivalents 26.4 20.6
Shareholdersʼ equity 52.0 46.5
Equity ratio 60.5 % 57.8 %
Debt to equity ratio (liabilities/equity) 65.2 % 73.0 %
Net cash (cash and cash equivalents – financial liabilities ) 9.3 2.8
Free cash flow (1 Jan – 30 December) / (Op. CF + Inv. CF) 0.0 3.4
23FORECAST 2021: CONTINUED STRONG ORGANIC GROWTH
Group KPI in EUR mn: 2018 – 2021 (e)
Revenue EBITDA-Margin
19 % – 21 %
58 – 63 19.6 % 18.9%
61.1
FY20 disposals: EUR 8.2 mn
Organic growth FY21>FY20: 8.2 14.0 %
+11.5 % - +21.1 % 51.5
48.0
58,0
2018 2019 2020 2021 (e) 2018 2019 2020 2021 (e)
EBITDA 11 – 13
Net result
11.6 4.1 2–4
FY20 disposals: EUR 1.3 mn 10.1 3.3
1.3
Organic growth FY21>FY20:
+6.2 % - +25.5 %
6.7 1.9
11,0
2018 2019 2020 2021 (e) 2018 2019 2020 2021 (e)
24Summary
25ENHANCE OUR TECHNOLOGIES, OVERCOME
BARRIERS TO GROWTH, DEVELOP NEW POTENTIAL
2020 was a successful year and 2021 will be even better.
We see strong potential for further revenue growth and increased
earnings in the following years.
We create value
• thanks to the rapid growth story in cloud computing
• thanks to the dynamic expansion of our online trading activities in
the SHAC segment to achieve a market-leading position
• thanks to the power generation from renewable energy with strong
earnings and cash contributions
26Thank you for attending!
Questions welcome.
27Appendix
28Share Information
29DIVIDEND, SHARE PRICE AND SHAREHOLDER STRUCTURE
Share price performance (12 months, as of 9 April 2021) Shareholder Structure
3.4 %
29.6 %
65.2 % 67.0 %
Free Float
67,0 %
Management and Supervisory Board
Lupus alpha
Average daily trading volume: >40.000
Information on the share
Dividend policy:
• Roughly half of the consolidated net sustainable profit shall be Market segment Prime Standard
distributed in the form of dividends Number of shares 35.31 million
Dividend for 2020 outstanding
• For the 2020 financial year, a dividend of EUR 0.05 is being proposed; ISIN DE0005167902
to be paid without deducting capital gains tax (payment out of the tax
deposit account) Bloomberg ticker UUU
30FINANCIAL CALENDAR & CONTACT
Date Event
12 May 2021 Publication of Q1/2021 Quarterly Announcement
17 May 2021 Participation in Equity Forum Spring Conference, Frankfurt
20 May 2021 Annual General Meeting of Shareholders
11 August 2021 Publication of Half Year Financial Report
10 November 2021 Publication of Q3/2021 Quarterly Announcement
Contact:
Dr Joachim Fleïng
Head of Investor Relations
3U HOLDING AG
Frauenbergstraße 31–33
35039 Marburg
Tel. +49 6421 999 1200
Fax +49 6421 999 1222
ir@3u.net
www.3u.net
31Disclaimer The information in this presentation does not constitute an offer to sell or an invitation to submit an offer to purchase or subscribe for shares of 3U HOLDING AG but rather is intended exclusively for information purposes. German legal framework The information contained in this presentation is aimed exclusively at individuals whose residence/place of business is in Germany. Access to the above information is permitted only for these interested parties. The publication of this information on the Internet does not constitute an offer to individuals whose residence/place of business is in another country particularly the United States of America, the United Kingdom of Great Britain and Northern Ireland, Canada or Japan. The shares of 3U HOLDING AG are publicly offered for purchase and subscription only in the Federal Republic of Germany. The information contained in this presentation may be distributed in other jurisdictions only in accordance with the applicable legal requirements there, and individuals who gain possession of this information must inform themselves of the applicable legal requirements there and comply with these. Errors and omissions excepted. Forward-looking statements Any forecasts, estimates, opinions or expectations that are expressed or forward-looking statements that are made in the information contained in this presentation may be associated with known and unknown risks and uncertainties. The actual results and developments may therefore differ significantly from the stated expectations and assumptions.
You can also read