THE #1 WIRELESS BACKHAUL SPECIALIST - Investor Presentation // August 2019 - Ceragon

Page created by Danny Fleming
 
CONTINUE READING
THE #1 WIRELESS BACKHAUL SPECIALIST - Investor Presentation // August 2019 - Ceragon
THE #1 WIRELESS BACKHAUL SPECIALIST
                                    Investor Presentation // August 2019

Proprietary and Confidential
THE #1 WIRELESS BACKHAUL SPECIALIST - Investor Presentation // August 2019 - Ceragon
Safe Harbor
  This presentation contains statements concerning Ceragon's future prospects that are "forward-looking statements" as defined in the
  Private Securities Litigation Reform Act of 1995. Such forward-looking statements are based on the current beliefs, expectations and
  assumptions of Ceragon's management. Examples of forward-looking statements include: projections of demand, revenues, net
  income, gross margin, capital expenditures and liquidity, competitive pressures, order timing, growth prospects, product development,
  financial resources, cost savings and other financial matters. You may identify these and other forward-looking statements by the use
  of words such as "may", "plans", "anticipates", "believes", "estimates", "targets", "expects", "intends", "potential" or the negative of
  such terms, or other comparable terminology. These forward-looking statements are subject to risks and uncertainties that may cause
  actual results to differ materially, including the risks relating to the concentration of a significant portion of Ceragon's expected
  business in certain geographic regions and particularly in India, where a small number of customers are expected to represent a
  significant portion of our revenues, including the risks of deviations from our expectations of timing and size of orders from these
  customers; the risk that the current slowdown in revenue from India could extend for a longer period than anticipated: risks associated
  with any failure to effectively compete with other wireless equipment providers; the risk that the rollout of 5G services could take
  longer than anticipated; and other risks and uncertainties detailed from time to time in Ceragon's Annual Report on Form 20-F and
  Ceragon's other filings with the Securities and Exchange Commission, that represent our views only as of the date they are made and
  should not be relied upon as representing our views as of any subsequent date. We do not assume any obligation to update any
  forward-looking statements.

Proprietary and Confidential                                                                                                             2
THE #1 WIRELESS BACKHAUL SPECIALIST - Investor Presentation // August 2019 - Ceragon
Ceragon Snapshot
 • Ceragon is the leading provider of wireless backhaul solutions to mobile                                  GLOBAL SCALE
      operators and private networks globally
                                                                                                    +2,000        total customers
 • 20+ years of technology R&D driving significant barriers to entry; founded in
      1996 and headquartered in Tel Aviv, Israel                                                  +1,000,000      systems deployed

 • Leading market position is driven by its strong technology advantage:
                                                                                                                  countries with
      •    Vertically integrated solution from chipset to system drives unmatched performance        +140         systems deployed
      •    Ceragon’s solutions have been adopted by Tier 1 mobile operators and leading private
           networks globally
                                                                                                     ~900         employees globally

                                                                                                  $2.45-$5.04     52 week low/high(a)
      • Strong execution has driven strong net income growth and significant margin
           expansion:
           •     2018 was 4th consecutive year of increasing net income
           •     Gross margins have increased from 25.2% to 33.9% (b)

           (a)   Source: Nasdaq as of 8/9/19
           (b)   Represents non-GAAP gross margin in FY2014 and FY2018

Proprietary and Confidential                                                                                                            3
THE #1 WIRELESS BACKHAUL SPECIALIST - Investor Presentation // August 2019 - Ceragon
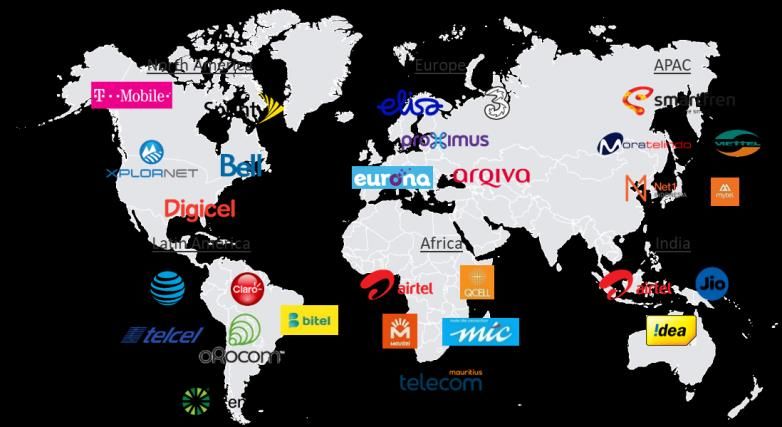
CERAGON’S BUSINESS AND
                                 LEADERSHIP POSITION

Proprietary and Confidential                            4
THE #1 WIRELESS BACKHAUL SPECIALIST - Investor Presentation // August 2019 - Ceragon
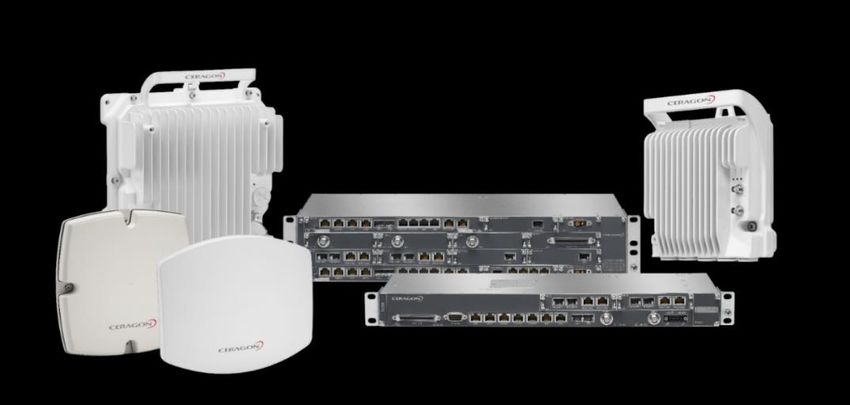
Wireless Backhaul
Critical Technology to Gigabit-LTE and 5G Networks
• Wireless backhaul serves as an alternative to fiber-optic networks and a primary solution for network densification

• Critical since it is a faster and more cost effective deployment vs. fiber based deployment
• Connects approximately 50% of all backhaul networks

• Proportion of fiber vs. wireless backhaul is expected to remain fairly constant through the evolution to 5G networks

Proprietary and Confidential                                                                                             5
THE #1 WIRELESS BACKHAUL SPECIALIST - Investor Presentation // August 2019 - Ceragon
Best-of-Breed Strategy: Sell Customer Value
              Seek Best-of-Breed Focused Deals                         Avoid Bundled/Price Focused Deals
  • Focus on service providers seeking the best wireless          • Avoid end-to-end network bundling, with no specific
      backhaul solution as main factor for vendor selection         vendor selection process for wireless backhaul

  • Focus on those customers that invest resources to             • De-emphasize customers that lack the skills/ resources
      assess vendors’ ability to address their network-specific     for thorough evaluation of wireless backhaul vendors
      challenges
                                                                  • Avoid situations where price is the primary or only factor
  • Most private network customers are part of this category        to determine vendor selection

Proprietary and Confidential                                                                                                     6
Largest Specialist Serving the Best of Breed
               Global Wireless Backhaul Market (2018)    Best-of-Breed Market Segment (2018)

                                                                                  Others, 6%
                      USD [M]                                               ZTE
                                                                            2%
                       4000                                         Intracom
                                                                       5%                         Ceragon, 18%
                       3500

                       3000                               Aviat, 8%
                                Best of breed
                                      1720
                       2500        $1.95B
                       2000

                       1500           1720              Nokia, 9%                                             NEC, 17%
                       1000     Bundled deals
                        500        $1.95B
                          0

                                                              SIAE, 10%
                                                                                                   Huawei, 13%
                                                                                  Ericsson, 12%

                                                                          Sources: SkyLight Research, March-2019.
                                                                              Ceragon estimates, March-2019.

Proprietary and Confidential                                                                                             7
Technological Industry Leadership
                                                   Ceragon’s Multicore technology resolves
                               the key challenges associated with wireless backhaul as networks transition to 5G
                                                  Capacity | Spectrum | Energy | Real-estate
                                                                   4G evolution to 5G

Industry’s only                                                                                        Industry’s only

                                  Dual-core solutions                                                                         Octa-core solutions
X4 Capacity, x2 Spectrum reuse gain, ½ Energy                                                          X16 Capacity, x4 Spectrum reuse gain, ⅛ Energy

                       2013            2014        2015           2016           2017           2018            2019         2020

                                                             Two separate Cores solutions
                                                    X2 Capacity, NO Spectrum reuse gain, NO Energy savings
Proprietary and Confidential                                                                                                                            8
Key to Innovation is Vertical Integration
Enables us to introduce features that keep pace with the evolution to 5G

                                          •     Chip design       Full
                                          •     Software design   Vertical
                                          •     Hardware design
                                                                  Integration
                                          •     Systems

                                             FIBEAIR IP-20 PLATFORM
                               MULTICORE EVERYWHERE - IN ALL DEPLOYMENT SCENARIOS

                                      SDN/NFV

Proprietary and Confidential                                                        9
Disaggregated IP50 Wireless Bbackhaul
     resolves growing 5G challenges

                                                                                 A single radio

          All-outdoor radio /
           Split mount radio
                                                                                 Networking SW

     Indoor unit with integrated
router (hardware with software)
                                                                                 Networking standard HW

                       Breaking
      proprietary hardware-software combinations   Separating software from hardware in order
                from generalist vendors                  to innovate both more rapidly

     Proprietary and Confidential                                                                         10
IP-20 All-Outdoor Solutions Lead the Market Since 2013
Increasing demand for all-outdoor wireless backhaul

     • Simplified site acquisition
     • Fast installation and commissioning
     • Efficient use of limited spectrum
                                                           2016                2017                2018
     • Super-fast capacity upgrade path                                   Ceragon     Market   Source: SkyLight Research, March-2019.

                                                       Proportion of Ceragon’s equipment shipments represented by
                                                      all-outdoor units has increased significantly to >60%, compared
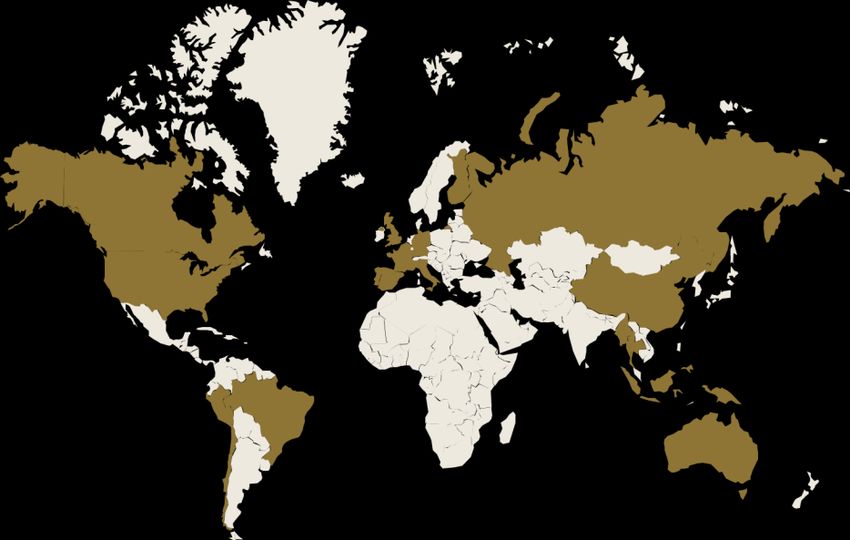
                                                       to
Global Reach and Strong Customer Base
• Over 1 million radios installed in
     over 140 countries                                                                       North America                  Europe   APAC

• Supplier for major global Tier 1 operators
• Multiple new 5G design wins in 2019

                                                                                              Latin America                  Africa   India

                               Europe
        Latin America           13%
             23%
                                        Africa
                                         11%

       APAC
                                  North America
                                                          Revenue by Geography — Last 12 months
       16%                                 Asia Pacific,
                                      15%      12%        • Presence in all regions
                                                                            Africa,6%
                       India                              • Purchasing
                                                   North America,
                                                                  Europe,13%
                                                                                    decisions made both centrally and regionally
                        22%                            14%

Proprietary and Confidential                                                                                                                  12
Operators in India Will Continue Network Spending
BIG-3 operators’ net subscriber                                    Data consumption growth expected to                          Aggressive 4G & 5G network investments
growth in 2018: 178M; moderating                                   continue with 72% CAGR through 2022                          expected due to hyper-competitive market,
in 2019                                                                                                                         with temporary near-term slow down for
                                                                                                                                local reasons
                            India subscribers
                        (millions, at end of period)                                                      Mobile Subscriptions by Technology (percent)
                                                                                                   100%
  1000

                                                                                                   80%
   800

                                                                                                   60%
   600                                                                             Jio                                                                             5G

                                                                                   Vodafone-Idea                                                                   4G
                                                                                                   40%                                                             2G& 3G
   400                                                                             Airtel

                                                                                                   20%
   200

                                                                                                    0%
      0
                                                                                                             2017                  2018                    2024
              2015          2016         2017         2018        2019-05
                           Source: Telecom Regulatory Authority of India (TRAI), 08/2019                     Source: Ericsson Mobility Reports: 06/2019, 11/2017

 Proprietary and Confidential                                                                                                                                               13
CERAGON’S OPERATING MODEL
                                 AND FINANCIAL POSITION

Proprietary and Confidential                               14
Track Record of Execution
• Focus on maximizing gross profit dollars   (Revenue)                                                       (in millions)                 (Net Income)
                                              $400                                                                                             $40
                                                             371
• Consistently profitable business model                                          349                                               344
                                             $350                                                                            332               $30
                                                                                                          294
                                             $300
                                                                                                                                    18         $20
                                                                                                                              15
                                                                                                           11
                                             $250
                                                                                     7                                                         $10
                                             $200
                                                                                                                                               $0
                                             $150

                                                                                                                  (a)                          -$10
                                             $100

                                               $50                                                                                             -$20
                                                             (25)

                                                $0                                                                                             -$30
                                                            2014                  2015                   2016                2017   2018
                                                                               Revenue                Non-GAAP Net Income
                                                     .
                                                     Note: Financial metrics are presented on a non-GAAP basis.

Proprietary and Confidential                                                                                                                          15
Strong Balance Sheet
• Stable cash position                                                        (U.S. dollars in millions)
                                                                                    (Unaudited)
• Little bank debt; >$30 million unused borrowing
                                                                                 a/o June 30, 2019
     capacity
• Credit facility is used as business tool to       Cash & cash equivalents              29.0
     accommodate short-term increase in working
                                                    Bank debt                             8.9
     capital needs
                                                    Inventory                           73.9

                                                    AR                                  121.4

                                                    DSOs                                 141

Proprietary and Confidential                                                                               16
Characteristics of Operating Model
Controllable elements are well-controlled
                                                                                                  Quarterly Operating Model
• Deals accepted based on contribution to gross profit dollars
                                                                           110                                                                                                                                                      40%

• Tendency toward trade-off between revenue and gross margin               100

                                                                           90                                                                                                                                                       35%
• Stringent operating expense control sustained for 2+ years
                                                                           80
                                                                                                                                                                                                                                    30%
                                                                           70
Quarter-to-quarter fluctuations                                            60
caused by factors difficult to control                                     50
                                                                                                                                                                                                                                    25%

• Changes in geographic mix of revenue – based on significant              40
                                                                                                                                                                                                                                    20%
                                                                           30
   variations in GM by region
                                                                           20                                                                                                                                                       15%
• Local regulatory shifts and decisions causing fluctuations in decision   10

   making within the operators                                              0                                                                                                                                                       10%

                                                                                  Q1:15
                                                                                          Q2:15
                                                                                                  Q3:15
                                                                                                          Q4:15
                                                                                                                  Q1:16
                                                                                                                          Q2:16
                                                                                                                                   Q3:16
                                                                                                                                           Q4:16
                                                                                                                                                   Q1:17
                                                                                                                                                           Q2:17
                                                                                                                                                                   Q3:17
                                                                                                                                                                           Q4:17
                                                                                                                                                                                   Q1:18
                                                                                                                                                                                           Q2:18
                                                                                                                                                                                                   Q3:18
                                                                                                                                                                                                           Q4:18
                                                                                                                                                                                                                   Q1:19
                                                                                                                                                                                                                            Q2:19
• Timing of recognizing revenue for various elements of project –
   based on large customers dictating delivery timing of each element            Gross profit                                     Revenue                              Gross margin                                        Opex

• Currency fluctuations, interest rates, seasonality, orders lumpiness,                   .
                                                                                          Note: Financial metrics are presented on a non-GAAP basis.

   changes in raw materials and components market

Proprietary and Confidential                                                                                                                                                                                                              17
THE FUTURE IS 5G
                               THE FUTURE IS CLOSER THAN WE THINK

Proprietary and Confidential                                        18
5G Evolution, Not a Single Event
       Today: Gigabit LTE momentum                                Tomorrow: 5G adoption subscribers
       >40 countries, >20 operators

       Gigabit LTE – enhanced mobile service, based on LTE-
       Advanced-pro standards, enabling “5G broadband” services
                                         Source: Qualcomm, 2018                                       Source: GSMA, 2017

Proprietary and Confidential                                                                                               19
5G Amplifies & Diversifies Wireless Backhaul Challenges

                               X5       X100

               DEPLOY MORE SITES    PROVIDE MORE   ENABLE 5G USE-CASES      DEAL WITH
                                      CAPACITY                           MASS DEPLOYMENT

Proprietary and Confidential                                                               20
Ceragon Strategic Roadmap – Single Channel Capacity
                                   2010                  2013       2018                 2019                   2021                  2022                   2023

                                   4G                   4.5G      Gigabit LTE                         5G New Radio, 4G Core Network            End to End 5G network
                                                                                                           (5G-NR Non Standalone)                   (5G-NR Standalone)

    Microwave                                       2Gbps         4Gbps                                      8Gbps
      4-42GHz                                                      (112MHz)                                   (224MHz)

E-Band, V-Band
     57-86GHz
                                                    1Gbps        2.5Gbps              20Gbps                                        40Gbps

W-Band, D-Band
    92-174GHz
                                   NEW SPECTRUM BANDS
                                                                                                                                    40Gbps           100Gbps
•      Multiples of each capacity listed above are achievable using Carrier-Aggregation technology to combine several channels into a single link
•      Multi-band technology also allows operator to combine MW and mmW to achieve higher capacity with greater reliability
    Proprietary and Confidential                                                                                                                                    21
Formulating a Broader 5G Strategy
Continuously refining both offensive and defensive strategies

    Technology Fit/Business Risk Analysis               New
                                                                             5G fixed
                                                                                        Value Creation/Financial Risk Analysis
                                                      small cell
    • Relevance to core competencies                  backhaul
                                                                             wireless   • Time to revenue
                                                                              access
    • Potential competitive advantage                 approach                          • Magnitude of investment required
    • Market size and maturity                                                          • Inherent profitability (gross margin)
    • Market growth potential                               Scale/diversification       • Impact on cash flow
                                                              in core business

                               Seeking best risk-adjusted opportunity to generate profitable growth

Proprietary and Confidential                                                                                                      22
SUMMARY

Proprietary and Confidential             23
Investment Highlights

✓ Leader in premium segment of the market

✓ Time-to-market advantage with technologically-advanced IP-20 and IP-50 platforms

✓ Competitive strengths provide ability to be selective, obtain major share of highest-value
  opportunities

✓ Financial stability enables continuous innovation and design-to-cost investment

✓ Multiple new 5G design wins during 1H:2019

✓ Positioned to capitalize on network evolution from 4G to 5G to generate long-term
  profitable growth

Proprietary and Confidential                                                                   24
THE #1 WIRELESS BACKHAUL SPECIALIST

Proprietary and Confidential
You can also read