Balancing real return potential with capital stability - Sean Munsie May 2021
←
→
Page content transcription
If your browser does not render page correctly, please read the page content below
Balancing real return
        potential with capital
        stability
        Sean Munsie

        May 2021

Allan Gray Proprietary Limited is an authorised financial services provider. © Allan Gray 2021   1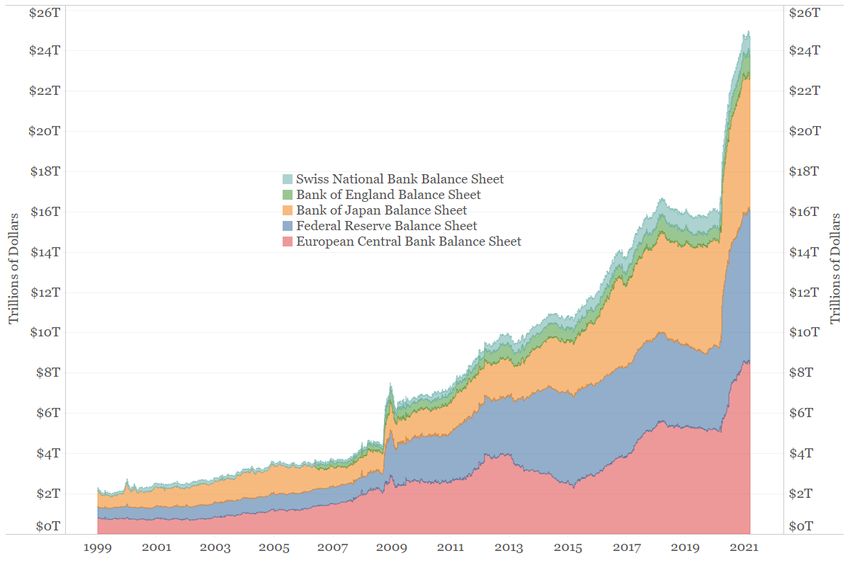
Considerations

                ▪       Opportunity set available to low-equity multi-asset funds
                ▪       SA bonds versus equities
                ▪       Local versus offshore

Source: Allan Gray research

Allan Gray Proprietary Limited is an authorised financial services provider. © Allan Gray 2021   2
Long-term real returns from a theoretical low equity strategy
10-year rolling annual returns
12%
10%
8%
6%
4%
2%
0%
-2%
-4%
-6%
-8%
1910 1920 1930 1940 1950 1960 1970 1980 1990 2000 2010 2020
Equities Bonds Cash
Source: Allan Gray research, Global Investment Returns Sourcebook 2013, Credit Suisse, IRESS, data to 31 December 2020 (NW030221ns)
Allan Gray Proprietary Limited is an authorised financial services provider. © Allan Gray 2021 3Long-term real returns premiums per asset class
Average annual return generated above inflation
14%
12%
12%
Real returns (annualised) in US$
10%
8%
8% 7%
6% 6%
6% 5%
4%
4% 3% 3%
2% 2%
2% 1%
2% 1% 1% 1%
0%
0%
-2% -1%
Since 1900 2001 - 2010 2011 - 2020
Local Equity Local Bonds Local Cash Global Equity Global Bonds Global Cash
Source: Allan Gray research, Global Investment Returns Sourcebook 2013, Credit Suisse, IRESS, data to 31 December 2020 (NW030221ns)
Allan Gray Proprietary Limited is an authorised financial services provider. © Allan Gray 2021 4SA and USA 10-year government bond real yields
13
11
9
7
Real yield (%)
5
3
1
-1
-3
-5
2000
2001
2002
2003
2004
2005
2006
2007
2008
2009
2010
2011
2012
2013
2014
2015
2016
2017
2018
2019
2020
SA real USA real
Source: IRESS data to 31.01.2021 (KBE11022021m)
Allan Gray Proprietary Limited is an authorised financial services provider. © Allan Gray 2021 5Cumulative central bank balance sheets (US$)
Significant growth in a short period
Source: Bianco research L.L.C (Fed, ECB, BoJ, BoE, SNB, Bloomberg)
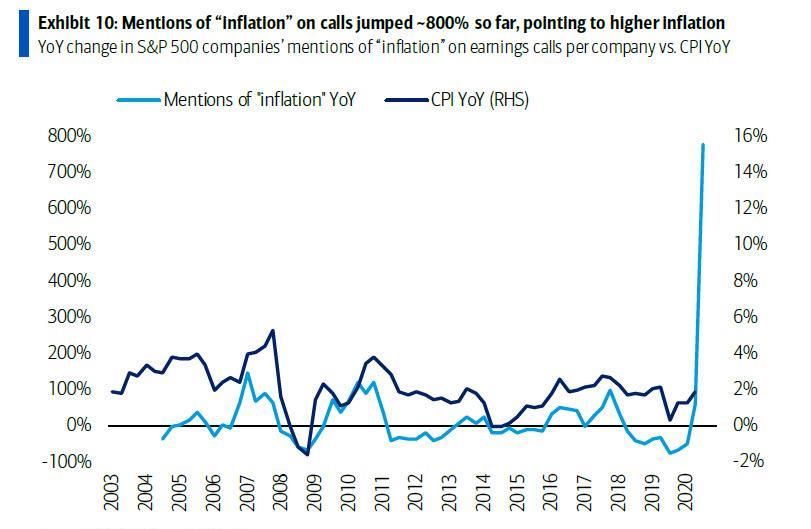
Allan Gray Proprietary Limited is an authorised financial services provider. © Allan Gray 2021 6Inflation expectations Source: BOFA May 2021 (BofA Global Researcb, Bloomberg) Allan Gray Proprietary Limited is an authorised financial services provider. © Allan Gray 2021 7
Inflation
                What could change?
                                                 Deflation winners                               Inflation winners
                                                     Globalisation                                 Protectionism
                                                       Wall Street                                  Main Street
                                                             1%                                        99%
                                                          Bonds                                    Commodities
                                                          Growth                                      Value
                                                       Large-cap                                    Small-cap
                                                            USA                                       Japan
                                                       Consumer                                       Banks
                                                      Technology                                     Materials
                                                         Passive                                      Active

Source: BOFA March 2021

Allan Gray Proprietary Limited is an authorised financial services provider. © Allan Gray 2021                       8
Decarbonisation implications
Potential demand scenario for metals
450
Annual consumption indexed to 100
400 507kt
9.2mt
350
300
250
60.1mt 28.8mt
200
150
29.6mt 2.5mt 129kt 13.9mt
100
50
-
Copper Nickel Cobalt Zinc
2019 2050F
Source: Glencore Investor update December 2020
Allan Gray Proprietary Limited is an authorised financial services provider. © Allan Gray 2021 9ALSI in real terms
64 000 10 years
32 000
9 years
18 years
Index level
16 000
8 000
4 000
2 000
1972
1994
2016
1960
1962
1964
1966
1968
1970
1974
1976
1978
1980
1982
1984
1986
1988
1990
1992
1996
1998
2000
2002
2004
2006
2008
2010
2012
2014
2018
2020
Source: Allan Gray research, IRESS, data to 30.04.2021 (SK060521m)
Allan Gray Proprietary Limited is an authorised financial services provider. © Allan Gray 2021 10Lessons from history – what happened next?
19x
1 600 12x
10x
Total Return Index (US$, rebased
800
5x ?
400
3x
to 100)
200
100
50
Jan 70 Jan 75 Jan 80 Jan 85 Jan 90 Jan 95 Jan 00 Jan 05 Jan 10 Jan 15 Jan 20
Gold TOPIX Nasdaq MSCI World Materials Nasdaq
Gold TOPIX NASDAQ MSCI World Materials
(30/09/80 – 28/02/85) (29/12/89 – 30/09/98) (29/02/02 – 30/09/02) (30/06/08 – 27/02/09)
Subsequent peak-
to-trough decline
-57% -59% -75% -60%
Source: 31 Mar 2021 | Source: Refinitiv, Bloomberg. Uses monthly data. Gold: Gold Bullion LBM (USD per troy ounce). For each series data is shown for a decade prior to the peak and for a
decade after the peak.
Allan Gray Proprietary Limited is an authorised financial services provider. © Allan Gray 2021 11FANGAM* vs S&P market cap
Market capitalisation of FANGAM stocks as a percentage of the S&P 500
28%
26%
24%
22%
20%
18%
16%
14%
Sep 18 Dec 18 Mar 19 Jun 19 Sep 19 Dec 19 Mar 20 Jun 20 Sep 20 Dec 20 Mar 21
Source: 31 Mar 2021 | Source: Bloomberg. *FANGAM is an acronym for Facebook, Apple, Netflix, Google (Alphabet), Amazon and Microsoft.
Allan Gray Proprietary Limited is an authorised financial services provider. © Allan Gray 2021 12US vs everywhere else: performance
The typical global stock has only just emerged from a bear market
that started in Jan 2018
50%
Biggest US stocks
40%
30%
Equal-weighted global
20% stocks
10%
0%
(10%)
(20%)
(30%)
(40%)
(50%)
Jan 18 Apr 18 Jul 18 Oct 18 Jan 19 Apr 19 Jul 19 Oct 19 Jan 20 Apr 20 Jul 20 Oct 20 Jan 21
Source: 31 Mar 2021 | Source: Bloomberg, Orbis. The Biggest US stocks series is the S&P 500 Top 50 Index, and the equal-weighted global stocks series is the MSCI ACWI Equal
Weighted Index. USD price returns from 26 Jan 2018.
Allan Gray Proprietary Limited is an authorised financial services provider. © Allan Gray 2021 13Summary
▪ Asset allocation flexibility is a strength
▪ As always, there are reasons for caution in current markets
▪ But overall outlook for returns looks promising
Source: Allan Gray research
Allan Gray Proprietary Limited is an authorised financial services provider. © Allan Gray 2021 14Thank You Allan Gray Proprietary Limited is an authorised financial services provider. © Allan Gray 2021 15
Appendices

Allan Gray Proprietary Limited is an authorised financial services provider. © Allan Gray 2021   16
Important information
                Copyright
                © 2021 Allan Gray Proprietary Limited.
                All rights reserved. The content and information may not be reproduced or distributed without the prior written consent of Allan Gray Proprietary Limited (Allan Gray).

                Information and content
                The information and content of this publication/presentation is provided by Allan Gray as general information about the company and its products and services. Allan Gray does
                not guarantee the suitability or potential value of any information or particular investment source. The information provided is not intended to nor does it constitute financial, tax,
                legal, investment, or other advice. Before making any decision or taking any action regarding your finances, you should consult a qualified financial adviser. Nothing contained
                in this publication/presentation constitutes a solicitation, recommendation, endorsement or offer by Allan Gray, but is merely an invitation to do business.

                Allan Gray has taken and will continue to take care that all information provided, in so far as this is under its control, is true and correct. However, Allan Gray shall not be
                responsible for and therefore disclaims any liability for any loss, liability, damage (whether direct or consequential) or expense of any nature whatsoever, which may be suffered
                as a result of or which may be attributable, directly or indirectly, to the use of or reliance upon any information provided.

                Allan Gray Unit Trust Management (RF) Proprietary Limited (the ‘Management Company’) is registered as a management company under the Collective Investment Schemes
                Control Act 45 of 2002, in terms of which it operates unit trust portfolios under the Allan Gray Unit Trust Scheme, and is supervised by the Financial Sector Conduct Authority
                (‘FSCA’). Allan Gray Proprietary Limited (the ‘Investment Manager’), an authorised financial services provider, is the appointed investment manager of the Management
                Company and is a member of the Association for Savings & Investment South Africa (ASISA). Collective Investment Schemes in Securities (unit trusts or funds) are generally
                medium- to long-term investments. Except for the Allan Gray Money Market Fund, where the Investment Manager aims to maintain a constant unit price, the value of units may
                go down as well as up. Past performance is not necessarily a guide to future performance. The Management Company does not provide any guarantee regarding the capital or
                the performance of its unit trusts. Funds may be closed to new investments at any time in order for them to be managed according to their mandates. Unit trusts are traded at
                ruling prices and can engage in borrowing and scrip lending. A schedule of fees, charges and maximum commissions is available on request from the Management Company.

                Performance
                Performance figures are for lump sum investments with income distributions reinvested. Actual investor performance may differ as a result of the investment date, the date of
                reinvestment and dividend withholding tax. Movements in exchange rates may also be the cause of the value of underlying international investments going up or down.
                Different classes of units apply to the Equity, Balanced, Stable and Optimal funds only and are subject to different fees and charges. Unit trust prices are calculated on a net
                asset value basis, which is the total market value of all assets in the Fund including any income accruals and less any permissible deductions from the Fund, divided by the
                number of units in issue. Forward pricing is used and fund valuations take place at approximately 16:00 each business day. Purchase and redemption requests must be
                received by 14:00 each business day to receive that day’s price. Unit trust prices are available daily on www.allangray.co.za. Permissible deductions may include management
                fees, brokerage, Securities Transfer Tax (STT), auditor’s fees, bank charges and trustee fees. A schedule of fees, charges and maximum commissions is available on request
                from the Management Company.

Allan Gray Proprietary Limited is an authorised financial services provider. © Allan Gray 2021                                                                                                            17
Important information
Benchmarks
FTSE/JSE All Share Index and FTSE/JSE All Bond Index
The FTSE/JSE All Share Index and FTSE/JSE All Bond Index (the FTSE/JSE Indices) are calculated by FTSE International Limited (‘FTSE’) in conjunction with the JSE Limited
(‘JSE’) in accordance with standard criteria. The FTSE/JSE Indices are the proprietary information of FTSE and the JSE. All copyright subsisting in the FTSE/JSE Indices’
values and constituent lists vests in FTSE and the JSE jointly. All their rights are reserved.
FTSE Russell Indices
London Stock Exchange Group plc and its group undertakings (collectively, the “LSE Group”). © LSE Group 2021. FTSE Russell is a trading name of certain of the LSE Group
companies. “FTSE®” “Russell®”, “FTSE Russell®”, is/are a trade mark(s) of the relevant LSE Group companies and is/are used by any other LSE Group company under license.
All rights in the FTSE Russell indexes or data vest in the relevant LSE Group company which owns the index or the data. Neither LSE Group nor its licensors accept any
liability for any errors or omissions in the indexes or data and no party may rely on any indexes or data contained in this communication. No further distribution of data from the
LSE Group is permitted without the relevant LSE Group company’s express written consent. The LSE Group does not promote, sponsor or endorse the content of
this communication.
J.P. Morgan Indices
Information has been obtained from sources believed to be reliable but J.P. Morgan does not warrant its completeness or accuracy. The Index is used with permission. The
Index may not be copied, used, or distributed without J.P. Morgan’s prior written approval. Copyright 2021, J.P. Morgan Chase & Co. All rights reserved.
MSCI Index
Source: MSCI. MSCI makes no express or implied warranties or representations and shall have no liability whatsoever with respect to any MSCI data contained herein. The
MSCI data may not be further redistributed or used as a basis for other indexes or any securities or financial products. This report is not approved, endorsed, reviewed or
produced by MSCI. None of the MSCI data is intended to constitute investment advice or a recommendation to make (or refrain from making) any kind of investment decision
and may not be relied on as such.
Allan Gray Proprietary Limited is an authorised financial services provider. © Allan Gray 2021 18Important information
Understanding the funds
Investors must make sure that they understand the nature of their choice of funds and that their investment objectives are aligned with those of the Fund/s they select.
The Allan Gray Equity, Balanced, Stable and rand-denominated offshore funds may invest in foreign funds managed by Orbis Investment Management Limited, our offshore
investment partner.
A feeder fund is a unit trust that invests in another single unit trust which charges its own fees. A fund of funds is a unit trust that invests in other unit trusts, which charge their
own fees. Allan Gray does not charge any additional fees in its feeder fund or funds of funds.
The Allan Gray Money Market Fund is not a bank deposit account. The Fund aims to maintain a constant price of 100 cents per unit. The total return an investor receives is
made up of interest received and any gain or loss made on instruments held by the Fund. While capital losses are unlikely, they can occur if, for example, one of the issuers of
an instrument defaults. In this event investors may lose some of their capital. To maintain a constant price of 100 cents per unit, investors’ unit holdings will be reduced to the
extent of such losses. The yield is calculated according to the applicable ASISA Standards. Excessive withdrawals from the Fund may place it under liquidity pressure; if this
happens withdrawals may be ring-fenced and managed over a period of time.
Total expense ratio (TER) and transaction costs
The total expense ratio (TER) is the annualised percentage of the Fund’s average assets under management that has been used to pay the Fund’s actual expenses over the
past one- and three-year periods. The TER includes the annual management fees that have been charged (both the fee at benchmark and any performance component
charged), VAT and other expenses like audit and trustee fees. Transaction costs (including brokerage, Securities Transfer Tax [STT], STRATE and FSCA Investor Protection
Levy and VAT thereon) are shown separately. Transaction costs are a necessary cost in administering the Fund and impact Fund returns. They should not be considered in
isolation as returns may be impacted by many other factors over time including market returns, the type of financial product, the investment decisions of the investment
manager and the TER. Since Fund returns are quoted after the deduction of these expenses, the TER and transaction costs should not be deducted again from published
returns. As unit trust expenses vary, the current TER cannot be used as an indication of future TERs. A higher TER does not necessarily imply a poor return, nor does a low
TER imply a good return. Instead, when investing, the investment objective of the Fund should be aligned with the investor’s objective and compared against the performance
of the Fund. The TER and other funds’ TERs should then be used to evaluate whether the Fund performance offers value for money. The sum of the TER and transaction
costs is shown as the total investment charge.
Additional information for retirement fund members and investors in the tax-free investment account, living annuity and endowment
The Allan Gray Retirement Annuity Fund, the Allan Gray Pension Preservation Fund and the Allan Gray Provident Preservation Fund and the Allan Gray Umbrella Retirement
Fund (comprising of the Allan Gray Umbrella Pension Fund and the Allan Gray Umbrella Provident Fund) are all administered by Allan Gray Investment Services Proprietary
Limited, an authorised administrative financial services provider and approved under section 13B of the Pension Funds Act as a benefits administrator. The Allan Gray Tax-
Free Investment Account, Allan Gray Living Annuity and the Allan Gray Endowment are underwritten by Allan Gray Life Limited, also an authorised financial services provider
and a registered insurer licensed to provide life insurance products as defined in the Insurance Act 18 of 2017. The underlying investment options of the Allan Gray individual
products are portfolios of Collective Investment Schemes in Securities (unit trusts or funds).
Allan Gray Proprietary Limited is an authorised financial services provider. © Allan Gray 2021 19You can also read