Set Sail into the Asian Century - March 2021 Jonathan Wu - Executive Director | Chief Investment Specialist - Heathcote Investment Partners

Page created by Ted Reese
 
CONTINUE READING
Set Sail into the Asian Century - March 2021 Jonathan Wu - Executive Director | Chief Investment Specialist - Heathcote Investment Partners
Set Sail into the Asian Century
March 2021
Jonathan Wu – Executive Director | Chief Investment Specialist

                                         1
Set Sail into the Asian Century - March 2021 Jonathan Wu - Executive Director | Chief Investment Specialist - Heathcote Investment Partners
What does the world looks like from our perspective?
           RISKS                      OPPORTUNITIES

       US – Sino Trade                Easy Monetary
          Relations                     Conditions

        Developed                      Greater China
       Market Equity                   Bond Market
        Valuations                      Valuations
        Developed                      Finding ways to
       Market Bond                   invest directly into
        Valuations                     China A Shares
                                       China – First in
          K Shape                      First Out leads
          Recovery                   economic recovery

                         2
Set Sail into the Asian Century - March 2021 Jonathan Wu - Executive Director | Chief Investment Specialist - Heathcote Investment Partners
Introduction
                            Value Partners is one of Asia’s most established asset managers
                                                                                                Independent asset manager
                            with assets under management of US$14.8 billion1 across
                            equities, fixed income, alternatives, multi-asset portfolios and    Value Partners is listed on the Hong Kong
                            quantitative investment solutions                                   Stock Exchange since 22 November 2007.
                                                                                                (Stock code: 806 HK)
                            Temple for Value Investing, where the “ideals of value investing
                            are implemented and transmitted to future generations.”             Shareholding structure2:
                                                                                                • 43.7% - Management and co-founders
                                                                                                • 56.3% - Public shareholders
                            We provide an award-winning menu of funds. For example,
                            our flagship Value Partners Greater China Equity Strategy
                            offers 28 years of outstanding returns                              Investment management is our core
                                                                                                business and our compensation structure is
                            Fundamental investment approach with ~70 investment                 closely aligned to fund performance
                            professionals focusing on Greater China and Asia ex-Japan
                            investments conducting frequent due diligence meetings per
                            annum

                            240+ coveted performance awards and prizes won since
                            establishment

                            Headquartered in Hong Kong, with offices in Shanghai, Shenzhen,
                            Kuala Lumpur, Singapore, London, and representative offices in
                            Beijing, providing localized research and client servicing

                            Dedicated client services and committed to resolving clients’
                            queries in an effective and timely manner
Source: Value Partners
1. Data as at 31 January 2021 (unaudited). 2. Data as at 31 January 2021 (Value Partners)

                                                                                            3
Set Sail into the Asian Century - March 2021 Jonathan Wu - Executive Director | Chief Investment Specialist - Heathcote Investment Partners
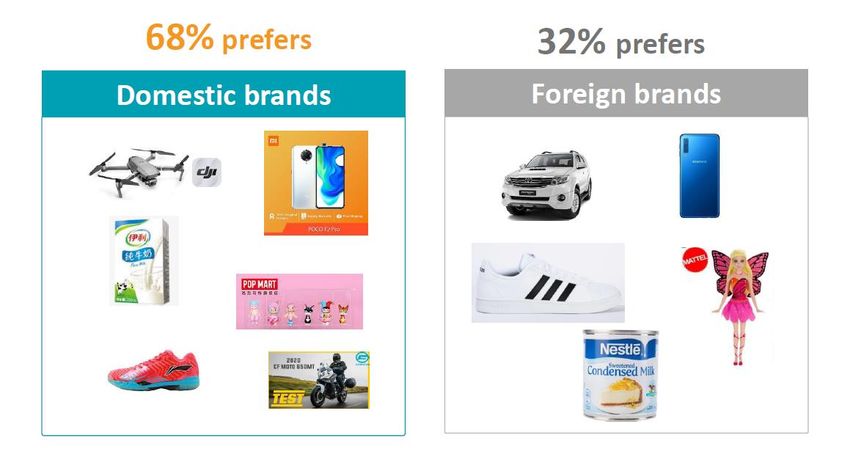
Investment Philosophy
                                          Value          o Invest in companies with quality fundamentals
                                                           trading below their intrinsic value
                                                         o Prefer contrarian and non-consensus ideas

    Hunt for the 3Rs                                            6500+ company visits

                                     Bottom-up Picking

o   the Right business, run by                                  o   On-the-ground, in-depth 360
    the Right people, and at                                        degree review of companies
    the Right price                                             o   Dedication and insight to the
                                                                    local market through
                                                                    extensive relationships
                                 o    High conviction ideas
                                      driven by our “walk the   o   Thorough audit and due
                                      extra mile” bottom-up         diligence checks
                                      fundamental analysis

                                               4
Set Sail into the Asian Century - March 2021 Jonathan Wu - Executive Director | Chief Investment Specialist - Heathcote Investment Partners
Premium Asia Fund Fee Reduction & Performance
     Fee reduction from 1st July 2019 - Competitive fees:
     •        Performance fee removed
     •        Management fee reduced to 1.33% p.a.
     •        PDS in market from 1st July 2019

                                                                                              Cumulative Returns
  300%
                             Premium Asia Fund
  260%
                             Platinum Asia Fund
  220%
                             MSCI Asia Ex-Japan

  180%

  140%

  100%

   60%

   20%

   -20%
                    Jun-10

                                       Jun-11

                                                         Jun-12

                                                                           Jun-13

                                                                                             Jun-14

                                                                                                               Jun-15

                                                                                                                                 Jun-16

                                                                                                                                                   Jun-17

                                                                                                                                                                     Jun-18

                                                                                                                                                                                       Jun-19

                                                                                                                                                                                                         Jun-20
          Dec-09

                              Dec-10

                                                Dec-11

                                                                  Dec-12

                                                                                    Dec-13

                                                                                                      Dec-14

                                                                                                                        Dec-15

                                                                                                                                          Dec-16

                                                                                                                                                            Dec-17

                                                                                                                                                                              Dec-18

                                                                                                                                                                                                Dec-19

                                                                                                                                                                                                                  Dec-20
Data as at 31 January 2021
Source: Lonsec iRate
Inception Date: 1 December 2009. Past performance is not indicative of future results.
*Refers to inception of Premium Asia Fund starting first full month, which is 31 December 2009.

                                                                                                      5
Set Sail into the Asian Century - March 2021 Jonathan Wu - Executive Director | Chief Investment Specialist - Heathcote Investment Partners
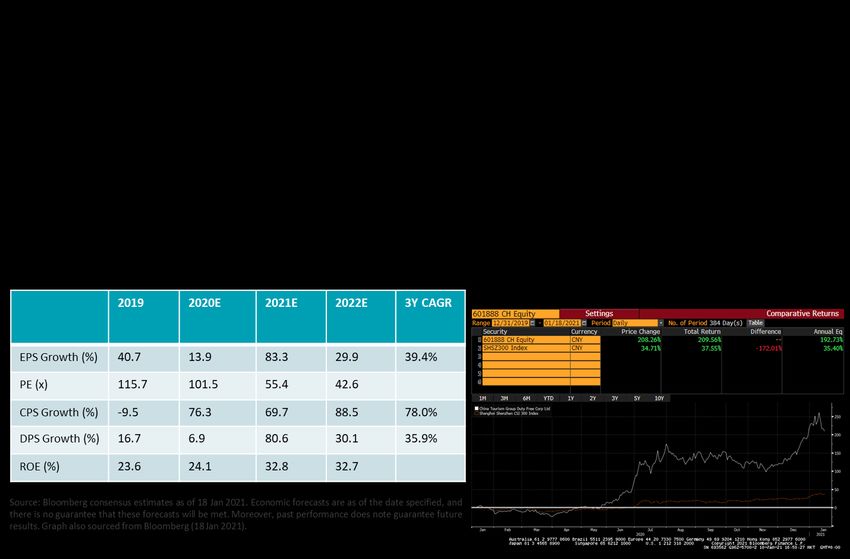
Premium Asia Fund upgraded

  “Zenith has high regard for Value                                                                  “Lonsec continues to hold a positive                                                                 SQM Research met with key portfolio
  Partners' experienced investment                                                                   view on the Manager’s long heritage                                                                  managers and management in
  team and approach. In addition, we                                                                 as a Chinese equity specialist, and the                                                              October 2020 to refresh and update
  believe that the recent change to                                                                  good corporate access it enjoys.                                                                     our understanding of the investment
  the Fund's fee structure improves                                                                  Portfolio Manager Renee Hung is                                                                      process, research priorities,
  the overall attractiveness of the                                                                  considered to be an experienced                                                                      infrastructure enhancements and
  strategy.”                                                                                         Asian equity investor, who has                                                                       portfolio construction. Over the six
                                                                                                     established a pleasing track record in                                                               months prior to this update the Fund
                                                                                                     managing the Fund over an extended                                                                   has performed very strongly relative
                                                                                                     period. Additionally, Lonsec has                                                                     to benchmark and peers in the highly
                                                                                                     gained a greater appreciation for the                                                                challenging market environment
                                                                                                     investment process which                                                                             dominated by the global COVID
                                                                                                     encourages idea sharing and                                                                          pandemic.
                                                                                                     accountability.”
Disclaimers:
Lonsec: Under the Lonsec Research Review and Rating Agreement and these Publication Guidelines, the Lonsec Fund Reviews, Ratings, Rating Logos and other Research Reports are for financial services professionals only and are not suitable for retail investors or the general public.
For any inadvertent or deliberate third party disclosure of the Lonsec Ratings on social media, please note that, as the Client, you will be legally responsible for claims or actions arising from the publication on social media, in accordance with the provisions in your Review and Rating
Agreement with Lonsec Research.
Zenith: Zenith Investment Partners (“Zenith”) provides the following guidelines on Zenith’s processes and procedures relating to research services, research methodologies and conflict of interest management. This information also addresses Zenith’s obligations relating to regulatory
guidance as specified by the Australian Securities & Investments Commission (ASIC). In particular, this document deals with Zenith’s obligations as defined by Regulatory Guide 79 and other regulatory guidelines and the Corporations Act.
SQM: The rating contained in this document is issued by SQM Research Pty Ltd ABN 93 122 592 036 AFSL 421913. SQM Research is an investment research firm that undertakes research on investment products exclusively for its wholesale clients, utilising a proprietary review and star rating
     system. The SQM Research star rating system is of a general nature and does not take into account the particular circumstances or needs of any specific person. The rating may be subject to change at any time. Only licensed financial advisers may use the SQM Research star rating
     system in determining whether an investment is appropriate to a person’s particular circumstances or needs. You should read the product disclosure statement and consult a licensed financial adviser before making an investment decision in relation to this investment product. SQM
     Research receives a fee from the Fund Manager for the research and rating of the managed investment scheme.

                                                                                                                                     6
Set Sail into the Asian Century - March 2021 Jonathan Wu - Executive Director | Chief Investment Specialist - Heathcote Investment Partners
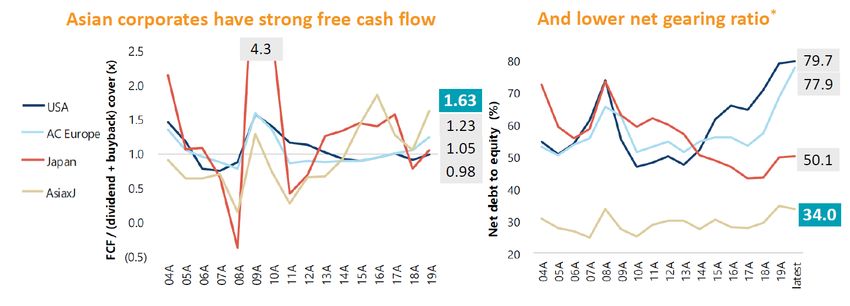
Recap of 2020 Investment Themes

Source: Value Partners

                                      7
Set Sail into the Asian Century - March 2021 Jonathan Wu - Executive Director | Chief Investment Specialist - Heathcote Investment Partners
Asia Corporates Supported by Healthier Balance Sheets

Source: Based on current MSCI universe. Dividend increase refers to an increase of 5% or more.
Bottom-up aggregated with free float adjustment based on current MSCI universe. Jefferies, FactsetDecember 2020

                                                                     8
Transformation of China

    SUPPLY CHAIN TO THE WORLD              DEMAND CHAIN TO THE WORLD
       (External Dependency)                  (Internal Dependency)

• Labour intensive manufacturing         • High Tech Precision
• Exporting Deflation to the World         Manufacturing
• Price Taker                            • Transitioned its economy for a
• Wages below standard, still              Post Globalisation World
  people in poverty.                     • Price Maker
• Lack of Domestic Market                • Strong Domestic Market
                                         • Innovation, R&D, distribution,
                                           brand development all internal.

                                     9
Example – Online Groceries to drive E-Commerce Boom

                       10
Channel Checks Proving Online Platforms have the Cost Advantage

Source: Value Partners forecast

                                  11
Who do Millennials’ Trust though?

             12
China Tourism Group Duty Free Corp (601888 CH)
Leveraging favorable policies to unleash market potential

                                                  13
Asian Equities:
The Value Play in a world full of
liquidity
Premium Asia Fund
    Performance metrics
                                                        1 YR                      3 YR                    5 YR                    7 YR                    10 YR
                                                                  PEER                PEER                    PEER                    PEER                     PEER
                                               FUND              MEDIAN   FUND       MEDIAN       FUND       MEDIAN       FUND       MEDIAN       FUND        MEDIAN

   PERFORMANCE (% PA)                           29.94             19.91   12.69          8.92     16.77          11.68    13.96          10.69    13.22           9.78

   STANDARD DEVIATION (% PA)                    13.84             15.67   13.72          12.89    11.83          11.49    12.93          11.94    13.23        12.03

   EXCESS RETURN (% PA)                         11.12             1.09    3.78           0.01     2.32           -2.77    1.73           -1.54    3.35            -0.09

   OUTPERFORMANCE RATIO (% PA)                  83.33             78.33   66.67          68.06    66.67          67.83    66.67          66.93    65.00        64.44

   WORST DRAWDOWN (%)                           -7.62             -9.52   -8.66          -10.95   -8.66          -10.95   -8.66          -11.50   -9.42       -11.50

   TIME TO RECOVERY (MTHS)                      4.00              4.30    6.00            NR      6.00            NR      15.00           NR      15.00            NR

   SHARPE RATIO                                 3.07              2.47    0.68           0.49     1.46           1.12     0.87           0.70     0.75            0.55

   INFORMATION RATIO                            2.22              0.49    0.62           0.21     0.45           -0.28    0.29           -0.12    0.50            0.06

   TRACKING ERROR (% PA)                        5.01              8.88    6.10           7.14     5.16           6.63     5.99           6.68     6.75            6.60

    FUND: PREMIUM ASIA FUND
    PEER GROUP: ASIA EMERGING MARKETS
    BENCHMARK USED: MSCI AC ASIA EX JAPAN NR INDEX AUD
    CASH BENCHMARK: BLOOMBERG AUSBOND BANK BILL INDEX AUD
    TIME TO RECOVERY: NR - NOT RECOVERED, DASH - NO DRAWDOWN DURING PERIOD

Source: Morningstar, Link fund Solutions as at 31 January 2021

                                                                                          15
Premium Asia Fund – Investing in Trends

                             Sector Exposure*^                                                                                Geographical Exposure*
                                            Insurance                                                                                                   Indonesia
                                               3%               Cash        Real Estate                                                           India    2%
                       Health Care                                                                                                                                Singapore
                                                                 3%            3%                                                                  1%
                           2%                                                                                                          Thailand                      2%
                                                                                                                                         1%                                   Cash
                                                                                Materials                                                                                      3%
                                                                                                                                  Philippines
                                                                                  3%                                                                                        Red Chips
                                                                                                                                     0.5%
      Information Technology                                                                                                                                                   4%
                                                                                          Other Financials              Hong Kong
               28%
                                                                                                5%                        29%                                              United States
                                                                                                                                                                                4%

                                                                                                 Industrials
                                                                                                    5%                                                                         H Shares
                                                                                                                                                                                  6%
                                                                                    Banks
                                                                                     5%
                                                                                                                                                                              Taiwan
                                                                                                                                                                               15%

                                                                                                                              A Shares
             Consumer                                                                                                           17%
                                                                               Consumer Staples
            Discretionary                                                                                                                                    South Korea
                                                       Communication                12%
                19%                                                                                                                                             16%
                                                          Services
                                                            12%

Source: Link Fund Solutions, Bloomberg. Data as at 31 January 2021.
^ Classification is based on Global Industry Classification Standard (GICS).
* Exposure refers to net exposure (long exposure minus short exposure) by listing. Due to rounding, percentages shown may not add up to 100%.

                                                                                                 16
Premium Asia Fund
  Portfolio Characteristics
   Top 10 Holdings                                                   Industry^                                         Listing                        %
   Tencent Holdings Ltd                                              Media & Entertainment                             Hong Kong                     8.5%
   Samsung Electronics Co Ltd                                        Technology Hardware & Equipment                   South Korea                   7.2%
   Taiwan Semiconductor Manufacturing Co Ltd Semiconductors & Semiconductor Equipment                                  Taiwan                        6.3%
   China Tourism Group Duty Free                                     Retailing                                         China A-shares                4.6%
   Kweichow Moutai Co Ltd                                            Food, Beverage & Tobacco                          China A-shares                3.9%
   China Merchants Bank Co Ltd                                       Banks                                             H-shares                      2.9%
   Wuliangye Yibin Co Ltd                                            Food, Beverage & Tobacco                          Hong Kong                     2.7%
   Korea Investment Holdings                                         Diversified Financials                            South Korea                   2.2%
   Meituan Dianping                                                  Retailing                                         Hong Kong                     2.1%
   Pinduoduo Inc                                                     Retailing                                         United States                 2.1%

   Basic elements                                                                    Top Contributors by Holdings
                                                                                     (data as 31st January 2021)    Average Weighting        Contribution
   P/E (x)                                                               16.26       Taiwan Semiconductor
                                                                                                                                     6.31%          4.67%
                                                                                     Manufacturing Co., Ltd.
   P/B (x)                                                                    2.15
                                                                                     Wuliangye Yibin Co., Ltd.                       2.84%          3.42%
   Dividend Yield (%)                                                         2.26
                                                                                     Meituan Dianping                                2.15%          3.36%
   No. of holdings                                                             83
                                                                                     Samsung Electronics Co Ltd                      6.33%          3.32%
Data as at 31 January 2021
Source: Link Fund Solutions Pty Ltd, Bloomberg
^Classification is based on Global Industry Classification Standard (GICS).          Tencent Holdings Ltd.                           6.64%          3.30%

                                                                                              17
Low to negative yields – the new normal
 • Where can we generate return in a negative yielding environment?
                 o Increasing share of low and negative yielding products in the world market
                 o Global interest rates and bond yields will stay lower and longer post Covid-19
100%

 80%

 60%

 40%

 20%

  0%
       1996
              1997
                     1997
                            1998
                                   1998
                                          1999
                                                 1999
                                                        2000
                                                               2000
                                                                      2001
                                                                             2001
                                                                                    2002
                                                                                           2002
                                                                                                  2003
                                                                                                         2003
                                                                                                                2004
                                                                                                                       2004
                                                                                                                              2005
                                                                                                                                     2005
                                                                                                                                            2006
                                                                                                                                                   2006
                                                                                                                                                          2007
                                                                                                                                                                 2007
                                                                                                                                                                        2008
                                                                                                                                                                               2008
                                                                                                                                                                                      2009
                                                                                                                                                                                             2009
                                                                                                                                                                                                    2010
                                                                                                                                                                                                           2010
                                                                                                                                                                                                                  2011
                                                                                                                                                                                                                         2011
                                                                                                                                                                                                                                2012
                                                                                                                                                                                                                                       2012
                                                                                                                                                                                                                                              2013
                                                                                                                                                                                                                                                     2013
                                                                                                                                                                                                                                                            2014
                                                                                                                                                                                                                                                                   2014
                                                                                                                                                                                                                                                                          2015
                                                                                                                                                                                                                                                                                 2015
                                                                                                                                                                                                                                                                                        2016
                                                                                                                                                                                                                                                                                               2016
                                                                                                                                                                                                                                                                                                      2017
                                                                                                                                                                                                                                                                                                             2017
                                                                                                                                                                                                                                                                                                                    2018
                                                                                                                                                                                                                                                                                                                           2018
                                                                                                                                                                                                                                                                                                                                  2019
                                                                                                                                                                                                                                                                                                                                         2019
                                                                                                                                                                                                                                                                                                                                                2020
                                                                                                           Sub-zero             0-1%               1-2%          2-3%          3-4%            4-5%           5-10%             >10%
Data to 26 June 2020
Source: Bloomberg, ICE BofAML indices

                                                                                                                                                            18
Premium Asia Income Fund Update
                          Premium Asia Income Fund                                        Cumulative Return (since launch - net of fees)
                             Performance Update                    150%

         As at 31 January 2021 – net of all fees                   110%

         One month                                      1.00%
                                                                       70%

         Three months                                   5.13%
                                                                       30%
         Six months                                     7.02%

         One year                                       7.94%      -10%

                                                                             Aug-11
                                                                                      Feb-12
                                                                                               Aug-12
                                                                                                        Feb-13
                                                                                                                 Aug-13
                                                                                                                          Feb-14
                                                                                                                                   Aug-14
                                                                                                                                            Feb-15
                                                                                                                                                     Aug-15
                                                                                                                                                              Feb-16
                                                                                                                                                                       Aug-16
                                                                                                                                                                                Feb-17
                                                                                                                                                                                         Aug-17
                                                                                                                                                                                                  Feb-18
                                                                                                                                                                                                           Aug-18
                                                                                                                                                                                                                    Feb-19
                                                                                                                                                                                                                             Aug-19
                                                                                                                                                                                                                                      Feb-20
                                                                                                                                                                                                                                               Aug-20
         Since launch*                                 +142.88%
                                                                                          Portfolio characteristics as at 31 January 2021
                                                                                                        Cash yield                                                                                            7.32%
           Annualised return                            +9.88%                           Yield to maturity / put                                                                                              8.06%
                                                                                       Time to maturity, years                                                                                                2.925
                                                                                      Modified duration, years                                                                                                  2.19
           Annualised volatility                        5.63%
                                                                                      Number of bond positions                                                                                                      63
Source: Link Fund Solutions; Bloomberg
*Launch Date: 31 August 2011
Past performance is not indicative of future results

                                                                  19
Consistent Outperformance with Superior Downside Protection

Source: Morningstar Direct

                                     20
Contact Us

Jonathan Wu
Executive Director | Head of Distribution & Operations
Chief Investment Specialist
Premium China Funds Management
Mobile: 0416 031 676
Phone: (02) 9211 3888
Email: jonathan.wu@premiumchinafunds.com.au

              Premium China Funds Management Pty Ltd
           Suite 39, Level 2, 330 Wattle Street, Ultimo NSW 2007
               Tel: (02) 9211 3888     Fax: (02) 9211 0220
                  Email: info@premiumchinafunds.com.au
                  https://www.premiumchinafunds.com.au
You can also read