PLATINUM QUARTERLY PRESENTATION Q4 2018 - London 06 March 2019 - World ...
←
→
Page content transcription
If your browser does not render page correctly, please read the page content below

PLATINUM QUARTERLY PRESENTATION
Q4 2018

London
06 March 2019

COPYRIGHT AND DISCLAIMER

  IMPORTANT NOTICE AND DISCLAIMER: This publication is general and solely for educational purposes. The publisher, The World Platinum Investment Council,
  has been formed by the world’s leading platinum producers to develop the market for platinum investment demand. Its mission is to stimulate investor demand for
  physical platinum through both actionable insights and targeted development: providing investors with the information to support informed decisions regarding
  platinum; working with financial institutions and market participants to develop products and channels that investors need. No part of this publication may be
  reproduced or distributed in any manner without attribution to the authors. Unless otherwise specified in this document all material is © World Platinum Investment
  Council 2018. Material sourced from third parties may be copyright material of such third parties and their rights are reserved. Content within the publication that has
  been provided by SFA, one of our third party providers, is © SFA Copyright reserved. All copyright and other intellectual property rights in such content contained in
  this publication remain the property of SFA, and no person other than SFA shall be entitled to register any intellectual property rights in the information, or data
  herein. The analysis, data and other information attributed to SFA reflect SFA’s judgment as of the date of the document and are subject to change without
  notice. No part of the content provided by SFA shall be used for the specific purpose of accessing capital markets (fundraising) without the written permission of
  SFA.

  This publication is not, and should not be construed to be, an offer to sell or a solicitation of an offer to buy any security. With this publication, neither the publisher
  nor SFA intend to transmit any order for, arrange for, advise on, act as agent in relation to, or otherwise facilitate any transaction involving securities or commodities
  regardless of whether such are otherwise referenced in it. This publication is not intended to provide tax, legal, or investment advice and nothing in it should be
  construed as a recommendation to buy, sell, or hold any investment or security or to engage in any investment strategy or transaction. Neither the publisher nor SFA
  is, or purports to be, a broker-dealer, a registered investment advisor, or otherwise registered under the laws of the United States or the United Kingdom, including
  under the Financial Services and Markets Act 2000 or Senior Managers and Certifications Regime or by the Financial Conduct Authority.

  This publication is not, and should not be construed to be, personalized investment advice directed to or appropriate for any particular investor. Any investment
  should be made only after consulting a professional investment advisor. You are solely responsible for determining whether any investment, investment strategy,
  security or related transaction is appropriate for you based on your investment objectives, financial circumstances and risk tolerance. You should consult your
  business, legal, tax or accounting advisors regarding your specific business, legal or tax situation or circumstances.

  The information on which this publication is based is believed to be reliable. Nevertheless, neither the publisher nor any third party can guarantee the accuracy or
  completeness of the information. This publication contains forward-looking statements, including statements regarding expected continual growth of the industry. The
  publisher notes that statements contained in the publication that look forward in time, which include everything other than historical information, involve risks and
  uncertainties that may affect actual results and neither the publisher nor any third party accepts any liability whatsoever for any loss or damage suffered by any
  person in reliance on the information in the publication.

  The logos, services marks and trademarks of the World Platinum Investment Council are owned exclusively by it. All other trademarks used in this publication are the
  property of their respective trademark holders. The publisher is not affiliated, connected, or associated with, and is not sponsored, approved, or originated by, the
  trademark holders unless otherwise stated. No claim is made by the publisher to any rights in any third-party trademarks.

                                                                                                                                                                                 2
AGENDA: PLATINUM QUARTERLY: Q4 2018, REVISED
        2018 AND 2019 FORECAST

1. Introduction
Paul Wilson, CEO

2. Platinum Quarterly, Fundamentals review
Trevor Raymond

3. Focus on fundamental drivers
Trevor Raymond

4. Questions
Paul Wilson
Trevor Raymond

                                               3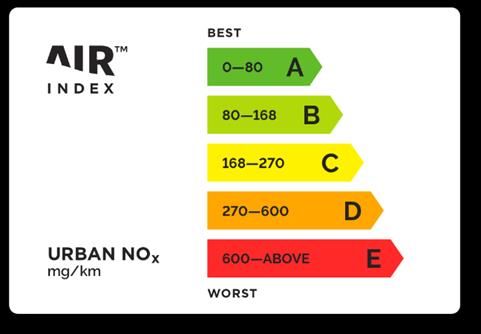
AGENDA: PLATINUM QUARTERLY: Q4 2018, REVISED
        2018 AND 2019 FORECAST

1. Introduction
Paul Wilson

2. Platinum Quarterly, Fundamentals review
 • Q4’18 and 2018
 • 2019f update
 Trevor Raymond, Director of Research

3. Focus on fundamental drivers
Trevor Raymond

4. Questions
Paul Wilson
Trevor Raymond

                                               4
Q4 2018 SUPPLY: BOTH MINING AND RECYCLING
DECLINED IN THE QUARTER
SUPPLY Q4 2017 // Q3 2018 Q4 2018
• South African supply steady - up 1%
Refined Production 1,590 1,680 1,535
South Africa 1,120 1,240 1,130 • Russian supply down 24% due to
Zimbabwe 140 120 120 refinery working inventory build
North America 95 90 100
Russia 190 185 145
Other 45 45 40 • Recycling supply down 3%
Inc(-)/Dec(+) in Producer Inventory +25 -20 -5
Total Mining Supply 1,615 1,660 1,530
• Q4’18 total supply down 5%
Recycling 505 485 490
Autocatalyst 365 365 380
Jewellery 140 120 110
Industrial 0 0 0
Total Supply 2,120 2,145 2,020
Source: WPIC Platinum Quarterly Q4 2018, SFA (Oxford) 5MINING SUPPLY: SOUTH AFRICAN SUPPLY – Q4 STEADY
South African quarterly production (koz)
1,400 • South African supply steady in Q4’18
1,200 • Sustained elevated operating tempo –
1,000
limited industrial action, fewer section
54 stoppages, higher efficiencies
800
• Industrial action risk up on
600
developments at gold mines
400
200
0
Q4'14 Q4'15 Q4'16 Q4'17 Q4'18
Refined production Q4 production
Source: WPIC Platinum Quarterly Q4 2018, SFA (Oxford) 6RECYCLING: Q4 RECYCLING DOWN – AUTOCATALYST
UP; JEWELLERY DOWN
Recycling (koz)
600 • Q4’18 recycling down 3% on Q4’17 -
Q2 to Q4 autocat growth
500
• Healthy steel prices supporting end-of-
400 life vehicle flow to collectors
300 • Palladium and rhodium prices
increasing gasoline and all catalyst
200 recycling
100 • Jewellery recycling down 21% on low
price and soft sales in China
0
Q4'14 Q4'15 Q4'16 Q4'17 Q4'18
Autocatalyst Jewellery
Source: WPIC Platinum Quarterly Q4 2018, SFA (Oxford) 7Q4 2018 DEMAND: AUTO, JEWELLERY AND
INVESTMENT DOWN – INDUSTRIAL UP
DEMAND Q4 2017 // Q3 2018 Q4 2018
Automotive 845 710 780 • Automotive demand down 8% (65 koz)
Autocatalyst 810 675 740
35 35 40
YoY but decline in diesel sales softens
Non-road
Jewellery 680 575 600 • Jewellery down in China, partly offset by
Industrial 430 475 460 growth India and N. America
Chemical 135 160 135
Petroleum 25 55 55 • Industrial rebound in 2018 sustained in
Electrical 60 50 50
Glass 35 70 40 Q4
Medical & Biomedical 70 45 70
Other 105 95 110
• Bar and coin demand remains solid;
Investment 100 65 -65 ETF demand fell sharply
Change in Bars, Coins 65 70 50
Change in ETF Holdings 55 5 -115
Change in Stocks Held by Exchanges -20 -10 0
Total Demand 2,055 1,825 1,775
Balance 65 320 245
Source: WPIC Platinum Quarterly Q4 2018, SFA (Oxford) 8Q4 2018 DEMAND: AUTOCATALYST DECLINE
CONTINUED BUT SLOWER RATE OF SALES DECLINE
Autocatalyst demand (koz)
1,000 • Autocatalyst (excl. non-road) demand fell
900 9% to 740 koz in Q4’18 from 810 koz in
800
Q4’17
700
• W. Europe diesel share stabilised in Q4
600 ’18 at 35%
500
400 • Automakers’ marketing efforts and
increased evidence of cleaner diesels,
300
appear to have slowed falling sales
200
100
0
Q4'14 Q4'15 Q4'16 Q4'17 Q4'18
Source: WPIC Platinum Quarterly Q4 2018, SFA (Oxford) 9Q4 2018 DEMAND: JEWELLERY REMAINS WEAK IN
CHINA - GROWTH IN OTHER REGIONS
Jewellery demand (koz)
800 • Jewellery demand was 600 koz in
Q4’18, an unusually weak year-end
700
performance
600
• Gains in N. America and India were
500
more than offset by China weakness
400
• Platinum purchases on SGE down -
300
reflecting weakness in China retail
200 jewellery
100
0
Q4'14 Q4'15 Q4'16 Q4'17 Q4'18
Source: WPIC Platinum Quarterly Q4 2018, SFA (Oxford) 10Q4 2018 DEMAND: INDUSTRIAL DEMAND HIGHER ON
NET GROWTH IN PETROLEUM AND GLASS
Industrial demand by category (koz)
500 • Platinum industrial demand was 460
450 koz in Q4’18, up 30 koz (+7%) YoY
400
• Petroleum refining strength continues
350
300 • Glass capacity growth driven by RoW
250 and W. Europe in Q3’18 but weaker in
200 Q4’18
150
100
50
0
Q4'14 Q2'15 Q4'15 Q2'16 Q4'16 Q2'17 Q4'17 Q2'18 Q4'18
Chemical Petroleum Electrical Glass Medical & Biomedical Other
Source: WPIC Platinum Quarterly Q4 2018, SFA (Oxford) 11Q4 2018 DEMAND: INVESTMENT DOWN: ETF DECLINE
PARTLY OFFSET BY SUSTAINED FIRM RETAIL DEMAND
Investment demand by category
400 • Bar & coin demand remained steady,
reflecting weak price, discount to gold
300
Net and increased product offering
200
100 • ETF demand in Q4’18 dropped 115 koz
YoY
koz
0
-100 • Exchange stocks were unchanged
-200
-300
-400
Q4'14 Q2'15 Q4'15 Q2'16 Q4'16 Q2'17 Q4'17 Q2'18 Q4'18
Bar and coin ETFs Exchange stocks
Source: WPIC Platinum Quarterly Q4 2018, SFA (Oxford) 12ANNUAL BALANCES: 2019 SURPLUS UP ON 2018 AS
SUPPLY INCREASES 35 KOZ MORE THAN DEMAND
SUPPLY 2018 2019f YoY, oz YoY, %
Refined Production 6,085 6,460 375 6% • Surplus in 2019 (680 koz) up from 2018
South Africa 4,410 4,725 315 7%
Zimbabwe 470 470 0 0%
(645 koz)
North America 360 410 50 14%
Russia 675 675 0 0%
• Total supply up 5% (410 koz) in 2019
Other 170 180 10 6%
Inc (-)/Dec (+) in Producer Inventory +15 +0 -15 -100%
Total Mining Supply 6,100 6,460 360 6% • S.A. supply up 7% (315 koz) on one-off
Recycling 1,910 1,960 50 3% work in progress release; N. America
Autocatalyst 1,420 1,495 75 5%
Jewellery 485 460 -25 -5%
supply up 12% (50 koz) on a project
Industrial 5 5 0 0% ramp up
Total Supply 8,010 8,420 410 5%
DEMAND • Total demand up 5% (375 koz) on
Automotive 3,100 3,000 -100 -3%
Jewellery 2,355 2,325 -30 -1%
investment growth, partly offset by
Industrial 1,895 1,885 -10 -1% automotive decline
Investment 15 530 515 3433%
Total Demand 7,365 7,740 375 5%
Balance 645 680 35 5%
Above Ground Stocks 2,815 3,495 680 24%
Source: WPIC Platinum Quarterly Q4 2018, SFA (Oxford) 132019 TOTAL DEMAND UP 5% - MINING SUPPLY UP 6%
FROM ONE-OFF RELEASE - TOTAL SUPPLY UP 5%
Total mining supply 2018 to 2019
Total Mine supply
6,600 • Mining supply up 6% - South Africa up
50 0 10 -15 6,460 6,500
315 0
6,400
on work in progress built up in 2018
6,300 and US up on new project
6,200
6,100 6,100
6,000 • Total demand up 5% - investment
5,900
5,800 offsets weak automotive and jewellery
5,700
2018 S. Africa Zim N. Russia Other From 2019f
America stocks
• Industrial is down 1% - at similar level
Total demand 2018 to 2019 to strong demand in 2018
Total demand
7,900
515 7,740
7,800 • Investment strength is led by significant
7,700
7,600
ETF buying in 2019 and expected
7,500 continued steady bar and coin demand
7,365 -100 7,400
-30 7,300
-10
7,200
7,100
7,000
2018 Automotive Jewellery Industrial Investment 2019f
Source: WPIC Platinum Quarterly Q4 2018, SFA (Oxford) 14SOUTH AFRICAN REFINED PRODUCTION UP 7% ON ONE-
OFF WORK IN PROGRESS RELEASE
South Africa Refined Pt Production
• South African refined platinum production
WiP release forecast for 2019 is up 7% due to
5.0
announced one-off releases
Pt mine production
4.5
• Increased working inventory disclosure by
4.0 SA producers due to significant changes
moz
3.5 in PGM prices and major smelter
maintenance & commissioning
3.0
• Without the Work in Progress release of
2.5
platinum to be refined and sold (c. 280
2.0 koz), global platinum supply growth would
2013 2014 2015 2016 2017 2018 2019f be up 2% in 2019
Source: WPIC Platinum Quarterly Q4 2018, SFA (Oxford) 15AGENDA: PLATINUM QUARTERLY: Q4 2018, REVISED
2018 AND 2019 FORECAST
1. Introduction
Paul Wilson
2. Platinum Quarterly, Fundamentals review
Trevor Raymond
3. Focus on fundamental demand drivers
• Diesel stabilisation
• Palladium premium
• Platinum ETFs
Trevor Raymond, Director of Research
4. Questions
Paul Wilson
Trevor Raymond
16THE DECLINE IN DIESEL CAR SALES IN WESTERN
EUROPE HAS RECOVERED
Western European
Western diesel
European share
Diesel Shareof
of auto sales
Auto Sales
55%
• W. Europe diesel share over 50% in
50% 2015, prior to Dieselgate
45% • Recovery from 33.8% in September
2018 to 35.2% in January 2019 (some
40%
WLTP impact)
35%
Some indication of • New models well below Euro 6 NOx
30% recovery in diesel share
level in on-road (RDE) tests - 1 Sept
25% 2017;all new car sales - 1 Sept 2019
20% • City bans being addressed to allay
01/16 05/16 09/16 01/17 05/17 09/17 01/18 05/18 09/18 01/19
consumer fears – access and resale
value
Source: WPIC research, LMC Automotive 17DIESEL SALES STABILISING – AUTOMAKERS ADDRESSING
POOR DIESEL SALES MAY AVOID SEVERE CO2 FINES
AIR Index launched in February 2019 -
Legal framework (CWA*) for improved & fair city policy
• German legislation to address city bans
can be EU-wide; proof of 270mg/km on-
road NOx level from new index
• Independent rating may address
consumer fears & increase diesel sales
• Automakers can now prove ‘clean diesel’
www.AIRIndex.org www.allowAIR.org with independent comparable NOx index
Source: WPIC research, BMVI, AIR *: CEN (European Committee for Standardisation) CWA 17379, General guideline on real drive test methodology for compiling comparable emission data 18PALLADIUM PRICE PREMIUM CONTINUES UNABATED
Platinum and palladium price
• Palladium’s price first rose above
Pd premium since 09/17;
1,600 Currently $687/oz platinum in September 2017, expanding
Platinum sharply in Q3 2018
1,500
Palladium
1,400
• Palladium was $687/oz above platinum
1,300
1,200 on 25 February 2019
USD/oz
1,100
• Palladium in sustained backwardation for
1,000
900
over 15 months – shortage of ingot and
800 sponge?
700
600
01/17 05/17 09/17 01/18 05/18 09/18 01/19
Platinum Palladium
Source: Bloomberg, WPIC research 19PALLADIUM MARKET IN 8TH ANNUAL DEFICIT; SUPPLY
GROWTH UNABLE TO MEET 2019 DEFICIT
Palladium market balance and price
• Palladium deficit is now in 8th year
• Autocatalyst loadings increasing to meet
tighter standards and address
compliance risk concerns
• Substantial supply growth is years away
• Some relief possible from opaque stocks,
yet, market remains in structural deficit
• Substitution seems the likely solution,
though timing is difficult to predict with
low levels of disclosure of proprietary,
confidential loadings
Source: Bloomberg, Johnson Matthey, WPIC research 20PALLADIUM ETF HOLDINGS DEPLETED AS A SOURCE TO
BALANCE MARKET DEFICITS
Palladium ETFs supplied >2 moz since 2015
1,600 3.5 • Palladium ETFs have supplied more than
2 moz since 2015 to help meet market
1,400 3.0
Palladium ETF Holdings, rhs deficits
1,200 Palladium Price
2.5
• Cumulative 2015-2018 palladium deficit
ETF Holdings Moz
1,000
2.0 was 1.2 moz*
USD/oz
800
1.5 • ETF balance approaching zero unlikely
600
and unable to meet 2019 forecast deficit
1.0
400
• Above ground stock opaque – higher
200 0.5
price needed to supply deficits
0 0.0
2015 2016 2017 2018 2019
*Johnson Matthey
Source: Bloomberg, WPIC research 21SIGNIFICANT PLATINUM SUBSTITUTION OF PALLADIUM
HAPPENED BETWEEN 1999 AND 2002
Platinum & palladium autocat demand and price
Platinum substituted for palladium in
gasoline cars in past price peaks.
• Palladium spiked to $1,000/oz in 2000
• Platinum demand grew 61% from 1999,
to 2002, c. 1m oz per annum
• Substitution ratio was 2Pd:1Pt at that
stage due to fuel sulphur level and wash
coat instability
Pt oz Pd oz Pd price
Source: Bloomberg, Johnson Matthey, WPIC research 22IMPACT OF HIGHER DIESEL SHARE AND SOME
PALLADIUM SUBSTITUTION – MATERIAL FOR PLATINUM
Platinum and& palladium
Platinum autocat demand
Palladium Autocatalyst Demand
5% subsitution of Pd by Pt • Diesel share change of 4% is ~100 koz
would increase Pt autocat
9,000 Pt Autocat Demand* demand by 14% per annum (JM estimate and ~decline
8,000 Pd Autocat Demand** 2016 to 2018)
7,000
• A relatively small amount of substitution
6,000 from palladium to platinum (at 1:1 ratio)
'000 oz
5,000 would be meaningful
4,000
• Example using 2018 Pd auto demand:
3,000
5% substitution of Pd would increase Pt
2,000
autocatalyst demand by over 400 koz per
1,000
annum
0
†
2013 2014 2015 2016 2017 2018 2019f
* Platinum data is from SFA Oxford
** Palladium data is from Johnson Matthey
† Johnson Matthey has not published a 2019 palladium autocatalyst demand estimate, for illustrative
purposes, our graph shows 2019 demand as equal to 2018
Source: SFA (Oxford), Johnson Matthey, WPIC research 23PLATINUM ETF HOLDINGS INCREASED MARKEDLY IN
2019, UNDERPINS FORECAST INVESTMENT DEMAND
Platinum ETF holdings and price/oz
• YTD platinum ETF growth of c. 400 koz
1,400 Platinum ETF Holdings, rhs 3.5 informs 2019 investment demand
Platinum Price
1,300 forecast of 530 koz
c. 300 koz AUM increase YTD 3.0
1,200
• Retail coin and bar demand has been
1,100 fairly steady and should add the balance
ETF Holdings Moz
2.5
1,000
USD/oz
900
2.0
800
700 1.5
600
500 1.0
2015 2016 2017 2018 2019
Source: Bloomberg, WPIC research 24GLOBAL PLATINUM AUM RESILIENT -
ETFS STABLE DESPITE PRICE VOLATILITY
Global platinum ETF holdings ex-Africa
• Platinum ETF AUM has historically been
2,000 Platinum ETF Holdings ex-Africa, rhs 2.0 fairly stable
Platinum Price
1,800 1.8
• Platinum AUM stability likely during
1,600 1.6
significant price change. Similar sales to
1,400 1.4
palladium ETFs unlikely without extreme
ETF Holdings Moz
1,200 1.2
price moves
USD/oz
1,000 1.0
800 0.8 • ETF AUM shown ex-South Africa to
600 0.6 highlight global trends
400 0.4
200 0.2
0 0.0
2009 2010 2011 2012 2013 2014 2015 2016 2017 2018 2019
Source: Bloomberg, WPIC research 25AGENDA: PLATINUM QUARTERLY: Q4 2018, REVISED
2018 AND 2019 FORECAST
1. Introduction
Paul Wilson
2. Platinum Quarterly, Fundamentals review
Trevor Raymond
3. Focus on fundamental drivers
Trevor Raymond
4. Questions
Paul Wilson, CEO
Trevor Raymond, Director of Research
26You can also read