PLATINUM QUARTERLY PRESENTATION Q1 2019 - London 13th May 2019 - Forex Factory
←
→
Page content transcription
If your browser does not render page correctly, please read the page content below

PLATINUM QUARTERLY PRESENTATION
Q1 2019

London
13th May 2019
COPYRIGHT AND DISCLAIMER

  IMPORTANT NOTICE AND DISCLAIMER: This publication is general and solely for educational purposes. The publisher, The World Platinum Investment Council,
  has been formed by the world’s leading platinum producers to develop the market for platinum investment demand. Its mission is to stimulate investor demand for
  physical platinum through both actionable insights and targeted development: providing investors with the information to support informed decisions regarding
  platinum; working with financial institutions and market participants to develop products and channels that investors need. No part of this publication may be
  reproduced or distributed in any manner without attribution to the authors. Unless otherwise specified in this document all material is © World Platinum Investment
  Council 2019. Material sourced from third parties may be copyright material of such third parties and their rights are reserved. Content within the publication that has
  been provided by SFA, one of our third party providers, is © SFA Copyright reserved. All copyright and other intellectual property rights in such content contained in
  this publication remain the property of SFA, and no person other than SFA shall be entitled to register any intellectual property rights in the information, or data
  herein. The analysis, data and other information attributed to SFA reflect SFA’s judgment as of the date of the document and are subject to change without
  notice. No part of the content provided by SFA shall be used for the specific purpose of accessing capital markets (fundraising) without the written permission of
  SFA.

  This publication is not, and should not be construed to be, an offer to sell or a solicitation of an offer to buy any security. With this publication, neither the publisher
  nor SFA intend to transmit any order for, arrange for, advise on, act as agent in relation to, or otherwise facilitate any transaction involving securities or commodities
  regardless of whether such are otherwise referenced in it. This publication is not intended to provide tax, legal, or investment advice and nothing in it should be
  construed as a recommendation to buy, sell, or hold any investment or security or to engage in any investment strategy or transaction. Neither the publisher nor SFA
  is, or purports to be, a broker-dealer, a registered investment advisor, or otherwise registered under the laws of the United States or the United Kingdom, including
  under the Financial Services and Markets Act 2000 or Senior Managers and Certifications Regime or by the Financial Conduct Authority.

  This publication is not, and should not be construed to be, personalized investment advice directed to or appropriate for any particular investor. Any investment
  should be made only after consulting a professional investment advisor. You are solely responsible for determining whether any investment, investment strategy,
  security or related transaction is appropriate for you based on your investment objectives, financial circumstances and risk tolerance. You should consult your
  business, legal, tax or accounting advisors regarding your specific business, legal or tax situation or circumstances.

  The information on which this publication is based is believed to be reliable. Nevertheless, neither the publisher nor any third party can guarantee the accuracy or
  completeness of the information. This publication contains forward-looking statements, including statements regarding expected continual growth of the industry. The
  publisher notes that statements contained in the publication that look forward in time, which include everything other than historical information, involve risks and
  uncertainties that may affect actual results and neither the publisher nor any third party accepts any liability whatsoever for any loss or damage suffered by any
  person in reliance on the information in the publication.

  The logos, services marks and trademarks of the World Platinum Investment Council are owned exclusively by it. All other trademarks used in this publication are the
  property of their respective trademark holders. The publisher is not affiliated, connected, or associated with, and is not sponsored, approved, or originated by, the
  trademark holders unless otherwise stated. No claim is made by the publisher to any rights in any third-party trademarks.

                                                                                                                                                                                 2
AGENDA: PLATINUM QUARTERLY
        Q1 2019 AND 2019 FORECAST

1. Introduction
Paul Wilson, CEO

2. Platinum Quarterly, Fundamentals review
Trevor Raymond

3. Focus on fundamental drivers
Trevor Raymond

4. Questions
Paul Wilson
Trevor Raymond

                                             3
AGENDA: PLATINUM QUARTERLY
        Q1 2019 AND 2019 FORECAST

1. Introduction
Paul Wilson

2. Platinum Quarterly, Fundamentals review
 Supply, demand and balance: Q1’19, 2019f
 Trevor Raymond, Director of Research

3. Focus on fundamental drivers
Trevor Raymond

4. Questions
Paul Wilson
Trevor Raymond

                                             4
Q1 2019 SUPPLY: SA MINE SUPPLY UNSEASONALLY
STRONG, AUTOCATALYST RECOVERY FIRM

SUPPLY                                                  Q1 2018 // Q4 2018 Q1 2019   • South African mining supply up 21%
Refined Production                                        1,295     1,560    1,525     YoY in Q1’19 from process lock-up
                          South Africa                      910     1,160    1,105     release
                            Zimbabwe                        115       120      110
                        North America                        90        95      100
                               Russia                       140       145      165
                                                                                     • Russian supply up 25 koz YoY on
                                 Other                       40        40       45     planned rise in 2019 output
   Inc(-)/Dec(+) in Producer Inventory                      -10       -20       +5
Total Mining Supply                                       1,285     1,540    1,530
                                                                                     • Recycling supply up 4% YoY:
Recycling                                                   460       495     480         autocatalyst    +8%
                                       Autocatalyst         330       380     355         jewellery       -4%
                                          Jewellery         130       115     125
                                          Industrial          0         0       0
                                                                                     • Q1’19 total supply up 15% year-on-
Total Supply                                              1,745     2,035    2,010     year

Source: WPIC Platinum Quarterly Q1 2019, SFA (Oxford)                                                                       5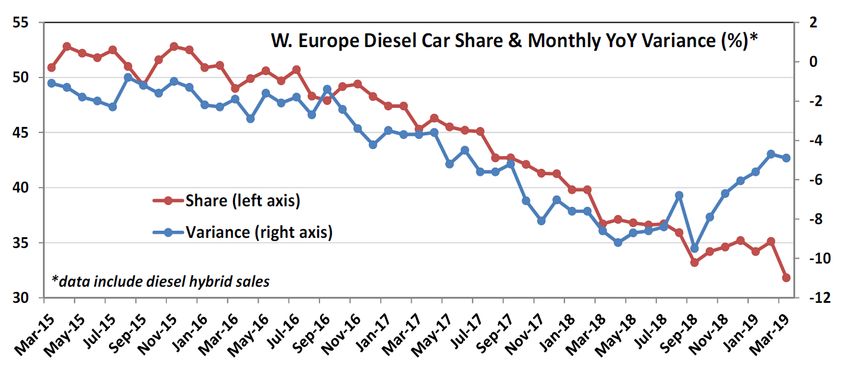
MINING SUPPLY: SOUTH AFRICAN SUPPLY
POWER DISRUPTION AND LABOUR ACTION RISKS
              South African quarterly production (koz)

 1,300                                                                                  • South African mining supply against
                                                                                          seasonal trend of weak Q1 due to
 1,200
                                                                                          release of smelter pipeline stock
 1,100
                                                                                        • Power disruptions in Q1’19 crimped
 1,000                                                                                    refined production and remains an
                                                                                          ongoing risk (Eskom “load shedding”)
    900

    800                                                                                 • Industrial action risk heightened in
                                                                                          H2’19 due to wage negotiations with
    700
                                                                                          AMCU
    600
          Q1'15                 Q1'16                   Q1'17       Q1'18       Q1'19

                Refined production                              Q1 production

Source: WPIC Platinum Quarterly Q1 2019, SFA (Oxford)                                                                            6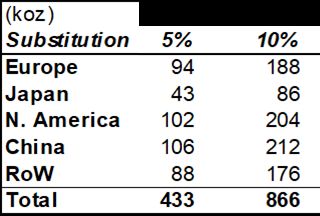
RECYCLING: Q1 RECYCLING UP, AUTOCATALYST UP,
JEWELLERY DOWN
                                    Recycling (koz)

    600                                                                             • Q1’19 autocatalyst recycling up 8% on
                                                                                      Q1’18 – down 7% on record Q4’18
    500
                                                                                    • Palladium and rhodium prices
    400                                                                               increasing gasoline and all catalyst
                                                                                      recycling
    300

                                                                                    • Jewellery recycling down 4% YoY on
    200
                                                                                      low platinum price and soft sales in
                                                                                      China
    100

       0
           Q1'15                Q1'16                   Q1'17     Q1'18     Q1'19

                      Autocatalyst                              Jewellery

Source: WPIC Platinum Quarterly Q1 2019, SFA (Oxford)                                                                         7
Q1 2019 DEMAND: STRONG INVESTMENT MORE
THAN OFFSETS LOWER AUTO AND JEWELLERY
DEMAND Q1 2018 // Q4 2018 Q1 2019
Automotive 805 780 765
• Automotive demand down 5% (40 koz)
Autocatalyst 770 740 725 YoY but decline in diesel sales slows
Non-road 35 40 40
Jewellery 605 600 560
• Jewellery down in China, partly offset by
growth in all other regions
Industrial 475 470 470
Chemical 145 135 160
Petroleum 55 55 55
• Industrial stable
Electrical 55 50 55
Glass 60 45 50 • ETF demand surges to record high,
Medical & Biomedical 55 70 55
Other 105 115 95
supported by solid bar and coin
purchases
Investment 60 -65 765
Change in Bars, Coins 85 50 75
Change in ETF Holdings -15 -115 690
• Q1’19 total demand up 32% YoY
Change in Stocks Held by Exchanges -10 0 0
• Market deficit also highest ever
Total Demand 1,945 1,785 2,560
Balance -200 250 -550
Source: WPIC Platinum Quarterly Q1 2019, SFA (Oxford) 8Q1 2019 DEMAND: AUTOCATALYST DECLINE
CONTINUED BUT SLOWER RATE OF SALES DECLINE
Autocatalyst demand (koz)
1,000 • Autocatalyst (excl. non-road) demand fell
900 6% to 725 koz in Q1’19 from 770 koz in
800 Q1’18
700
• W. Europe diesel share declined slowed
600
on increased evidence of cleaner diesels
500
400 • Diesel vehicles still have vital role in
300 meeting CO2 targets and avoiding heavy
200 fines
100
0
Q1'15 Q1'16 Q1'17 Q1'18 Q1'19
Source: WPIC Platinum Quarterly Q1 2019, SFA (Oxford) 9Q1 2019 DEMAND: JEWELLERY REMAINS WEAK IN
CHINA - GROWTH IN ALL OTHER REGIONS
Jewellery demand (koz)
800 • Jewellery demand was 560 koz in
Q1’19, down 7% as Chinese demand
700
fell sharply again
600
500 • Gains in all other regions were more
than offset by China weakness
400
300 • Platinum purchases on SGE down -
reflecting weakness in China retail
200
jewellery sales
100
0
Q1'15 Q1'16 Q1'17 Q1'18 Q1'19
Source: WPIC Platinum Quarterly Q1 2019, SFA (Oxford) 10Q1 2019 DEMAND: INDUSTRIAL DEMAND STABLE,
CHEMICAL UP, GLASS AND OTHER DOWN
Industrial demand by category (koz)
500 • Platinum industrial demand was 470
450 koz in Q1’19, down 5 koz (-1%) YoY,
400 flat QoQ
350 Chemical
• Increase in new catalyst purchases by
300 Petroleum
the chemical sector in China
250
Electrical
200 • Construction of fewer new glass
Glass
150 fabrication facilities in China reduced
Medical
100 new metal demand for tooling
50 Other
0 • Other - lower consumption in
Q1'15 Q1'16 Q1'17 Q1'18 Q1'19 automotive sensors and fuel cells
Source: WPIC Platinum Quarterly Q1 2019, SFA (Oxford) 11Q1 2019 DEMAND: INVESTMENT SURGE ON RECORD
ETF INFLOW AND SOLID BAR & COIN PURCHASES
Investment demand by category (koz)
800 • ETF demand in Q1’19 surged 690 koz,
largest ever rise in Pt ETF holdings
600
Net • Bar & coin demand at 75 koz with
400 strong US coin purchases, lacklustre
Japanese bar purchases
200
• Exchange stocks unchanged
0
• Net investment demand of 765 koz,
-200
swings market to 550 koz deficit in
-400
Q1’19
Q1'15 Q1'16 Q1'17 Q1'18 Q1'19
Bar and coin ETFs Exchange stocks
Source: WPIC Platinum Quarterly Q1 2019, SFA (Oxford) 12ANNUAL BALANCES: 2019 SURPLUS DOWN ON 2018 AS
DEMAND INCREASES 295 KOZ MORE THAN SUPPLY
• South African supply up 5% (225 koz) on
one-off work in process release; North
America supply up 13% (45 koz) on a
project ramp up
• Recycling up 3% (60 koz) on higher
autocatalyst offset by lower jewellery
• Total supply up 4% (320 koz) in 2019
• Total demand up 8% (615 koz) on
investment demand surge, partly offset
by small automotive, jewellery and
industrial declines
• Surplus in 2019 (375 koz) narrows from
2018 (670 koz)
Source: WPIC Platinum Quarterly Q1 2019, SFA (Oxford) 132019 TOTAL SUPPLY UP 4% - SA MINING SUPPLY UP 5%
WITH DOWNSIDE RISK - TOTAL DEMAND UP 8%
Total mining supply 2018 to 2019 (koz)
6,600 • Mining supply up 4% - South Africa up
6,500
45 5 5 -25 6,375 6,400
5% on work in progress build-up in
225 5
6,300 2018 and US up on new project
6,200
6,115
6,100
• SA mine supply risks elevated due to
6,000
5,900 constrained Eskom power supply and
5,800 labour tension (wages/job losses)
2018 S. Africa Zim N. America Russia Other From stocks 2019f
Total demand 2018 to 2019 (koz) • Total demand up 8% - investment
8,500 offsets weak automotive and jewellery.
770 7,995
8,000
Industrial is down 1% - but at similar
level to strong demand in 2018
7,380 -95 7,500
-45 -15
7,000 • Investment strength is led by significant
6,500
ETF buying in 2019 and expected
continued steady bar and coin demand
6,000
2018 Automotive Jewellery Industrial Investment 2019f
Source: WPIC Platinum Quarterly Q1 2019, SFA (Oxford) 14AGENDA: PLATINUM QUARTERLY
Q1 2019 AND 2019 FORECAST
1. Introduction
Paul Wilson
2. Platinum Quarterly, Fundamentals review
Trevor Raymond
3. Focus on fundamental drivers
• Platinum ETFs
• Diesel stabilisation
• Platinum in gasoline catalysts
Trevor Raymond, Director of Research
4. Questions
Paul Wilson
Trevor Raymond
15PLATINUM ETF HOLDINGS INCREASED MARKEDLY IN
2019, UNDERPINS FORECAST INVESTMENT DEMAND
Platinum: ETF holdings and price
• Q1’19 platinum ETF growth of 690 koz
informs 2019 investment demand
forecast of 785 koz
• Major growth in South Africa (418 koz),
EU (196 koz), US (77 koz)
• First major institutional positioning growth
since 2014 – a combination of factors
required to outweigh long-standing
negative sentiment and price decline
Source: Bloomberg, WPIC research 16ETF GROWTH IN Q1’19: LARGE INSTITUTIONAL HOLDERS,
MULTI-YEAR POSITION, TIGHTER MARKET
Selection of large institutions’ Pt ETF holdings (oz)
• Institutional holdings of platinum ETFs
typically multi-year (3 – 5 y)
• Chart examples SA, US and UK(3) –
voluntary quarterly reporting
• Highly likely that 690 koz are institutional
positions with multi-year view
• Tight market enhances investment case
for new entrants
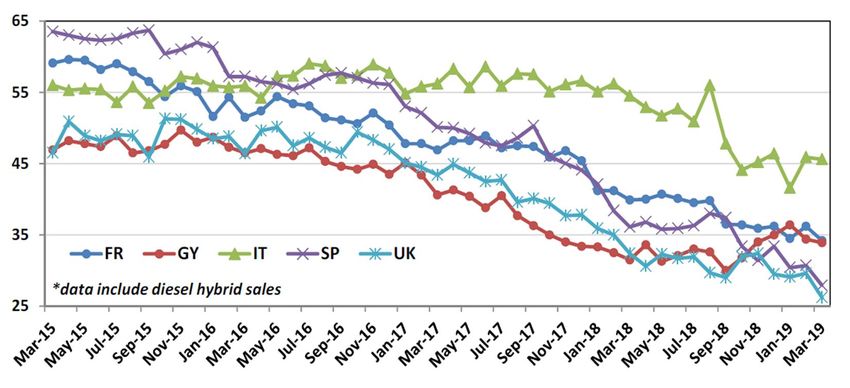
Source: Bloomberg, WPIC research 17DIESEL CAR SALES IN WESTERN EUROPE STABILISING,
SEASONALLY WEAK MARCH EXPECTED
Western European diesel share of auto sales
• W. Europe diesel share over 50% in
2015, prior to Dieselgate
• 33.8% in Sept’18 to 35% in Feb’19 and
31.7% in Mar’19
• Expected weak March - worse in UK:
politics and new London LEZ
• New models well below Euro 6 NOx
level on-road, all new car sales RDE
from 1 Sept 2019
• City bans being addressed to allay
consumer fears – access and resale
value
Source: WPIC research, LMC Automotive 18DIESEL CAR SALES IN WESTERN EUROPE STABILISING,
RATE OF DECLINE DOWN STEADILY FROM SEPT’18
Western European diesel car share % (lhs), Monthly YoY variance % (rhs) (LMC)
Source: WPIC research, LMC Automotive 19DIESEL CAR SALES IN WESTERN EUROPE STABILISING,
WEAK MARCH – UK WORSE, GERMANY FIRM
Western Europe Big 5 diesel car share % (LMC)
Source: WPIC research, LMC Automotive 20WESTERN EUROPE DIESEL PORTION – MOVING FROM
PLATINUM DEMAND LOSS TO DEMAND GAIN?
Western
Western EuropeEuropean Diesel(%),
diesel share Share (monthly, demand
automotive lhs) and (koz)
55% Autocatalyst Demand (quarterly koz,rhs)
500
• Diesel share declined from 50% in Q1’16
50% to 34% in Q1’19 (source: LMC)
45% 400 • Autocat demand fell from 1.7 Moz in 2016
to 1.3 Moz in 2018, a 400 koz loss
40% 300
• Recent strong automaker statements on
35%
vital role for diesel in CO2
200
30% • All diesel cars ‘clean’ from Sept 2019 with
100 independent proof
25%
• A 4% recovery over 2 years = c. 100 koz
20% 0
01/16 07/16 01/17 07/17 01/18 07/18 01/19 of added Pt demand, but likely more
1% change in EU diesel share = c.25kozpa autocat demand
Source: SFA (Oxford), LMC Automotive, WPIC research 21PALLADIUM PRICE PULL-BACK, TEMPORARY?
SUSTAINED METAL SHORTAGE, NO SUPPLY RESPONSE
Platinum and palladium price
Pd premium since 09/17; • Palladium in 8th consecutive deficit
1,600 Currently $500/oz
Platinum
1,500
1,400
Palladium • Cumulative deficit 4.6 moz
1,300
1,200 • 2 moz from Palladium ETFs – balance
USD/oz
1,100
1,000 from OTC / above ground stocks
900
800 • Palladium above platinum from Sept’17,
700
600 expanding sharply in Q3 2018
01/17 05/17 09/17 01/18 05/18 09/18 01/19 05/19
• Peak Pd / Pt premium $743/oz
Palladium futures curve
• Palladium in sustained backwardation for
18 months – shortage of ingot and
sponge
Source: Bloomberg, WPIC research 22PALLADIUM SUBSTITUTION – PROVEN TECHNOLOGY
A SMALL PORTION IS VERY MATERIAL FOR PLATINUM
2013 JM study: Gasoline Pt:Pd ratio is 1:1 • 2013 Johnson Matthey study on ‘in-
service’ Euro 5 gasoline catalyst shows:
• Substitution ratio of 1:1
• No performance risk, no re-tooling
• No additional (new model) certification
Regional impact of Pt replacing Pd (koz)
• A relatively small amount of substitution
from Pd to Pt (at 1:1 ratio) is meaningful
• Using 2018 Pd auto demand, 5%
substitution of Pd would increase Pt
autocatalyst demand by over 400 koz pa
• Market acceptance of WHEN not IF
Source: Johnson Matthey: A Study of Platinum Group Metals in Three-way Autocatalysts, Platinum Metals Review, J Cooper & J Beecham, 2013,57,(4), 281-288, © 2013 Johnson 23
Matthey, extracts from table V. http://dx.doi.org/10.1595/147106713X671457, WPIC researchIMPACT OF POTENTIAL PALLADIUM SUBSTITUTION –
FORD F-SERIES (GASOLINE) SALES IN US
Ford F Series (F150 – F450) sales
• Ford c.32% of segment ~1m per annum
• Total market segment of ~3m
• Easy win for palladium substitution:
• Low temperature gasoline engine
• High palladium loading 7 – 14g / vehicle*
• High margin large vehicle
• Only 20% substitution (i.e. 2g of 10g) will
increased platinum demand by 180 koz
per annum – one segment only!
• New models could substitute >>20%
Source: Ford, GM, WPIC research. * Note: unpublished estimates 24AGENDA: PLATINUM QUARTERLY
Q1 2019 AND 2019 FORECAST
1. Introduction
Paul Wilson
2. Platinum Quarterly, Fundamentals review
Trevor Raymond
3. Focus on fundamental drivers
Trevor Raymond
4. Questions
Paul Wilson, CEO
Trevor Raymond, Director of Research
25You can also read