Insurance Markets in Figures - OECD
←
→
Page content transcription
If your browser does not render page correctly, please read the page content below
Insurance Markets in Figures

                                                      June 2020

           COVID-19 may curb the positive premium and investment
           income growth of insurers
           The positive premium and investment income growth in 2019 for most insurers may not be maintained in 2020
           as insurers face the economic and social implications of COVID-19 (Box 1).

                                                                  Box 1. Preliminary outlook for 2020

The global spread of COVID-19 in 2020 has created major challenges around the world, with individuals at risk of being infected
by a contagious and deadly virus and many businesses shut down for public health purposes. This global health and economic
crisis is also set to have an impact on insurance companies. They are likely to face changes in the demand for insurance policies
and claims experience as well as impacts on the value of the assets that they hold to meet their obligations to policyholders.

Available data for Q1 2020 show the impact on premium growth varying from country to country. For example, quarterly data
from the Australian Prudential Regulation Authority (APRA) shows a decrease in gross premiums written for commercial motor
vehicle and for professional indemnity in Q1 2020 compared to Q4 2020. The US NAIC’s snapshot for Q1 2020 shows a 4.5%
increase in net premiums written for property and casualty compared to Q1 2019. This trend is likely to change from Q2 2020
onwards due to the economic impact of confinement measures implemented in US states in the latter part of Q1. Some
initiatives from the industry around the world, such as partial refunds or rebates of premiums paid for coverages less likely to
incur claims as a result of the lockdown or deferral of premium payments, may also influence trends in premiums (See OECD
note “Responding to the Covid-19 and pandemic protection gap in insurance”).

Claims payments for COVID-19 related damages and losses will vary by line of business and according to the terms of the
insurance contracts. The OECD’s Initial assessment of insurance coverage and gaps for tackling COVID-19 impacts indicates that
the beneficiaries of life insurance policies of people dying from COVID-19 will generally be entitled to payments from such life
insurance policies, as insurance companies do not normally apply exclusions based on the cause of death (except for suicide).1
In the health insurance sector, the National Association of Insurance Commissioners in the United States has already noted a
3.5% increase in hospital and medical expenses paid by insurers in Q1 2020 compared to Q1 2019. For some classes of insurance,
such as commercial property (and particularly business interruption coverage), significant uncertainty remains regarding the
ultimate impact of COVID-19 on claims experience.

The COVID-19 outbreak has also had a knock-on effect on financial markets and this is likely to affect the investment
performance of insurers in 2020. Major stock markets fell in Q1 2020 (although many regained some of the losses in Q2). Given
the high allocation of insurers’ assets to bond investments, a particular implication may be the potential for investment losses
on these portfolios as a slowing economy increases the risk of corporate bond defaults. APRA’s quarterly data already show that
Australian life and non-life insurers recorded negative investment income in Q1 2020. Insurers in other parts of the world are
also likely to record poor investment performance in early 2020.
1In the United States, death benefits are generally paid to beneficiaries after two years from the effective date of an individual life policy. Group life policies typically do not have a
suicide clause.

Insurance Markets in Figures provides a short preview of the latest trends in the insurance sector in a selection of 45 OECD and non-OECD countries. This
fourth issue shows indicators based on preliminary data for 2019, and presents an early outlook for 2020. An Excel file of the underlying data is available at
http://www.oecd.org/finance/insurance/globalinsurancemarkettrends.htm. This factsheet was made possible by close co-operation between the OECD, the
Association of Latin American Insurance Supervisors (ASSAL) and the various national bodies that provided data and comments.
A more developed analysis based on the final data collected for 2019 will be published in the 2020 edition of Global Insurance Market Trends (forthcoming).
For more information, please contact Romain Despalins (romain.despalins@oecd.org) or Mamiko Yokoi-Arai (mamiko.yokoi-arai@oecd.org).
© OECD – 2020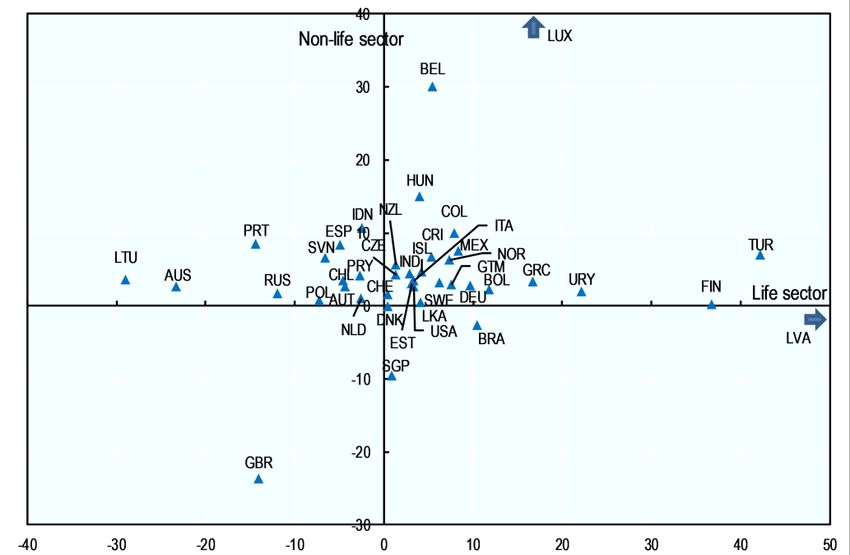
INSURANCE MARKETS IN FIGURES - 2020

In 2019, premiums were still on the rise, especially in the non-life insurance sector
Preliminary data for 2019 show that gross premiums written rose in 2019 in most countries, especially in the
non-life sector, continuing the global growth observed in recent years. Gross premiums grew in real terms in 24
(out of 41) reporting countries in both life and non-life sectors, in 12 other countries in the non-life sector only
and in 4 other countries in the life sector only (Figure 1). Only the United Kingdom experienced a decline in
premiums in both life and non-life sectors.

Trends in the life and non-life sectors varied widely across countries in 2019. The growth rate of life premiums
ranged from -29% in Lithuania to 42.2% in Turkey (and was even higher in Latvia). In the non-life sector, the
fastest growth rate was recorded in Luxembourg with a 173.4% increase while the United Kingdom recorded the
largest decline (-23.6%).

   Figure 1. Annual real growth rates (%) of direct gross premiums of domestic insurance companies by sector, 2019
                                                       (preliminary)

               Notes: See the end of this factsheet for methodological notes.
               Source: OECD Global Insurance Statistics.

Premium growth partly depends on the demand for insurance products. The Financial Market Commission of
Chile noted a decline in the sales of life insurance policies (which partly accounts for the 4.6% decline in life
premiums) while sales of non-life insurance policies rose (which partly accounts for the 3.4% increase in non-life
premiums). Some authorities, such as in Colombia and Sweden, link the increase in the sales of non-life insurance
policies to the growth of the domestic economy, as business expansion normally increases the need for
insurance coverage.

The evolution of the price of insurance policies also affects the growth of life and non-life premium volumes.
The new tax on motor third party liability policies in Hungary in 2019 led to a rise in the price of these policies,
which may partly explain the 15% increase in non-life premiums overall. A price increase in insurance policies
also drove premium growth between 2018 and 2019 in Guatemala, according to the national authorities.

In some cases, the overall trends in the life and non-life sectors also partly reflect the reorganisation of the
insurance industry. One example is a domestic company in Lithuania, which completed its reorganisation process
in 2019 by becoming a branch of a company registered in Latvia. This contributed to the 29% decline of gross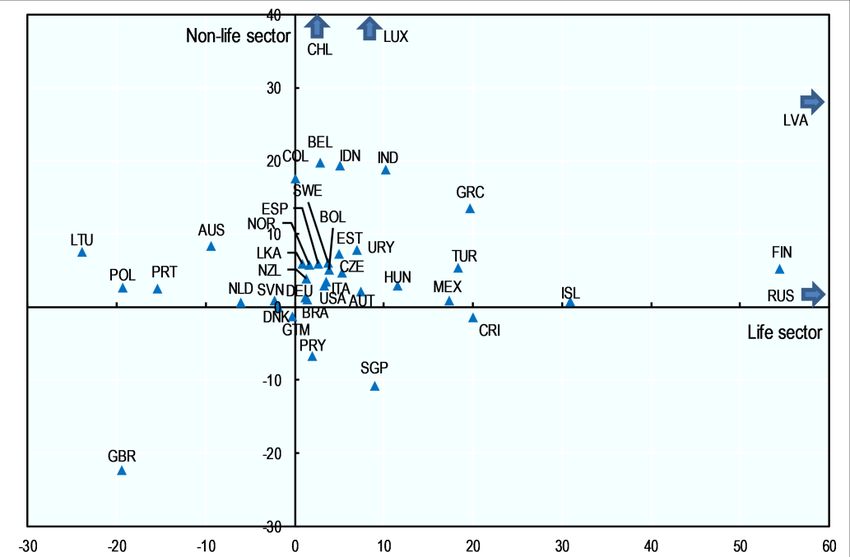
INSURANCE MARKETS IN FIGURES - 2020

premiums of domestic companies in the life sector in Lithuania because this reorganised company was no longer
in the scope of Lithuania’s reporting. The decision of the United Kingdom to leave the European Union may also
be having an impact on the insurance industry in Europe. In Luxembourg, for example, the Insurance Commission
noted that some insurance companies sought authorisation to establish themselves in and operate from
Luxembourg as a consequence of the Brexit process. This drove the high premium growth that Luxembourg
recorded in the non-life sector in 2019. In parallel, the United Kingdom recorded a fall in premiums in both the
life and non-life sectors as some companies moved out of the domestic insurance market.

Most countries experienced a rise in gross claims payments in 2019
Insurance companies paid out a higher amount in claims in 2019 than in 2018 in most reporting countries. Gross
claims paid increased in real terms in 28 (out of 40) reporting countries in both life and non-life sectors, in 6
other countries in the non-life sector only and in 3 other countries in the life sector only (Figure 2). Gross claims
payments declined in both life and non-life sectors in the three remaining reporting countries (i.e. Denmark,
Guatemala and the United Kingdom).

    Figure 2. Annual real growth rates (%) of direct gross claims paid by domestic insurance companies by sector,
                                                   2019 (preliminary)

           Notes: See the end of this factsheet for more methodological notes.
           Source: OECD Global Insurance Statistics.

In some countries, increases in claims payments accompanied the development of the insurance market to some
extent, as suggested by the Bolivian authorities with respect to their domestic market.

Trends in the life sector are usually related to customer behaviours (such as policy surrenders), changes in
policyholder death rates or the maturing of contracts. The large increase in claims payments in Russia, up by
more than 80% in 2019, can be attributed to 3- and 5-year investment life insurance contracts reaching their
terms in 2019. The Central Bank of Russia expects a peak of payments for 3-year investment life insurance
contracts in 2020 as premiums paid for these types of contracts were the highest on record in 2017.

Trends in gross claims payments in the non-life sector can usually be attributed to the frequency and severity of
events that insurers cover. The high increase in claims payments in Chile (73.8%) was mainly caused by claims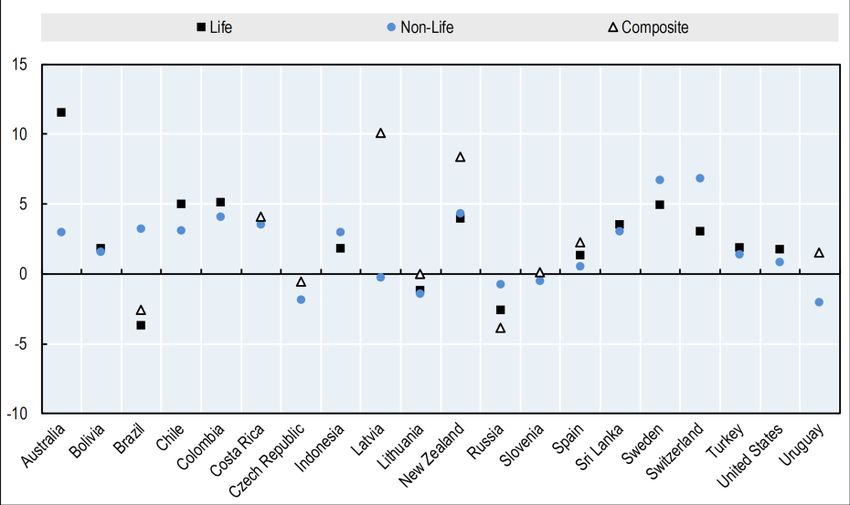
INSURANCE MARKETS IN FIGURES - 2020
for fire and additional risks to fire insurance following the social unrest in October 2019. In Australia, the 8.3%
increase in gross claims payments in 2019 results to some extent from the Townsville flood and multiple
bushfires. In Belgium, two spells of bad weather in March 2019 contributed to the 19.8% rise in claims paid by
insurance companies in 2019. The Czech Republic was also hit by extreme weather events in 2019, such as the
storm Eberhard, which partly account for the 4.7% increase in non-life claims payments.
Insurers invested mostly in bonds in 2019, with some reallocation between
sovereign and corporate bonds in some countries
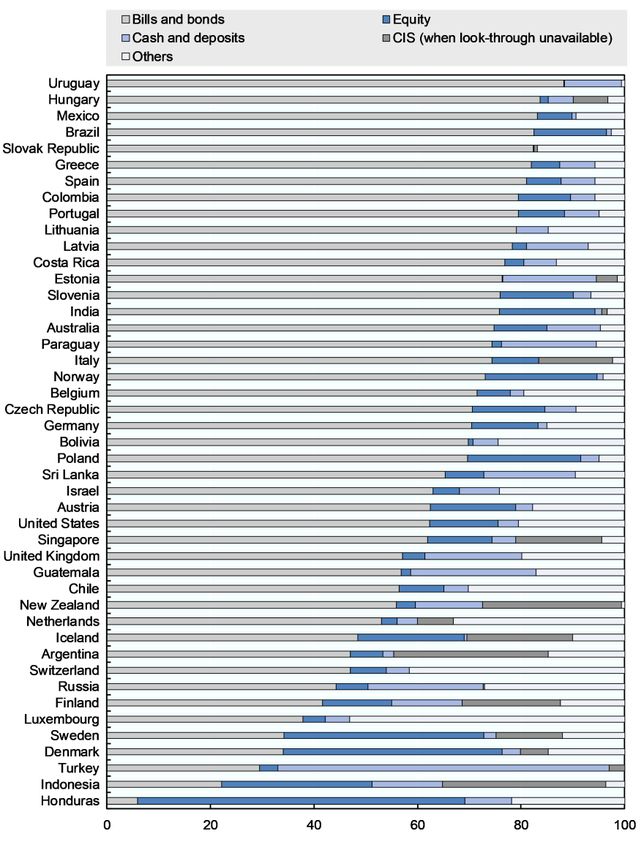
Bills and bonds accounted for more than half of the investments of insurance companies in 34 (out of 45)
reporting countries in 2019, including, for instance, Germany, the United Kingdom and the United States
(Figure 3). They represented the largest proportions of insurer investments (directly or indirectly through mutual
funds) in Uruguay (88.2%), Hungary (83.7%) and Mexico (83.2%).
Figure 3. Asset allocation of domestic insurance companies (all sectors), 2019 (preliminary)
As a percentage of total investment
Notes: See the end of this factsheet for methodological notes.
Source: OECD Global Insurance Statistics.INSURANCE MARKETS IN FIGURES - 2020
The Slovak and Slovenian authorities have noted a recent reallocation within the bond category as insurers
shifted their investment strategy away from government bonds towards corporate bonds. This trend may reflect
an attempt to earn higher investment income in a prolonged low interest rate environment.
Insurers in a few countries favoured investments in equities, such as in Denmark and Sweden among OECD
countries. In these two OECD countries, equities represented around 40% of the investments of insurers in 2019
and exceeded investments in bills and bonds.
Investments in instruments other than bills, bonds, equities, cash and deposits were significant in some countries
such as Chile, Luxembourg and the Netherlands where they accounted for more than 30% of investments of
insurers. Insurers in the United Kingdom and in the United States also invested quite significantly in these other
investments (around 20% of assets). The OECD’s ongoing collection of final data for 2019 will provide further
insights into the asset allocation of insurers in these countries.
Insurers achieved a positive investment performance in most countries in 2019
Insurers achieved positive real investment rates of return in 2019 – regardless of whether they engaged in life
insurance activities only (i.e. life insurers), non-life insurance only (i.e. non-life insurers) or both (i.e. composite
companies) – in 13 out of the 20 reporting countries, including, for instance, Switzerland and the United States
(Figure 4).
Figure 4. Average real net investment return by type of domestic insurer in 2019 (preliminary) (%)
Notes: See the end of this factsheet for methodological notes.
Source: OECD Global Insurance Statistics.
Insurance companies may have benefitted from a global recovery of stock markets in 2019, following a downturn
in Q4 2018. These favourable developments partly contributed to the positive investment income of some
insurers, such as for life insurers in Australia which achieved the strongest real investment rate of return in 2019
(11.5%) among reporting countries. The Latvian authorities also attributed the better investment performance
of composite insurers (10.1%) relative to non-life insurers (-0.3%) in 2019 to the riskier investment strategy of
composite insurers and a larger proportion of assets invested in equity.
While falling interest rates may enable insurers to achieve unrealised gains in the fixed-interest investments
they held (e.g. non-life insurers in Australia), some authorities – Slovak Republic and Slovenia – reported that
the low yield environment still represented a challenge for insurers. Low interest rates limit the ability of insurers
to achieve strong investment returns through newly issued bonds.INSURANCE MARKETS IN FIGURES - 2020
In some countries, such as the Czech Republic, investment gains in 2019 were lower than inflation. Non-life and
composite insurers in the Czech Republic achieved positive nominal investment rates of return in 2019 (1.3%
and 2.7% respectively) although these nominal returns were below the 3.2% rate of inflation between December
2018 and December 2019.
METHODOLOGICAL NOTES TO BE TAKEN INTO CONSIDERATION WHEN INTERPRETING THE DATA
General: Data are collected within the framework of the OECD Global Insurance Statistics (GIS) project. Data in this note are preliminary
and may be revised in the 2020 edition of the report Global Insurance Market Trends (forthcoming). This note focuses mainly on the
direct insurance business of domestically incorporated undertakings (i.e. incorporated under national law) in reporting countries, and
includes data for the following participating countries among:
● OECD Members: Australia, Austria, Belgium, Chile, Colombia, Czech Republic, Denmark, Estonia, Finland, Germany, Greece,
Hungary, Iceland, Israel, Italy, Latvia, Lithuania, Luxembourg, Mexico, Netherlands, New Zealand, Norway, Poland, Portugal,
Slovak Republic, Slovenia, Spain, Sweden, Switzerland, Turkey, United Kingdom, United States;
● ASSAL (non-OECD) Members: Argentina, Bolivia, Brazil, Costa Rica, Guatemala, Honduras, Paraguay, Uruguay;
● Other jurisdictions: India, Indonesia, Russia, Singapore, Sri Lanka.
Data may cover insurance companies subject to Solvency II quarterly reporting requirements only and exclude the smallest insurance
companies for some countries.
Data for Estonia and Lithuania include business abroad. Data for Indonesia cover conventional and sharia insurance. Data for Mexico
cover insurance and surety institutions. Data for the Netherlands include basic health insurance. Data for New Zealand cover 28
insurance companies with gross annual premiums over NZD 50 million or total assets over NZD 500 million at financial year-end.
Insurance companies may carry out life insurance activities only (i.e. life insurers), non-life insurance activities (i.e. non-life insurers) or
both (i.e. composite insurers). In some countries, some insurance companies that are considered as life insurers (respectively non-life
insurers) can carry out some specific non-life (respectively life) activities on an ancillary basis.
Countries in some charts are labelled with their ISO code. ISO codes are available on the United Nation Statistics Division internet page
at the following address: http://unstats.un.org/unsd/methods/m49/m49alpha.htm.
Figure 1: Growth rates are calculated over the period Dec 2018 – Dec 2019 except for India (March 2018 – March 2019) and Paraguay
(June 2018 – June 2019). Gross premiums grew by 26.3% in the life sector and 34.2% in the non-life sector in nominal terms between
June 2018 and June 2019 in Argentina (information not available in real terms). Gross premiums grew by 146.4% in the life sector in
Latvia and by 173.4% in the non-life sector in Luxembourg in 2019 compared to 2018 in real terms (results not shown for readability
purposes).
Figure 2: Growth rates are calculated over the period Dec 2018 – Dec 2019 except for India (March 2018 – March 2019) and Paraguay
(June 2018 – June 2019). Gross claims paid grew by 44.1% in the life sector and 54.9% in the non-life sector in nominal terms between
June 2018 and June 2019 in Argentina (information not available in real terms). Data for Greece refer to growth rates of claims incurred.
Gross claims paid grew by 81.9% in the life sector in Russia, by 95.8% in the life sector in Latvia, by 73.8% in the non-life sector in Chile
and by 148.5% in the non-life sector in Luxembourg in 2019 compared to 2018 in real terms (results not shown for readability purposes).
Figure 3: Data refer to end-2019 for all countries, except Argentina (end June 2019), India (end March 2019) and Paraguay (end June
2019). The GIS database gathers information on investments of insurance companies in collective investment schemes (CIS) and the
look-through of these investments in equities, bills and bonds, cash and deposits and other instruments or vehicles. Data on asset
allocation in this figure show both direct investments of insurance companies in equities, bills and bonds and cash and deposits, and
their indirect investments in these categories through CIS when the look-through of CIS investments is available. When the look-
through is not available, investments in CIS are shown in a separate category and data in the figure for countries in this case only show
direct investments of insurance companies in equities, bills and bonds and cash and deposits. Negative values in some categories were
excluded from the calculations of the asset allocation. Investments of insurance companies related to unit-linked products are excluded
from the calculations of the asset allocation, except for Indonesia where they are combined with investments from non-unit-linked
insurance in the main investment categories. The “Others” category includes both investments in equities and CIS for Lithuania.
Figure 4: Average rates of return are calculated over the period Dec 2018 – Dec 2019 for all countries, except Argentina (June 2018 –
June 2019. These rates include realised and unrealised (but recognised) gains and losses plus income, after subtracting any investment
management costs. Average real net investment rates of return are calculated based on the nominal net investment rates of return
reported by countries and the variation of the consumer price index over the same period. In Argentina, life, non-life and composite
insurers achieved a 34.4%, 36.2% and 32.8% nominal investment rate of return respectively (real returns not available). Data for
Indonesia refer to conventional insurance products only.
This work is published under the responsibility of the Secretary-General of the OECD. The opinions expressed and arguments employed herein do not necessarily reflect the official views of
the OECD or the governments of its member countries. This document and any map included herein are without prejudice to the status of or sovereignty over any territory, to the delimitation
of international frontiers and boundaries and to the name of any territory, city or area.
The statistical data for Israel are supplied by and under the responsibility of the relevant Israeli authorities. The use of such data by the OECD is without prejudice to the status of the Golan
Heights, East Jerusalem and Israeli settlements in the West Bank under the terms of international law.You can also read