Buffettology June 2019 - Unique Manager Showcase Series

Page created by Benjamin Mclaughlin
 
CONTINUE READING
Buffettology June 2019 - Unique Manager Showcase Series
June 2019

Buffettology

     Investing is most intelligent when it is most business-like
Important Information
  For professional investors only and should not be distributed or shown to retail investors

  This presentation is approved as a financial promotion for the above purpose only by Castlefield Investment Partners LLP (CIP).

  The Authorised Corporate Director (ACD) of the CFP SDL UK Buffettology Fund (‘Buffettology Fund’) is Castlefield Fund Partners Limited (CFP), which is authorised and regulated by the Financial Conduct
  Authority. Registered in England & Wales No. 04605261. Registered Office: 111 Piccadilly, Manchester, M1 2HY.

  Sanford DeLand Asset Management Ltd (SDL) is registered in England & Wales No. 07197573. Registered office: 8th Floor, 111 Piccadilly Manchester, M1 2HY. SDL is an Appointed Representative of
  Castlefield Investment Partners LLP (CIP), which is authorised and regulated by the Financial Conduct Authority and is a member of the London Stock Exchange. CIP is registered in England & Wales
  No. OC302833

  Opinions constitute our judgement as of this date and are subject to change without warning. The officers, employees and agents of CIP, may have positions in any securities mentioned herein. This
  document shall be governed by and construed in accordance with the law of England and Wales and is subject to the exclusive jurisdiction of the English Courts. The information, products and services
  referred to in this publication are not directed at any person or entity in any jurisdiction or country outside the United Kingdom.

  The value of investments, and the income from them, can go down as well as up, and you may not recover the amount of your original investment. Past performance is not necessarily a guide to
  future performance. Where an investment involves exposure to a foreign currency, changes in rates of exchange may cause the value of the investment, and the income from it, to go up or down.
  In the case of some investments, you should be aware that there is no recognised market for them, and that it may therefore be difficult for you to deal in them or for you to obtain reliable
  information about their value or the extent of the risks to which they are exposed. Certain investments carry a higher degree of risk than others and are, therefore, unsuitable for some investors.
  Before contemplating any transaction, you should consider whether you require financial advice, which we would be pleased to provide upon request.

  Whilst the contents of this document are provided in good faith for information purposes only, no representation or warranty, express or implied is given by CIP or by any of its partners, members,
  employees or agents as to its accuracy or completeness or that it is up to date, and it should not be relied on as such. To the fullest extent allowed by law and the rules and regulations of the FCA, CIP
  and its partners, members, employees and agent shall not be liable, whether in contract, tort (including negligence) or otherwise howsoever, for any losses, damages, costs or expenses of whatever
  nature (including (without limitation) any consequential, indirect or unforeseeable loss or loss of bargain, opportunity or profit) incurred or suffered by you or any third party arising out of or in
  connection with the use of the contentsof this document.

  The information in this presentation is not intended as an offer or solicitation to buy or sell securities or any other investment or banking product, nor does it constitute a personal
  recommendation.

Buffettology                                                                                                                                                                                         2
Sanford DeLand Asset Management Ltd.

   •     Privately owned, established March 2010
   •     Keith Ashworth-Lord: Over 30 years’ experience in equity markets
   •     Invests significant amount of net worth in the fund
   •     Fundamental bottom-up stock picking approach
   •     Concentrated Portfolio consisting of 25 – 35 stocks
   •     Unconstrained by benchmarks
   •     The only Buffettology license holder outside of the US
   •     The Buffettology Fund has the highest risk-adjusted returns in the IA UK All Companies sector since launch*

Source: *Data from FE based on the returns of the Institutional Income share class to 31 May 2019. All performance stated has been calculated as net. Past
performance is not a guide to future performance;the value of an investment and income from it can go down as well as up.

Buffettology                                                                                                                                                 3
The Team behind
                                                       Sanford DeLand                               Buffettology

               Keith Ashworth-Lord                                      Andrew Vaughan
               Chief Investment Officer                                 Investment Research Analyst
               Prior to founding Sanford DeLand, Keith was a            Prior to joining Sanford DeLand, Andrew held
               self-employed consultant working with a variety of       consulting roles in research, with a specialisation in
               stockbroking, fund management and investor               Business Perspective Investment. He previously
               clients. He is a Chartered Fellow of the Chartered       worked in equity research and sales in London
               Institute for Securities and Investment.                 and the Far East.

Buffettology                                                                                                                     4
Fund Performance
                                                                                                                                                        •    Total outperformance

                                                                                                                                    Outperformance
                                                                                                                                                             since inception:
                                                                                                                                                             +163.87%
                                                                                                                                                        •    Annualised
                                                                                                                                                             outperformance:
                                                                                                                                                             +8.97%

                                                                                                                                                       Since
                                                                   3 Month    6 Month        1 Year         3 Year        5 Year
                                                                                                                                                     Inception
                      CFP SDL UK Buffettology Fund Institutional
                                                                    12.72%     10.76%        12.14%         64.60%       108.07%                      239.86%
                      Inc TR in GB
                      IA UK All Companies                           3.10%      5.20%          -4.70%        23.57%        28.52%                      75.99%
                      Rank                                          6 / 265    24 / 264       2 / 263       2 / 250       1 / 236                      1 / 218
                      Quartile                                        1           1             1             1             1                            1

Source: Data from FE based on the returns of the Institutional Income share class to 31 May 2019. All performance stated has been calculated as net. Past performance is
not a guide to future performance; the value of an investment and income from it can go down as well as up.

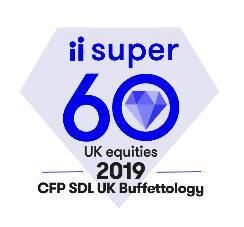
Buffettology                 In the long-term, there is a 100% correlation between the success of a business and its share price performance                               5
Low Volatility, High Returns
                                      Buffettology Fund vs. IA UK All Companies Sector Since Launch
                            18
                                                                                                                                                    Tracker
                                                                                                                   Since inception   Buffettology             Sector
                                     Buffettology Fund                                                                                               Funds
                                                                                                                   (28/03/11)           Fund                  Average
                            16                                                                                                                      Average
                                                                                                                   Annualised
                                                                                                                                      +16.13%       +6.34%    +7.06%
                            14                                                                                     Return
    Annualised Return (%)

                                                                                                                   Annualised
                                                                                                                                      +10.19%       +13.54%   +12.46%
                            12                                                                                     Volatility

                            10

                            8
                                                                                                                    Tracker Funds
                            6
                                                                                                                       sit here

                            4

                            2
                                 9               11       13           15         17           19           21
                                                                 Volatility (%)

 Source: Data from FE Analytics based on the returns of the Institutional Income share class as at 31 May 2019.

                                                                                                                                                              6
Buffettology                                                    The ideal holding period of an investment is forever
Historically Low Correlation
   The Fund has historically shown a lower than average correlation to the top 5 largest funds in the IA UK All Companies sector

                                                                CFP - SDL UK
                                                                                                          Invesco - High   LF - Woodford     Lindsell Train - LF Liontrust - Special
                                                                  Buffettology     Halifax - UK Growth
                                        Over 3 Years                                                   Income (UK) Z Acc Equity Income C Acc Lindsell Train UK Situations I Inc TR
                                                              Institutional Inc TR     C TR in GB
                                                                                                            TR in GB         GBP in GB       Equity Acc in GB          in GB
                                                                      in GB

                                       CFP SDL UK
                                          Buffettology
                                                                                         0.57                0.62                0.53                0.59                0.75
                                    Institutional Inc TR in
                                              GB

                                    Halifax UK Growth
                                                                    0.57                                     0.89                0.78                0.80                0.90
                                        C TR in GB

                                    Invesco High Income
                                                                    0.62                 0.89                                    0.88                0.76                0.86
                                    (UK) Z Acc TR in GB

                                    LF Woodford Equity
                                    Income C Acc GBP in             0.53                 0.78                0.88                                    0.60                0.76
                                            GB

                                     Lindsell Train LF
                                     Lindsell Train UK              0.59                 0.80                0.76                0.60                                    0.86
                                     Equity Acc in GB

                                      Liontrust Special
                                    Situations I Inc TR in          0.75                 0.90                0.86                0.76                0.86
                                             GB

   Source: Data from FE based on the returns of the Institutional Income share class over 3 years as at 31 May 2019 (ex-Tracker Funds)

Buffettology                   To achieve superior performance you have to do things differently from the crowd                                                                        7
What is Buffettology Investing?
  Business Perspective Investing
  Long-term, there is a 100% correlation between the success of a business and its share price
  performance, the ideal holding period of an investment is forever.

                                        Bought at              Investment
        Excellent Businesses        Discounted Prices          Opportunity

  Key fundamental requirements:

        Enduring franchise with pricing power                 Strong free cash flow
         and growth potential                                  Robust balance sheet
        Predictable earnings                                  Strong senior management
        Higher return on capital and equity

Buffettology                                                                                     8
How is it achieved: The Filter
                      Initial Screen                                      Watch List                                            Business Perspective
                                                                                                                                     Investing

                                                                                                     Portfolio 25-35 Holdings
                                                        45-60 Companies
                            Growth Record
                                                                            Proprietary Model
      Universe 3000

                                                                                Analysis                                             Superior Business with
                              Profitability                                                                                          High Economic Worth
                                                                              Forecasting &
                                                                               Valuation
                           Return on Equity
                                                                                                                                       Long Term View
                                                                            Target Entry Level
                              Free Cash
                              Generation

Buffettology                                  Investing is most intelligent when it is most business-like                                            9
Economic Moats

                                            Patented                     People
                                           proprietary
                                           technology                    Skills

                                               Non-
                                             patented                Brand Power
                                            proprietary
                                            technology
                                                                                                 Games
                                                                                                Workshop

Buffettology   Great investment opportunities arise when excellent companies are affected by unusual circumstances   10
Patented                                                                                                                     Stock Example
      proprietary
      technology

                      Financial Performance                                                                       About Rotork

                                                                                     •   The market leading actuator manufacturer and flow control
                                                                                         company operating in any market where the flow of gases or
                                                                                         liquids needs to be controlled.
                                                                                     •   Rotork Site Services offers expertise for the design, installation and
                                                                                         commissioning of retrofitted valve actuators and control systems.
                                                                                     •   Target growth achieved through organic development and
                                                                                         acquisition.
                                                                                     •   Strong balance sheet and ongoing cash generation at 109%.

       Market Cap                 £2,462.7m
                                                                                                                               Date first bought:
       Sector                     Industrial Engineering                                      May 2015:                        8 June 2011
       Index                      UK Stock Market                                           10:1 share split                   Price when first bought:
                                                                                                                               166.8400

Source: Sanford DeLand as at 31/05/19. Price shown is a price from the month the stock was added to the portfolio.
Past performance is not a guide to future performance; the value of an investment and income from it can go down as well as up.

Buffettology                                                                                                                                                  11
Non-
        patented
       proprietary
                                                                                                                                   Stock Example
       technology

                      Financial Performance                                                                      About Bioventix

                                                                                       •    Monoclonal antibodies harvested from sheep.
                                                                                       •    Used in diagnostic blood test assays, e.g. Vitamin D deficiency,
                                                                                            cardiac arrest.
                                                                                       •    Annuity-type business model with all R&D expensed as incurred.
                                                                                       •    Moat comes from regulatory process.
                                                                                       •    High margins, high return on equity and excellent cash generation.
                                                                                       •    Does not need cash for reinvestment so pays it out as dividends.

       Market Cap         £190.0m
       Sector             Pharmaceuticals & Biotechnology                                                                     Date first bought:
       Index              UK Stock Market                                                                                     3 December 2014
                                                                                                                              Price when first bought:
                                                                                                                              712.1300

Source: Sanford DeLand as at 31/05/19. Price shown is a price from the month the stock was added to the portfolio.
Past performance is not a guide to future performance; the value of an investment and income from it can go down as well as up.

Buffettology                                                                                                                                                   12
People
                                                                                                                                  Stock Example
     Skills

                       Financial Performance                                                                About RWS Holdings

                                                                                      •   The UK’s leading patent and commercial translations business with
                                                                                          a roster of large multinational clients located in Europe and the US.
                                                                                      •   Unique skill set with translators being graduates in both linguistics
                                                                                          and (usually) a scientific specialisation.
                                                                                      •   Strong and unbroken sales, earnings and dividend record going
                                                                                          back to flotation in 2004. Achieved through a combination of
                                                                                          organic growth and bolt-on acquisitions.
                                                                                      •   Consistent converter of 100% of earnings into free cash and high
                                                                                          teens returns on equity.

       Market Cap          £1,679.6m
       Sector              Support Services                                                                                  Date first bought:
       Index               UK Stock Market                                                                                   12 April 2011
                                                                                                                             Price when first bought:
                                                                                                                             80.0000

Source: Sanford DeLand as at 31/05/19. Price shown is a price from the month the stock was added to the portfolio.
Past performance is not a guide to future performance; the value of an investment and income from it can go down as well as up.

Buffettology                                                                                                                                                13
Brand Power
                     Games Workshop                                                                                               Stock Example

                      Financial Performance                                                          About Games Workshop Group

                                                                                       •   The largest and the most successful hobby miniatures company
                                                                                           in the world.
                                                                                       •   Their major brands are Warhammer and Warhammer 40,000
                                                                                           with products sold through their chain of over 400 retail stores
                                                                                           internationally.
                                                                                       •   Circa 70% of sales revenue generated from overseas, benefiting
                                                                                           from the continuing favourable impact of the weaker pound.
                                                                                       •   Surplus cash returned to owners, aiming to do so in ever
                                                                                           increasing amounts.
       Market Cap                £1,450.9m
       Sector                    Leisure Goods                                                                              Date first bought:
                                                                                                                            6 April 2011
       Index                     UK Stock Market
                                                                                                                            Price when first bought:
                                                                                                                            373.0000

Source: Sanford DeLand as at 31/05/19. Price shown is a price from the month the stock was added to the portfolio.
Past performance is not a guide to future performance; the value of an investment and income from it can go down as well as up.

Buffettology                                                                                                                                                  14
Sell discipline
                              F U N D A M E N T A L CHANG E

                                            BLACK SWAN        Sell:
                                                              Since launch, 15 company
                                                              investments completely sold & 3 taken
                                                              over

                                            OVERSIGHT         12 month Portfolio Turnover Rate:
                                                              3.0%

                                             SWITCH

Source: Sanford DeLand as at 31 May 2019.

Buffettology                                                                               15
Portfolio Snapshot

              Market Cap Breakdown                          Geographical Earnings Exposure                                            Sector Exposure
                                                                                                                                                             Financial Services 12.4%

                                                                                                                                                             Support Services 11.8%
                                                                                                                       14.1%          12.4%
              14.1%                                                                                                                                          Industrial Engineering 10.5%
                      19.0%                                          14.1%
     2.1%                                                                                                                                                    Pharmaceuticals & Biotechnology 8.9%
                                 Mega Cap>£10bn                                        UK 30.0%               2.5%
                                                      7.4%                     30.0%
                                                                                       Europe 15.6%         2.7%                                             Chemicals 6.8%
                                 Large Cap£1-10bn           7.6%                                                                                     11.8%
                                 Mid Cap£500m - £1bn4.9%                                                   2.8%                                              Travel & Leisure 6.3%
                                                                                       Americas 25.6%
   17.6%                                                   4.6%
                                 Small Cap£100-500m                                    Asia-Pacific 4.6%   5.0%                                              Food & Beverages 6.0%
                                 Micro Cap
Conclusion

                                                   Track Record                           Low volatility, high
                                                    +108.07%                                total and risk-
                                                   Over 5 years*                          adjusted returns*

                                Disciplined,                             Proprietary                             Low correlation
                              patient, thorough                                                                    to top asset
                                   process
                                                                           model                                     raisers*

 Source: *Data from FE based on the returns of the Institutional Income share class to 31 May 2019.
 All performance stated has been calculated as net. Past performance is not a guide to future performance; the value of an investment and income from
 it can go down as well as up.

Buffettology                                                                                                                                            17
How To Invest

    Share Classes and Type of Shares         General       Institutional   Institutional   Shares may be bought directly from Castlefield Fund Partners or through a
                                             Income        Income          Accumulation    professional adviser or other intermediary, application forms may be obtained
                                             Shares        Shares          Shares          from Castlefield.
    Investment Adviser’s Annual Management   1.5%          1.0%            1.0%
    Fee
    ACD’s Annual Management Fee              0.2%          0.2%            0.2%                  Postal Application      8th Floor,
                                                                                                                         111 Piccadilly,
    OCF                                      ~1.73%        ~1.23%          ~1.23%                                        Manchester,
                                                                                                                         M1 2HY
    Minimum Initial Investment (Waived via   £500          £250,000        £250,000
    platforms)                                                                                   Telephone               0161 233 4890

    Minimum Holding                          £500          £250,000        £250,000

    Minimum Top Up                           £100          £10,000         £10,000

    Minimum Regular Savings Plan             £50 per       Not available   Not available   The dealing office is normally open from 9.00 a.m. to 5.30 p.m. (London time)
                                             month                                         on each Dealing Day to receive requests for the purchase, sale or conversion of
                                                                                           Shares.
    ISIN Code                                GB00B3QQF     GB00BKJ9C       GB00BFOL
                                                                                           Valid applications to purchase shares received before the Valuation Point on a
                                             J66           676             DZ31
                                                                                           Business Day will be processed at the Share price calculated at that Valuation
    Dividend Frequency                       Half Yearly   Half Yearly     Half Yearly     Point.
    SIPP/SSAS/ Offshore Bond Eligible        Yes           Yes             Yes
                                                                                           Settlement is due within four business days of the Valuation Point.
                                                                                           The initial purchase must, at the discretion of Castlefield, be accompanied by an
    ISA/ Regular Savings Eligible            Yes           Yes             Yes             application form.
                                                                                           The current Valuation Point is 12.00 noon London time on each Dealing Day.

Buffettology                                                                                                                                                    18
Availability

               Platforms             Approved   Platforms        Approved

               Ascentric                       AXA Elevate          
               Aviva                           All Funds Bank       
               CoFunds                         Transact             
               FNZ                             Alliance Trust       
               Hargreaves Lansdown             Selftrade            
               Novia                           Old Mutual           
               Nucleus                         Aegon                
               James Hay                       Pershing             
               Fidelity                        Standard Life        
               Seven Investment
               Management                      AJ Bell              

               Zurich                    

Buffettology                                                                       19
Contact Details

                                                             For further information or to request a copy of the
                                                             prospectus, please contact our team at Candlewick
                                                             Capital:

                                                                         020 7071 3930
                                                                     info@sanford-deland.uk
                                                                    www.candlewickcapital.com

Candlewick Capital is a division of LGBR Capital London Limited. LGBR Capital London Limited is an Appointed Representative of Mirabella Advisers LLP, which is authorised and regulated by the Financial
Conduct Authority.

Buffettology                                                                                                                                                                                   20
Further Important Information
        You should not rely on any information or opinions contained in this document in making an investment or other decision but should obtain
        appropriate and specific professional advice of your own. Nothing contained in this document constitutes or should be construed to constitute
        investment, legal, tax or other advice. The information supplied is not and in no way should be construed to constitute a recommendation with respect
        to the purchase or sale of any investment. In particular:
        • Market price may not be fully reflected in underlying net asset value. The value of the investment may go down as well as up and an investor may
          not get back the full amount invested. Any shares held (even if listed on the London Stock Exchange’s market for listed securities) are likely to be
          illiquid and shareholders may have difficulty in selling them. Units in funds may also be illiquid in certain circumstances. Past performance is not
          necessarily a guide to future performance.
        • There can be no guarantee that investment objectives can be achieved. Portfolio investments in smaller companies typically involves a higher degree
          of risk. There are potential difficulties in acquiring, valuing and disposing of underlying investments and information for determining the value or
          risks may also not be available. The value of the portfolio companies depends on stock market conditions.
        • Existing tax rules and legislation may change over time and changes can be retrospective. The value of any tax reliefs depends on the personal
          circumstances of the investors, who should consult their own tax advisers before making an investment.
        Whilst the contents of this document are provided in good faith for information purposes only, no representation or warranty, express or implied is
        given by Castlefield or by any of its partners, members or employees as to its accuracy or completeness or that it is up to date, and it should not be
        relied on as such.
        To the fullest extent allowed by law and the rules and regulations of the FCA, Castlefield and its partners, members and employees shall not be liable,
        whether in contract, tort (including negligence) or otherwise howsoever, for any losses, damages, costs or expenses of whatever nature (including
        (without limitation) any consequential, indirect or unforeseeable loss or loss of bargain, opportunity or profit) incurred or suffered by you or any third
        party arising out of or in connection with the use of the contents of this document.
        Compliance Code: TNBUFFPRESAY/070619.

Buffettology                                                                                                                                                  21
Appendix 1. Discrete Performance

       The Fund has positive returns for every full calendaryear:

                                                                                                                                  Since
                                                                                                                               Inception
                                                    2018       2017       2016       2015       2014       2013       2012     Mar 2011
                                                                                                                                 to May
                                                                                                                                  2019

               CFP SDL UK Buffettology Fund
                                                    0.4        25.6       11.9        27.9       1.8       36.0       34.3      239.9
               Institutional Inc TR in GB
               Sector : IA UK All CompaniesTR
                                                    -11.2      14.0       10.8        4.9        0.6       26.2       15.1       76.0
               in GB
               Index : UK Stock Market TR           -9.5       13.1       16.8        1.0        1.2       20.8       12.3       72.6

       Source: Data from FE based on the returns of the Institutional Income share class to 31 May 2019.
       All performance stated has been calculated as net.
       Past performance is not a guide to future performance; the value of an investment and income from it can go down as well as up.

Buffettology                                                                                                                                 22
Appendix 2. Top Quartile Fund Ratios

                                                             CFP SDL UK Buffettology      Sector : IA UK All Companies
                                              Over 5 Years                                                               Quartile
                                                             Institutional Inc TR in GB              TR in GB

                                    Alpha                              11.58                          0.00                  1
                                    Beta                               0.72                           1.00                  1
                                    Downside Risk                      11.31                         11.79                  1
                                    Info Ratio Rel.                    1.37                           0.00                  1
                                    Jensens Alpha                      10.50                          0.00                  1
                                    Max Drawdown                       -11.12                        -16.18                 1
                                    Max Gain                           11.00                         11.29                  4
                                    Max Loss                           -7.70                         -9.08                  1
                                    Negative Periods                   99.00                        116.00                  1
                                    Positive Periods                  161.00                        144.00                  1
                                    r2                                 0.60                           1.00                  4
                                    Relative Return                    9.92                           0.00                  1
                                    Return                             15.53                          5.11                  1
                                    Sharpe                             1.16                           0.14                  1
                                    Sortino                            1.06                           0.14                  1
                                    Tracking Error                     7.26                           0.00                  4
                                    Treynor                            16.78                          1.61                  1
                                    Volatility                         10.36                         11.22                  1

  Source: Data from FE based on the returns of the Institutional share class to 31 May 2019.

Buffettology                                      Margin of Safety – the 3 most important words in investing                                         23
You can also read