GDI PROPERTY GROUP Half year results presentation - 22 February 2021 - HotCopper
←
→
Page content transcription
If your browser does not render page correctly, please read the page content below
GDI PROPERTY GROUP
Half year results presentation

                                 22 February 2021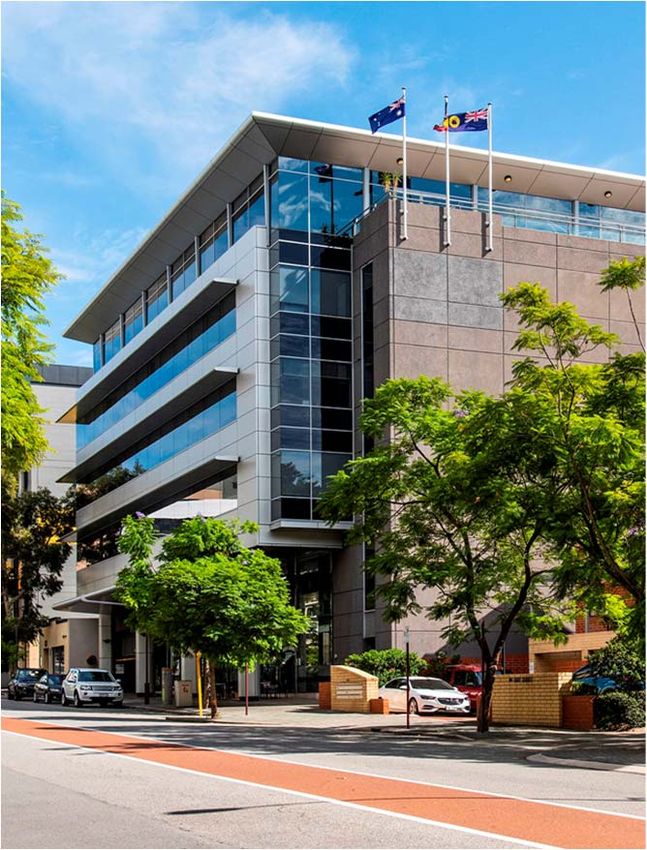
Disclaimer
     This presentation has been prepared and issued by GDI Property Group Limited (ACN 166 479 189) and GDI Funds Management Limited (ABN 34 107 354 003, AFSL Number 253 142) as
     responsible entity of GDI Property Trust (ARSN 166 598 161). Shares in GDI Property Group Limited are stapled to units in GDI Property Trust, which with their controlled entities, form GDI
     Property Group (ASX:GDI). This is not an offer of securities for subscription or sale and is not financial product advice.

     Information in this presentation, including, without limitation, any forward-looking statements or opinions (the Information) may be subject to change without notice. To the extent permitted by
     law, GDI Property Group, GDI Property Group Limited, GDI Funds Management Limited and their officers, employees and advisers do not make any representation or warranty, express or
     implied, as to the currency, accuracy, reliability or completeness of the Information and disclaim all responsibility and liability for it (including, without limitation, liability for negligence). Actual
     results may differ materially from those predicted or implied by any forward-looking statements for a range of reasons outside the control of the relevant parties. You should note that returns
     from all investments may fluctuate and that past performance is not necessarily a guide to future performance.

     The Information in this presentation should not be considered to be comprehensive or to comprise all the information which a GDI Property Group security holder or potential investor may
     require in order to determine whether to deal in GDI Property Group securities. Whilst every effort is made to provide accurate and completion information, GDI Property Group does not
     represent or warrant that the information in this presentation is free from errors or omissions, is complete or is suitable for your intended use. In particular, no representation or warranty is given
     as to the accuracy, likelihood of achievement or reasonableness of any forecasts, prospects or returns contained in the information – such material is, by its nature, subject to significant
     uncertainties and contingencies. This presentation does not take into account the financial situation, investment objectives and particular needs of any particular person. Any prospective
     investor or other security holder must satisfy itself by its own investigation and by undertaking all necessary searches and enquiries as to the accuracy and comprehensiveness of all Information
     contained in this presentation.

     The repayment and performance of an investment in GDI Property Group is not guaranteed by GDI Property Group Limited or GDI Funds Management Limited or any of their related bodies
     corporate or any other person or organisation.

     An investment in GDI Property Group is subject to investment risk, including possible delays in repayment, the loss of income and the loss of the amount invested.

LINKING EQUITY TO PERFORMANCE                                                                                                                                                                                       1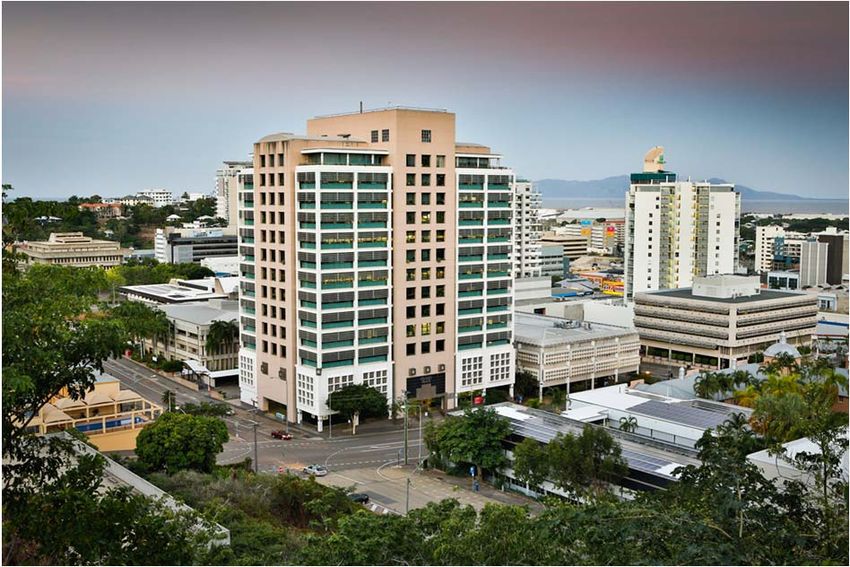
A solid start to FY21 – Development and capital markets
WS2, Perth 1 Mill Street, Perth 180 Hay Street, Perth
Architectural drawings only Architectural drawing only
DA approved DA lodged with planning authority for Settled July 2020, with an immediate uplift
approval in value from the purchase price (+$2.2
million)
Construction targeted to commence mid 2021
Demolition to commence prior to 30 June
2021, subject to relevant approvals Capex programme well underway
Completion in late 2022
Seeking tenant precommitment(s) Numerous inspections to potential all of
property and multi-floor tenants
LINKING EQUITY TO PERFORMANCE 2
A solid start to FY21 - Leasing
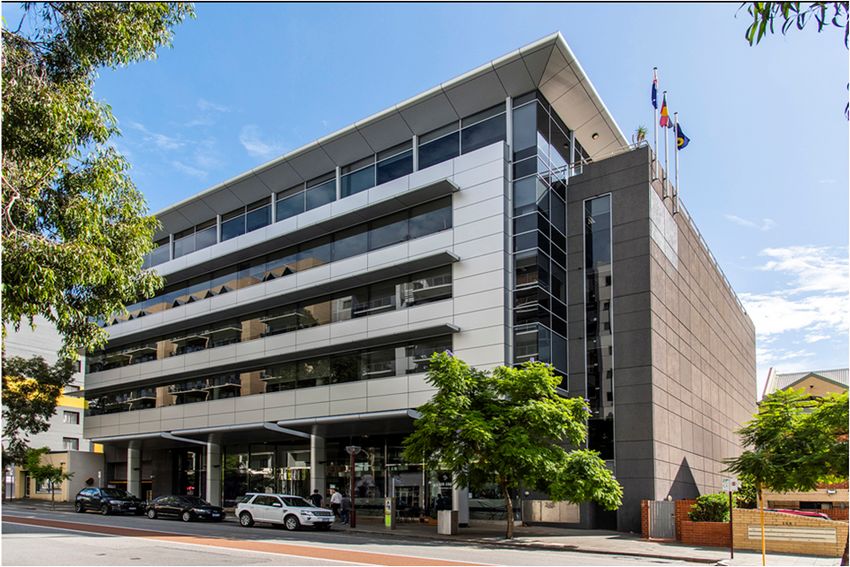
Westralia Square, Perth 50 Cavill Ave, Surfers Paradise
Level 11 leased to Cash Converters for Major tenant extended for five years and
10 years is currently negotiating to double its
Level 12 under a heads of agreement occupancy
for a new 6.5 year lease commencing
early 2022
Strong interest in level 7, which when
leased only six levels (13 – 18) vacant
Mill Green, Perth Funds Management
Two new leases at 197 St Georges Two new leases of the peripheral sites at
Terrace 6 Sunray Drive, Innaloo (GDI No. 43
Level 13 leased to Laing O’Rourke Property Trust)
for five years 1 February 2021 New 3-year lease for 816sqm to Services
Suite on level 10 (209sqm) leased Australia at Stanley Place (GDI No. 42
for five years commencing 1 June Office Trust) with interest in most of the
2021 vacant space
Momentum rebuilding at 5 Mill Street New 8-year lease to Lycopodium
commencing 1 July 2020 for 4,628sqm at
1 Adelaide Terrace, Perth (GDI No. 36
Perth CBD Office Trust)
LINKING EQUITY TO PERFORMANCE 3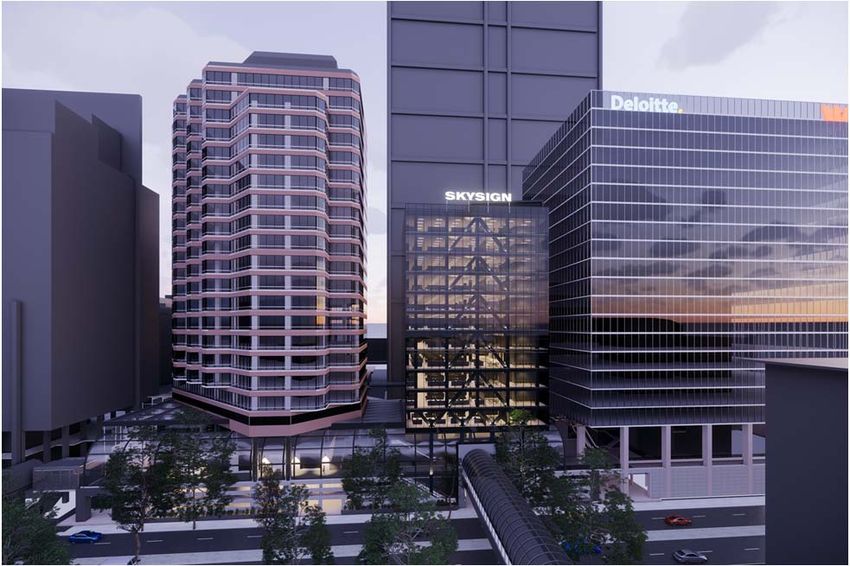
But still a lot more to do…
Leasing
Significant leasing opportunities remain at
1 Adelaide Terrace, Perth (GDI No. 36 Perth CBD Trust)
180 Hay Street, Perth
Westralia Square, Perth
235 Stanley Street, Townsville (GDI No. 42 Office Trust)
5 Mill Street, Perth
Capital markets
Continue to review acquisition opportunities for both the Property
business and Funds Management business, focusing on markets
demonstrating the strongest near to medium term growth prospects
180 Hay Street, Perth
Accelerate the sell down of the strata suites at
251 Adelaide Terrace, Perth (GDI No. 29 GDI Office Fund)
10 Market Street, Brisbane (GDI No. 33 Brisbane CBD Trust)
Monitor opportunities to exit 50 Cavill Avenue, Surfers Paradise
Capex and development
Progress the development opportunities at WS2 and 1 Mill Street,
Perth
Complete/progress the capex works programmes at
Westralia Square, Perth
180 Hay Street, Perth
235 Stanley Place, Townsville
LINKING EQUITY TO PERFORMANCE 4
FINANCIAL RESULTS

50 CAVILLEQUITY
LINKING   AVE, SURFERS PARADISE
                TO PERFORMANCE                        5
Summary
$0.03 decrease due mainly to:
NTA – $1.27 per security Reduction in value of 197 St Georges Terrace ($-21.0
million)
Maintenance of distribution during leasing transition period
FFO of 2.6 cents per security Significantly lower per security during leasing transition period
Maintained distribution at prior year levels
Distribution of 3.875 cents per security
Intend to pay a further 3.875 cents per security for second half1
1. Subject to no material change in circumstances or unforeseen events and noting that we expect a proportion of any cash distribution for the second half will be paid out of capital.
LINKING EQUITY TO PERFORMANCE 6
Contributors to FFO and AFFO
Dec 20 Dec 19 Property Division FFO significantly lower than previous corresponding
period
$’000 $’000
Wrote off all rent waived in the period due to COVID-19 ($215,000)
Property Division FFO 16,253 27,033
– Total written off due to COVID-19 now $733,000 ($518,000 previously
Funds Management FFO 3,651 2,008 disclosed at 30 June 2020)
Other 79 14
– Equates to 1.3% of property income in 2020
Total 19,983 29,054
At Westralia Square, departure of UGL, transition of WAPOL from
upper to lower levels and departure of Dept. of Justice meant FFO at
Less: Westralia Square was $9.6 million lower than the previous
corresponding period
Net interest expense (1,840) (955)
At Mill Green, FFO was slightly lower, largely due to the lower
Corporate and administration expenses (4,047) (4,286)
occupancy at 5 Mill Street
Other 157 (3)
FFO at 50 Cavill Avenue unchanged on the previously corresponding
Total FFO 14,252 23,811 period
Funds Management FFO of $3.7 million (Dec 19: $2.0 million) includes:
Maintenance capex (397) (2,153) Distributions from GDI No. 42 Office Trust ($0.4 million)
Incentives and leasing fees paid (5,562) (3,151) Distribution from GDI No. 46 Property Trust ($1.4 million)
Income tax expense / (benefit) (157) 3 Net interest expense higher than Dec 19 due to higher amount of drawn
Total AFFO 8,137 18,510 debt, notwithstanding the lower interest costs
Corporate and administration expenses in line with Dec 19, and includes a
$500,000 accrual for FY21 bonuses
Incentives and leasing fees paid relate mainly to the WAPOL lease at
Westralia Square, and to various tenants at 197 St Georges Terrace
LINKING EQUITY TO PERFORMANCE 7
Balance sheet remains in a strong position
                                                                                                                           Dec-20    Jun-20
   Pro forma for post balance sheet events                                                                                  $'000     $'000
   Current assets
   Cash and cash equivalents                                                                                                 7,106    10,100
   Non-current assets held for sale                                                                                        102,156   102,240
   Other assets                                                                                                             18,865    14,500
   Total current assets                                        GDI No. 42 Office Trust (Stanley Place) $51.50 million      128,126   126,841
                                                              GDI No. 46 Property Trust (IDOM Portfolio) $105.85 million
   Non-current assets
   Investment properties                                                                                                   843,681   822,500
   Other non-current assets                                                                                                  2,103       724
   Intangible assets                                                                                                        18,110    18,110
   Total non-current assets                                                                                                863,895   841,685
   Total assets                                                                                                            992,021   968,525
   Current liabilities
   Trade and other payables                                                                                                 26,787    25,520
   Other current liabilities                                                                                                   737       405
   Total current liabilities                                            GDI No. 42 Office Trust $10.00 million              27,524    25,926
                                                                       GDI No. 46 Property Trust $30.00 million
   Non-current liabilities
   Borrowings                                                                                                              192,428   159,423
   Derivative financial instruments                                                                                            447       326
   Other non-current liabilities                                                                                             1,199       206
   Total non-current liabilities                                                                                           194,074   159,954
   Total liabilities                                                                                                       221,598   185,880
   Net assets                                                                                                              770,423   782,645
   Equity                                                       GDI No. 42 Office Trust and GDI No. 46 Property Trust
   Equity attributed to holders of stapled securities                             External Investors                       706,618   721,403
   Equity attributable to external non-controlling interest                                                                 63,805    61,242
   Total equity                                                                                                            770,423   782,645

LINKING EQUITY TO PERFORMANCE                                                                                                              8
Debt profile and interest rate hedging
As at 31 December 2020, drawn debt on the Principal Facility of $152.8 Board hedging policy gives management more flexibility around hedging,
million and undrawn debt of $52.2 million particularly when drawn debt isPROPERTY PORTFOLIO
MILL GREEN,
LINKING PERTH
EQUITY TO PERFORMANCE 10Elizabeth Quay
Treasury
11
Exchange Plaza
St Martins Tower
Allendale Square
BCG Centre
100 SGT
108 SGT
Quadrant
140 SGT
Brookfield Place 2
Convention Centre
BHP
Alluvion
Forrest Centre
225 SGT
240 St Georges Terrace
Bishop C
Perth market
LINKING EQUITY TO PERFORMANCE
QV1 (Chevron)
New WoodsidePortfolio strategically weighted towards Perth
WA Consumer sentiment index at 10-year highs Private infrastructure projects pipeline by state
120 250
110
200
100
AUD Billions
90 150
80
70 100
60
50
Jan-17
Mar-17
May-17
Jul-17
Sep-17
Nov-17
Jan-18
Mar-18
May-18
Jul-18
Sep-18
Nov-18
Jan-19
Mar-19
May-19
Jul-19
Sep-19
Nov-19
Jan-20
Mar-20
May-20
Jul-20
Sep-20
Nov-20
0
WA consumer sentiment index NSW VIC WA SA QLD
Source: JLL Research, ABS Source: JLL Research, ABS
National, state & territory job ad growth/decline comparing Jan 21 vs Jan 20 Perth CBD Net Absorption vs White Collar Employment Growth
27.8%
150,000 10%
8%
100,000
6%
50,000 4%
16.3%
2%
26.5% - 0%
-2%
-50,000
‐4.8% -4%
-100,000 -6%
24.8%
2000
2002
2004
2006
2008
2010
2012
2014
2016
2018
2020
2022
2024
2026
2028
‐1.4%
1.8% Perth CBD Net Absorption (LHS)
42.0%
Perth CBD White Collar Employment Growth % (RHS)
Source: SEEK Employment Report - 2021 Source: JLL Research
LINKING EQUITY TO PERFORMANCE 12Portfolio overview
Westralia Square, Perth 197 St Georges Terrace, 5 Mill Street, Perth 1 Mill Street, Perth
Perth
Valuation date 31 December 2020 31 December 2020 31 December 2020 31 December 2020
Valuation $345.00 million $230.00 million $56.00 million $40.00 million
Carrying value $345.00 million $230.00 million $56.00 million $40.00 million
Valuation movement +$17.50 million -$21.00 million -$2.5 million +$6.5 million
Capitalisation rate 6.00% 6.75% 7.00% 7.75%
Discount rate 6.75% 7.00% 7.25% 7.5%
NLA (sqm) 32,598 26,216 7,148 6.649
Occupancy1 (% of NLA) 63% 89% 68% 0%
WALE (years) 5.75 years 2.65 years 2.58 years N/A
Major tenants (sqm / expiry) WAPOL (12,289sqm, FY26) AMEC (7,341sqm, FY23) Knightcorp (1,044sqm, FY25) N/A
BDM (1,833sqm, FY27) Jacobs (3,442, FY22) N/A
1. As at 22 February 2021 and including heads of agreement.
LINKING EQUITY TO PERFORMANCE 13Portfolio overview
50 Cavill Ave, Surfers 180 Hay Street, Perth IDOM Portfolio, Perth 235 Stanley Place, Townsville
Paradise
Valuation Date 30 June 2020 31 July 2020 31 December 2020 31 December 2020
Valuation $101.00 million $15.00 million $105.85 million $51.5 million
Carrying Value $100.92 million $15.33 million $105.85 million $51.5 million
Valuation movement N/A N/A +$7.85 million -$2.0 million
Capitalisation Rate 7.00% 8.00% 7.24%2 8.00%
Discount Rate 7.25% 8.25% 7.50%2 8.00%
NLA (sqm) 16,625sqm 4,925sqm 13,786
Occupancy1 (% of NLA) 91% 0% 100% 58%
WALE (years) 2.73 years N/A 9.92 years 4.92 years
Major Tenants Mantra (2,771sqm, FY24) N/A Buick Holdings Pty Limited3 DHS (5,460sqm, FY27, FY24)
Ray White (1,129sqm, FY22) NDIS (1,161sqm, FY26)
1. As at 22 February 2021 and including heads of agreement.
2. Weighted average.
3. The tenant is either Buick Holdings Pty Limited (Buick), or wholly owned subsidiaries of Buick. Buick is owned 67% by IDOM Automotive Group Pty Limited, a wholly owned subsidiary of IDOM Inc, an entity listed on the
Tokyo Stock Exchange and 33% by entities associated with the DiVirgilio family.
LINKING EQUITY TO PERFORMANCE 141 Mill Street, Perth
Development application submitted for the construction of a
new 45,000sqm NLA office building including precinct
upgrade to 5 Mill Street and 197 St Georges Terrace
Demolition approval granted in December 2020. Demolition
works anticipated to commence in first half of 2021 which
will substantially improve speed to market of the office
building
Design development progressing to assist with market
engagement for key tenants
Architectural drawings only
LINKING EQUITY TO PERFORMANCE 15WS2
Development Approval granted for new office building on
surplus land
Development scope includes for new 9,000sqm NLA
timber/steel hybrid office building (WS2) and full precinct public
realm upgrade to existing office building (WS1)
Construction anticipated to commence around June 2021
Total forecast costs of $63.0 million, including precinct works
but excluding incentives and finance costs
Architectural drawings only
LINKING EQUITY TO PERFORMANCE 16FUNDS MANAGEMENT
235 STANLEY
LINKING STREET,
EQUITY TOWNSVILLE
TO PERFORMANCE 17Funds Management business
GDI No. 29 Office Trust GDI No. 42 Office Trust
Originally a two-asset fund, now only holding 10 strata Originally a two-asset fund with similar asset
suites in 251 Adelaide Terrace management plans
100 of the 112 strata suites sold with investors receiving Now only holding 235 Stanley Street, Townsville
$1.30 in capital back in addition to income distributions Opportunity to add significant value on releasing the
Looking for short term leasing of the remaining 10 suites vacancy created by the departure of the ATO in
as the Perth strata market reawakens August 2020
GDI holds an ownership interest of 43.68%
GDI No. 33 Brisbane CBD Office Trust GDI No. 43 Property Trust
Bought 10 Market Street, Brisbane in 2010 and decided Owns 6 Sunray Drive, Innaloo, home to Perth’s only
to strata it in 2012 IKEA store
Approximately 50% of NLA sold or in process of being IKEA’s lease expires in February 2023, with IKEA
sold having 3 x 5-year options
Signs of improvement in the Brisbane strata market Annual CPI rent reviews, with market reviews at expiry
after several years of price pressure and at each option date
Anticipate an acceleration of sales at improved pricing Strategically located site between Sterling Station and
levels Westfield Innaloo
Potentially significant upside on an alternate use basis
GDI No. 36 Perth CBD Office Trust GDI No. 46 Property Trust
Owns the iconic 1 Adelaide Terrace, Perth Owns 17 Perth metropolitan properties occupied by
Investors had been receiving +10% distribution yield on high profile car dealerships and service centres
their initial investment with units valued at $1.11 Long WALE of over 10 years, with the opportunity to
Levels 6 and 7 (and part Level 4) vacancy creates an add value through land amalgamations, capex and
opportunity to add value by releasing and extending the alternate uses (STCA)
WALE GDI holds an ownership interest of 47.19%
GDI No. 38 Diversified Property Trust
Originally a seven-asset portfolio purchased from UGL
on a sale and leaseback basis with four of those assets
now sold
Investors have/are
received $0.605 of their initial capital
receiving +15% distribution yield on their remaining
$0.395 of initial capital
a current unit value of $0.79
Significant upside in Broadmeadow site on an
alternative use basis
LINKING EQUITY TO PERFORMANCE 18APPENDIX
WESTRALIA SQ ‐ TO
LINKING EQUITY 141PERFORMANCE
ST GEORGES TCE 19Profit or Loss
GDI Trust
Dec 20 Dec 19 Dec 20 Dec 19
$'000 $'000 $'000 $'000
Revenue from ordinary activities
Property income 24,606 35,103 24,709 35,123
Funds management income 1,322 1,064 - -
Interest revenue 53 45 49 40
Other income 56 - 18 -
Total revenue from ordinary activities 26,037 36,212 24,776 35,162
Net fair value gain/(loss) on interest rate swaps (121) - (121) -
Net fair value gain/(loss) on investment property 2,318 37,949 2,318 37,949
Total income 28,234 74,161 26,973 73,112
Expenses
Property expenses 10,356 9,095 10,356 9,095
Finance costs 2,689 1,232 2,698 1,373
Corporate and administration expenses 4,047 4,286 2,221 3,208
Acquisition expenses 823 - 797 -
Total expenses 17,915 14,613 16,072 13,677
Profit before tax 10,319 59,548 10,902 59,434
Income tax benefit/(expense) 157 (3) - -
Net profit from continuing operations 10,476 59,546 10,902 59,434
Other comprehensive income - - - -
Total comprehensive income for the year 10,476 59,546 10,902 59,434
Profit and total comprehensive income attributable to:
Company shareholders (426) 111 - -
Trust unitholders 6,236 58,278 6,236 58,278
Profit and total comprehensive income attributable to stapled securityholders 5,811 58,389 6,236 58,278
External non-controlling interests 4,665 1,156 4,665 1,156
Profit after tax from continuing operations 10,476 59,546 10,902 59,434
LINKING EQUITY TO PERFORMANCE 20NPAT to AFFO
GDI
31 December 2020 31 December 2019
$’000 $'000
Total comprehensive income for the period 10,476 59,546
Acquisition expenses and discontinued acquisition 823 -
Contribution resulting from consolidated trusts (4,295) (2,297)
Distributions / funds management fees received from consolidated trusts 2,190 943
Straight lining adjustments 497 457
Amortisation of incentives and leasing costs 6,410 3,026
Amortisation of loan establishment costs and depreciation 348 85
Net fair value gain on investment property (2,318) (37,949)
Net fair value (gain) / loss on interest rate swaps 121 -
Funds From Operations 14,252 23,811
LINKING EQUITY TO PERFORMANCE 21Property by property information
Dec 20 Dec 19 Dec 20
Property $m $m $m
Incentives
Maintenance and lease
IFRS NPI2 FFO IFRS NPI2 FFO Capex spent capex spent costs
1 Mill Street
5 Mill Street 0.5
197 St Georges Terrace 0.3 1.9
Mill Green, Perth 6.2 8.9 7.6 10.0 0.3 2.3
Westralia Square, Perth 0.6 4.0 13.3 13.6 4.2 - 2.8
50 Cavill Avenue, Surfers Paradise 2.7 3.5 2.8 3.5 0.3 - 0.5
180 Hay Street, Perth 0.2 0.2 - - 0.5 - -
Distributions from consolidated funds - 1.8 - 0.8 - - -
Funds Management fees 1.3 1.7 1.1 1.2 - - -
1. “As is” is defined as contracted revenues only and does not include any new leasing or lease renewals and is subject to no material change in circumstances or unforeseen events.
2. IFRS NPI is the net property income of each asset prior to any revaluation adjustments.
LINKING EQUITY TO PERFORMANCE 22LINKING EQUITY TO PERFORMANCE 23
You can also read