Distributional Effects as One of the Main Causes of the 'Great Recession' Philip Arestis University of Cambridge
←
→
Page content transcription
If your browser does not render page correctly, please read the page content below
Distributional Effects as One of the
Main Causes of the ‘Great Recession’

          Philip Arestis
      University of Cambridge
Introduction We discuss the origins of the ‘great recession’ but emphasise the ‘distributional effects’ as one of the main features of it; We distinguish between main factors and contributory factors: Main Factors: Three Features: Distributional Effects; Financial Liberalisation; Financial Innovation;
Introduction Contributory Factors: Three Features: International Imbalances; Monetary Policy; Role of Credit Rating Agencies; We also touch upon: Economic Policy Implications; and finally: Summary and Conclusions
Main Factors: Distributional Effects Feature 1: Distributional Effects The steady but sharp rise in inequality, especially in the US, but elsewhere, too, is an important feature; Galbraith (2012a) suggests that “inequality was the heart of the financial crisis. The crisis was about the terms of credit between the wealthy and everyone else, as mediated by mortgage companies, banks, ratings agencies, investment banks, government sponsored enterprises, and the derivatives markets” (p. 4);
Main Factors: Distributional Effects In the US “The top 1 per cent of households accounted for only 8.9 percent of income in 1976, but this share grew to 23.5 percent of the total income generated in the United States by 2007” (Rajan, 2010, p. 8); Also, “The richest 1 percent of American households owned about 35 percent of national wealth in 2006-2007, the last year for which statistics are available, a far greater share than in most other developed countries” (Wade, 2012, p. 2);
Main Factors: Distributional Effects Evidence by Atkinson et al. (2011) also shows that the share of US total income going to top income groups had risen dramatically prior to 2007; The top pre-tax decile income share reached almost 50% by 2007, the highest level on record; The share of an even wealthier group – the top 0.1% - has more than quadrupled from 2.6% to 12.3% over the period 1976 to 2007;
Main Factors: Distributional Effects Real wages had fallen even behind productivity well before the onset of the ‘great recession’ (we may note that in the US wages constitute the most important component of incomes); The declining wage and rising profits share were compounded by the increasing concentration of earnings at the top, especially in the financial sector;
Main Factors: Distributional Effects Figures 1 to 3 make the case; Figure 1 makes the case of the increasing US shortfall of the Real Wage Rate from productivity (RWR) since the early 1970s (Jan. 1968=100); and increasing unemployment;
Ja
n-
4
-25%
-20%
-15%
-10%
-5%
0%
5%
10%
Ja 7
n-
4
Ja 9
n-
5
Ja 1
n-
5
Ja 3
n-
5
Ja 5
n-
5
Ja 7
n-
5
Ja 9
n-
6
Ja 1
n-
6
Ja 3
n-
6
Ja 5
n-
6
Ja 7
n-
6
Ja 9
n-
7
Ja 1
n-
7
Ja 3
n-
7
Ja 5
n-
7
Ja 7
n-
7
Ja 9
n-
8
Ja 1
Percent Dev of Real Wage Rate from Productivity JAN 68=100
n-
8
Ja 3
n-
8
Ja 5
n-
8
Ja 7
n-
8
Ja 9
n-
9
Ja 1
n-
9
Ja 3
n-
9
Ja 5
n-
9
Ja 7
n-
9
Ja 9
n-
0
Ja 1
n-
0
Productivity and Unemployment
Ja 3
n-
0
Ja 5
n-
0
Unemployment % of Labour force (12-month lead)
Ja 7
n-
09
Figure 1: US Deviation of RWR from
0%
2%
4%
6%
8%
10%
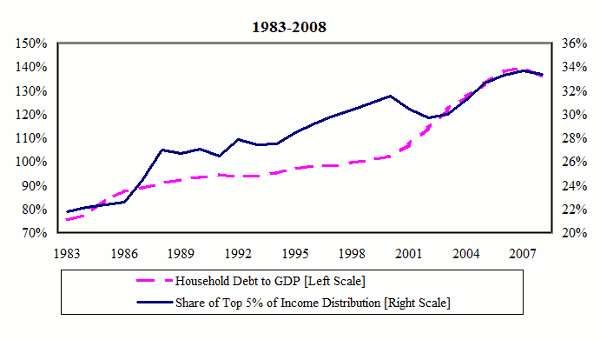
12%Main Factors: Distributional Effects Figure 2 plots the evolution of the share of the top 5% total income of households and household debt to GDP ratio over the period 1983-2008 (Kumhof and Rencière, 2010a); The income share of the top 5% increased from 22% in 1983 to 34% in 2007; During the same period, the ratio of household debt to GDP increased dramatically: it almost doubled between 1983 and 2008;
Figure 2: Share of US Top 5% Total
Income and Household Debt to GDP
Main Factors: Distributional Effects Figure 3 shows the share of profits in relation to income in the case of the US and of the rest of the world; It also shows the case of the financial sector;
Figure 3: US and Rest of the
World Profits as Percent of GDP
Main Factors: Distributional Effects We note that the bottom of profitability at the end of 2001 hit an all-time low; This may be the result of shifting production abroad, due to the increasing challenge of the US from other industrialised countries, such as Japan, Europe and China; It all gathered pace in the era of globalisation; However, the picture of profits is not shared by financial companies;
Main Factors: Distributional Effects The share of the financial sector to GDP almost doubled in size between 1981 and 2007, and more recently accounted for 8% of US GDP (Philippon, 2008); Between 1981 and 2007 the US financial sector as measured by the ratio of private credit to GDP grew from 90% to 210%; Also, a sharp, nearly six-fold increase occurred, in their profitability since 1982;
Main Factors: Distributional Effects Indeed, and over the same period, wages in the financial sector are higher than in other sectors, even after controlling for education (Philippon and Reshef, 2009); Financial sector relative wages, the ratio of the wage bill in the financial sector to its full- time-equivalent employment share, enjoyed a steep increase over the period mid-1980s to 2006;
Main Factors: Distributional Effects Similar but less pronounced financial shares are relevant in many other countries; Germany, China and the UK are three examples but many more can be cited; In Germany, and according to the OECD (2008), income inequality over the years 2000 to 2005 grew faster than in any other OECD country;
Main Factors: Distributional Effects In China the top 1% income share has gradually risen from 2.6% in 1986 to 5.9% in 2003; Also in China financial intermediary shares to GDP increased from 1.6% in 1980 to 5.4% in 2008 (Greenspan, 2010, p. 15).
Main Factors: Distributional Effects The then Chairman of the Financial Services Authority made the point in the case of the UK: “there has been a sharp rise in income differential between many employees in the financial sector and average incomes across the whole of the economy” (Turner, 2010);
Main Factors: Distributional Effects In 1997 the value of financial transactions was about fifteen times the world’s GDP; Currently it is almost seventy times (Wade, 2012); Such high concentration enables financial firms to influence and shape public policy in line with their interests; Even today, the power of Wall Street and the City of London remains largely intact despite the ‘great recession’;
Main Factors: Distributional Effects Examples such as the Dodd-Frank Act and Volcker rule in the United States and the Vickers report in the UK, make the point vividly; There are of course those who ignore distributional effects; The best example is the ‘US Financial Crisis Inquiry Commission’ report (January, 2011), where there is no mention of ‘inequality’ in its entire 662 pages.
Main Factors: Distributional Effects The distributional effects discussed so far have been greatly enhanced by attempts at financial liberalization in many countries around the world; Of particular importance for our purposes was the financial liberalization framework in the US, especially the repeal of the 1933 Glass- Steagall Act in 1999.
Main Factors: Distributional Effects Both the redistribution and the financial liberalization policies led to a period of financial engineering in the US, which spread worldwide, and eventually caused the ‘great recession’.
Main Factors: Financial Liberalisation Feature 2: Financial Liberalization US experienced financial liberalisation from around the mid-1970s; The apotheosis of the financial liberalization in the US, however, took place in 1999 with the repeal of the 1933 Glass-Steagall Act; The 1933 Glass-Steagall Act was designed to avoid the experience of the 1920s/1930s in terms of the conflict of interest between the commercial and the investment arms of large financial conglomerates (whereby the investment branch took high risk tolerance);
Main Factors: Financial Liberalisation The ultimate aim of the 1933 Glass-Steagall Act was to separate the activities of commercial banks and the risk-taking ‘investment or merchant’ banks along with strict regulation of the financial services industry; In effect the Glass-Steagall Act of 1933 broke up the most powerful banks; The goal was to avoid a repetition of the speculative, leveraged excesses of the 1920s/1930s;
Main Factors: Financial Liberalisation The repeal of the Act in 1999 enabled investment banks to branch into new activities; And it allowed commercial banks to encroach on the investment banks’ other traditional preserves; Not just commercial banks but also insurance and other companies, like the American International Group (AIG), were also involved in the encroaching.
Main Factors: Financial Innovation Feature 3: Financial Innovation The repeal of the 1933 Glass-Steagall Act in 1999 allowed the merging of commercial and investment banking; The merging enabled financial institutions to use risk management in their attempt to dispose off their loan portfolio; As a result “a greater willingness to supply credit to low-income households” emerged, “the impetus for which came … from the government“ (Rajan, 2010, p. 40);
Main Factors: Financial Innovation House prices kept rising between 1999 to 2007, they over than doubled according to the S&P/Case-Shiller house-price index (by 75 percent according to Federal Housing Administration, FHA); That enabled households to borrow against home equity they had build up; Those developments led to an important financial innovation;
Main Factors: Financial Innovation Financial institutions engineered a new activity, through the ‘shadow banking’ system, that relied on interlinked securities, the Collateralized Debt Obligations (CDOs), mainly emerging from and closely related to the subprime mortgage market; The sale of CDOs to international investors made the US housing bubble a global problem and provided the transmission mechanism for the contagion to the rest of the world;
Main Factors: Financial Innovation The collapse of the subprime market led to the freezing of the interbank lending market in August 2007; And all this spilled over into the real economy through the credit crunch and collapsing equity markets; A significant recession emerged: the ‘great recession’.
Contributory Factors: International Imbalances Feature 1: International Imbalances The process described so far was accentuated by the international imbalances, which were built up over a decade or more; The rise of China and the decline of investment in many parts of Asia following the 1997 crisis there, created a great deal of savings; Those savings were channeled mainly into the US, helping to put downward pressure on US interest rates; That, along with the Fed low interest rate policy pursued at the same time, enabled households there to live well beyond their means;
Contributory Factors: International Imbalances Low interest rates at the same time helped to push up asset prices, especially house prices, thereby enabling the financial sector to explode; The explosion of the banking sector enabled lending to households and businesses to expand substantially along with lending to other banks; All these imbalances created a more buoyant market for financial institutions thereby helping in the promotion of the financial engineering innovation discussed earlier.
Contributory Factors: Monetary Policy Feature 2: NCM Monetary Policy This feature springs from the monetary policy emphasis on frequent interest rate changes as a vehicle to controlling inflation; The impact of this policy has been the creation of enormous liquidity and household debt in the major economies, which reached unsustainable magnitudes and helped to promote the ‘great recession’; Especially so after the collapse of the IT bubble (March 2000) when central banks, led by the Fed, pursued highly accommodative monetary policies to avoid a deep recession;
Contributory Factors: Monetary Policy As a result of these developments, the transmission mechanism of Monetary Policy has changed: The build up of household debt and asset holdings has made household expenditure more sensitive to short-term interest rate changes;
Contributory Factors: Monetary Policy Looking at debt statistics, we find that in the US and between 1998 and 2002 outstanding household debt was 76.7 percent to GDP; between 2003 and 2007 it increased to 97.6 percent of GDP; Outstanding household debt, including mortgage debt, in the UK was 72.0 percent of GDP over the period 1998 to 2002; between 2003 and 2007 it shot to 94.3 percent of GDP; And in the Euro Area outstanding household debt increased from 48.5 to 56.6 respectively in the same periods as above;
Contributory Factors: Monetary Policy Over the period 1997 to 2007 the ratio of US financial sector debt to GDP rose by 52 percent; Over the same period the total US private debt to GDP rose by 101 percent; Similar numbers apply in the case of other developed countries, notably UK, Ireland, Spain;
Contributory Factors: Monetary Policy Another interesting set of US statistics is the following; In 1989 the debt to income ratio was around 60 percent for the top 10 percent of household incomes and around 80 percent for all other groups; In 2007 the respective ratios were around 80 percent for the top 10 percent , 250 percent for the bottom quintile, and between 150 and 180 percent for the middle groups;
Contributory Factors: Monetary Policy Consequently, the dangers with the type of monetary policy pursued at the time are clear: frequent changes in interest rates can have serious effects; Low interest rates cause bubbles; high interest rates work through applying economic pressures on vulnerable social groups; Regulatory and prudential controls become, then, necessary.
Contributory Factors: Role of Credit Rating Agencies Feature 3: Role of Credit Rating Agencies There is sufficient consensus by now that credit rating agencies contributed to the current financial crisis; Credit rating agencies erroneously assigned AAA- status to many worthless papers; the assignment did not reflect the true risks inherent in those securities; This unfortunate episode emerged in view of the credit rating agencies accounting only for the credit default risk and not market or liquidity risk;
Contributory Factors: Role of Credit Rating Agencies A further problem is the role of credit rating agencies in the economy. This is to forecast the probability of default on the repayment period of the issuer of a debt liability. One of their jobs is, therefore, relevant forecasting; The accuracy of their forecasts is clearly an important issue, which should be susceptible to ex post accountability; On this score there is no check on their forecasts since it is left to the credit rating agencies themselves what precisely to publish;
Contributory Factors: Role of Credit Rating Agencies Conflict of interest is another important feature of the credit rating agencies; Credit rating agencies are paid by the issuers, not by investors. In fact, the larger credit rating agencies receive most of their revenues from the issuers they rate; These fees were enhancing their revenues and profits substantially during the boom; Thereby creating potentially a serious conflict-of-interest case;
Economic Policy Implications: General Observations Certain policy implications follow The first is that the focus of monetary policy on the single objective of inflation should be abandoned; The Bank of International Settlements in a publication dated December 2011stated that: “The financial crisis has revealed significant deficiencies in our institutional framework: (i) price stability is not enough, nor are interest rate adjustments;
Economic Policy Implications: General Observations (ii) fiscal policy provides the only available insurance against systemic events, whether arising from natural disasters or man-made financial crises, so cyclically balanced budgets in normal times are not enough; and (iii) prudential authorities need to take system-wide perspective in regulation and supervision, so focusing on the solvency of individual institutions is not enough”.
Economic Policy Implications: General Observations The second implication is that the main operation of any Central Bank should be directed towards financial stability; The events leading to the ‘great recession’ testify to this important requirement; Financial stability has not been addressed properly, and as such it requires further investigation;
Economic Policy Implications: General Observations The focus of financial stability should be on proper control of the financial sector so that it becomes socially and economically useful to the economy as a whole and to the productive economy in particular; Banks should serve the needs of their customers rather than provide short-term gains for shareholders and huge profits for themselves.
Economic Policy Implications: General Observations The third is that distributional effects should be a major objective of policy as this is also clear from our analysis; And to quote a relevant conclusion from an IMF study (Kumhof and Rencière, 2010b), “Restoring equality by redistributing income from the rich to the poor would not only please the Robin Hoods of the world, but could also save the global economy from another major crisis”.
Summary and Conclusions
We have highlighted the origins of the current
financial crisis;
We have emphasised the distributional effects as one
of the main causes of the ‘great recession’;
More intervention on the policy front is desperately
needed, focused on coordination of fiscal with
monetary/financial stability policies;
Distributional effects and financial stability should be
part of the economic policy objectives;
A properly regulated and functioning banking system
is paramount to allow economic activity to expand.You can also read