Microsoft Security Intelligence Report
←
→
Page content transcription
If your browser does not render page correctly, please read the page content below
Microsoft Security
Intelligence Report
Volume 16 | July through December, 2013

Key Findings Summary
This document is for informational purposes only. MICROSOFT MAKES NO
WARRANTIES, EXPRESS, IMPLIED, OR STATUTORY, AS TO THE INFORMATION IN
THIS DOCUMENT.
This document is provided “as-is.” Information and views expressed in this
document, including URL and other Internet website references, may change
without notice. You bear the risk of using it.
Copyright © 2014 Microsoft Corporation. All rights reserved.

The names of actual companies and products mentioned herein may be the
trademarks of their respective owners.
Microsoft Security
Intelligence Report,
Volume 16
Volume 16 of the Microsoft Security Intelligence Report (SIRv16) provides in-
depth perspectives on software vulnerabilities in Microsoft and third-party
software, exploits, and malicious code threats. Microsoft developed these
perspectives based on detailed trend analyses over the past several years, with a
focus on the second half of 2013.

This document summarizes the key findings of the report.

The SIR website also includes deep analysis of trends found in more than 100
countries/regions around the world and offers suggestions to help manage risks
to your organization, software, and people.

You can download SIRv16 from www.microsoft.com/sir.

                                         MICROSOFT SECURITY INTELLIGENCE REPORT, VOLUME 16, JULY–DECEMBER 2013 1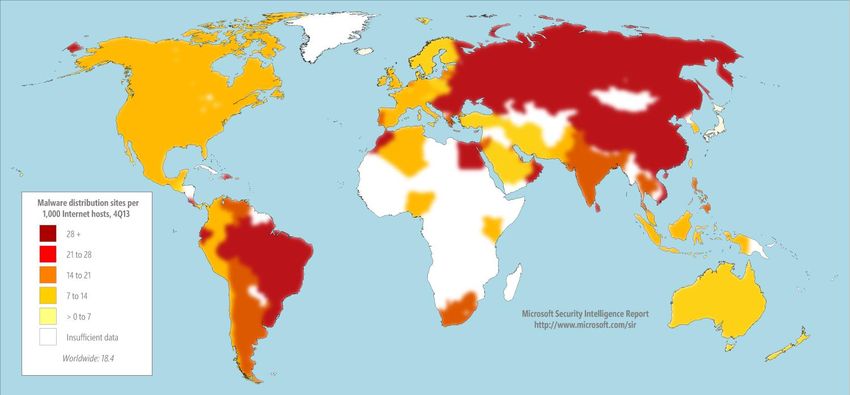
Vulnerabilities
Vulnerabilities are weaknesses in software that enable an
attacker to compromise the integrity, availability, or
confidentiality of the software or the data that it processes.
Some of the worst vulnerabilities allow attackers to exploit the
compromised system by causing it to run malicious code
without the user’s knowledge.
Figure 1. Trends for vulnerability (CVE) severity, vulnerability complexity, disclosures by type, and disclosures for Microsoft and non-
Microsoft products, across the entire software industry, 1H11–2H131
1,600 1,400
Medium complexity
Medium (4–6.9) (medium risk)
1,400 1,200
Low complexity
(highest risk)
Industrywide vulnerability disclosures
Industrywide vulnerability disclosures
1,200
1,000
1,000
800
800 High (7–10)
600
600
400
400
Low (0–3.9) 200
200 High complexity
(lowest risk)
0 0
1H11 2H11 1H12 2H12 1H13 2H13 1H11 2H11 1H12 2H12 1H13 2H13
1,800
3,000
1,600
Other 2,500
1,400
applications
Industrywide vulnerability disclosures
Non-Microsoft
1,200
2,000
Vulnerability disclosures
1,000
1,500
800
600 Core operating
1,000
system
400 Operating
system
applications 500
200
Web browsers
Microsoft
0 0
1H11 2H11 1H12 2H12 1H13 2H13 1H11 2H11 1H12 2H12 1H13 2H13
Vulnerability disclosures across the industry in 2H13 were up 6.5 percent
from 1H13, and 12.6 percent from 2H12. Increased disclosures of application
vulnerabilities were responsible for much of the increase. Overall, however,
vulnerability disclosures remained below their recent peak level in 1H12, and
well below levels seen prior to 2009, when totals of 3,500 disclosures or
more per half-year period were not uncommon.
1Throughout the report, half-yearly and quarterly time periods are referenced using the nHyy or nQyy
formats, where yy indicates the calendar year and n indicates the half or quarter. For example, 2H13 represents
the second half of 2013 (July 1 through December 31), and 4Q12 represents the fourth quarter of 2012 (October
1 through December 31).
2 KEY FINDINGS SUMMARY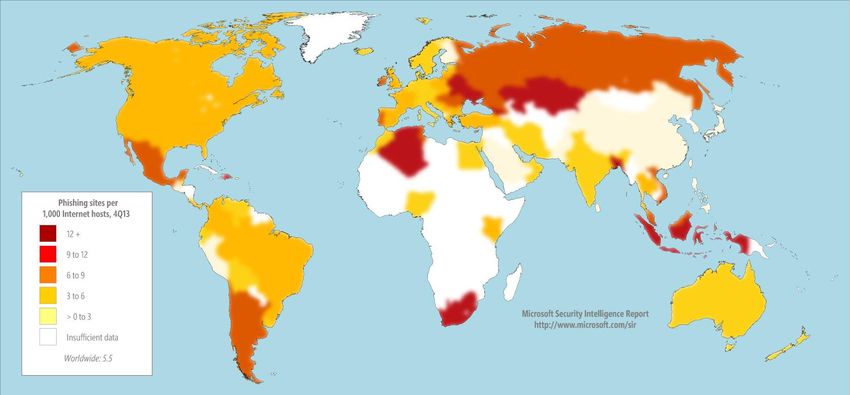
Exploits
An exploit is malicious code that takes advantage of software
vulnerabilities to infect, disrupt, or take control of a computer
without the user’s consent and typically without their
knowledge. Exploits target vulnerabilities in operating systems,
web browsers, applications, or software components that are
installed on a computer.
Figure 2 shows the prevalence of different types of exploits detected by
Microsoft antimalware products in each quarter in 2013, by encounter rate.
Encounter rate is the percentage of computers running Microsoft real-time
security products that report a malware encounter. For example, the encounter
rate for Java exploit attempts in 4Q13 was 1.0 percent, meaning that 1 percent of
computers running Microsoft real-time security software in 4Q13 encountered
Java exploit attempts, and 99 percent did not. In other words, a computer
selected at random would have had about a 1 percent chance of encountering a
Java exploit attempt in 4Q13.
Figure 2. Encounter rates for different types of exploit attempts in 2013

                                                      2.0%

                                                      1.8%
Percent of all reporting computers (encounter rate)

                                                      1.6%

                                                      1.4%

                                                      1.2%

                                                      1.0%                                                           Java

                                                      0.8%

                                                      0.6%
                                                                                                                     HTML/JavaScript
                                                                                                                     Operating system
                                                      0.4%

                                                      0.2%
                                                                                                                     Adobe Flash (SWF)
                                                      0.0%                                                           Documents
                                                             1Q13   2Q13             3Q13                4Q13

                                                                           MICROSOFT SECURITY INTELLIGENCE REPORT, VOLUME 16, JULY–DECEMBER 2013 3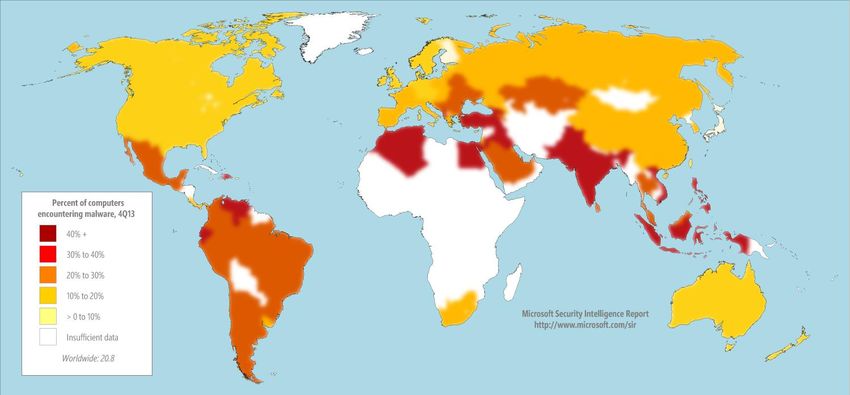
Computers that report more than one type of exploit are counted for each
type detected.
Detections of individual exploits often increase and
Industrywide decrease significantly from quarter to quarter as exploit kit
vulnerability disclo- distributors add and remove different exploits from their kits.
This variation can also have an effect on the relative
sures increased in
prevalence of different exploit types, as shown in Figure 2.
2H13, but high- Despite decreasing each quarter, Java exploits were the
severity vulnerabil- most commonly encountered type of exploits in 2H13.
ities went down. Encounters with web-based (HTML/JavaScript) threats
decreased by more than half in 2H13 to become the second
most commonly encountered type of exploits.
Detections of operating system, Adobe Flash, and document exploits
remained mostly stable during the second half of the year.
Exploit families
Figure 3 lists the exploit-related families that were detected most often during
the second half of 2013.
Figure 3. Quarterly encounter rate trends for the top exploit families detected and blocked by Microsoft real-time antimalware
products in 2H13, shaded according to relative prevalence
Exploit Platform or technology 1Q13 2Q13 3Q13 4Q13
CVE-2012-1723 Java 0.72% 0.47% 0.55% 0.32%
CVE-2010-2568 (CplLnk) Operating system 0.31% 0.33% 0.35% 0.37%
CVE-2013-1493 Java 0.01% 0.20% 0.43% 0.24%
HTML/IframeRef* HTML/JavaScript 0.82% 0.92% 0.35% 0.30%
CVE-2013-0422 Java 0.35% 0.27% 0.29% 0.18%
CVE-2012-0507 Java 0.39% 0.25% 0.18% 0.17%
Blacole HTML/JavaScript 0.88% 0.35% 0.17% 0.17%
CVE-2010-0840 Java 0.12% 0.19% 0.14% 0.20%
CVE-2013-2423 Java — 0.10% 0.15% 0.10%
CVE-2011-3544 Java 0.16% 0.13% 0.11% 0.10%
Totals for individual vulnerabilities do not include exploits that were detected as part of exploit kits.
*Totals include only IframeRef variants categorized as exploits.
Overall, exploit encounter rates decreased significantly in 2H13.
4 KEY FINDINGS SUMMARY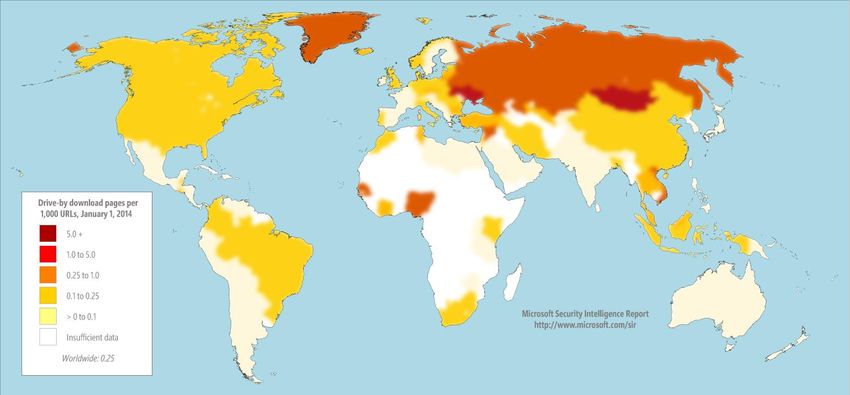
CVE-2012-1723, a vulnerability in the Java Runtime Environment (JRE), was
the most commonly targeted vulnerability in 2H13, although it declined
significantly from its peak in 1Q13. Exploits that target CVE-2012-1723 can
use the vulnerability to download and run programs of the attacker’s choice
on the computer. CVE-2012-1723 is often exploited through drive-by
downloads. (See page 18 for more information about drive-by download
sites.)
CVE-2010-2568, the second most commonly targeted
vulnerability in 2H13, is a vulnerability in Windows Shell. Overall, exploit
Detections are often identified as variants in the encounter rates
Win32/CplLnk family, although several other malware
decreased
families attempt to exploit the vulnerability as well. The
vulnerability was first discovered being used by the malware
significantly in
family Win32/Stuxnet in mid-2010, and it has since been 2H13.
exploited by a number of other families, many of which
predated the disclosure of the vulnerability and were subsequently adapted
to attempt to exploit it. Microsoft published Security Bulletin MS10-046 in
August 2010 to address the issue.
Blacole is the Microsoft detection name for components of the so-called
“Blackhole” exploit kit, which delivers malicious software through infected
webpages. Prospective attackers buy or rent the Blacole kit on hacker
forums and through other illegitimate outlets. When the attacker loads the
Blacole kit on a malicious or compromised web server, visitors who don’t
have the appropriate security updates installed are at risk of infection
through a drive-by download attack. Blacole was encountered by 0.88
percent of all reporting computers in 1Q13 but declined steeply after that,
with encounter rates of just 0.17 percent in both 3Q13 and 4Q13. The Blacole
kit’s author, known as “Paunch,” was known for frequently updating the kit
with new exploits and techniques, but development of the kit halted
abruptly in October 2013 following the arrest by Russian authorities of a man
alleged to be Paunch.2
2“Blackhole malware exploit kit suspect arrested, bbc.com, October 9, 2013,
http://www.bbc.com/news/technology-24456988.
MICROSOFT SECURITY INTELLIGENCE REPORT, VOLUME 16, JULY–DECEMBER 2013 5Malware
Most attempts by malware to infect computers are
unsuccessful. More than three-quarters of Internet-connected
personal computers worldwide are protected by real-time
security software that constantly monitors the computer and
network traffic for threats and blocks them before they can
infect the computer, if possible. Therefore, for a
comprehensive understanding of the malware landscape, it’s
important to consider infection attempts that are blocked as
well as infections that are removed.
For this reason, Microsoft uses two different metrics to measure malware
prevalence:3
Encounter rate is simply the percentage of computers running Microsoft
real-time security products that report a malware encounter. For example,
the encounter rate for the malware family Win32/Sefnit in Germany in 3Q13
was 1.73 percent. This data means that, of the computers in Germany that
were running Microsoft real-time security software in 3Q13, 1.73 percent
reported encountering the Sefnit family, and 98.27 percent did not. (Only
computers whose users have opted in to provide data to Microsoft are
considered when calculating encounter rates.)
Computers cleaned per mille, or CCM, is an infection rate metric that is
defined as the number of computers cleaned for every 1,000 unique
computers executing the Malicious Software Removal Tool (MSRT), a free
tool distributed through Microsoft update services that removes more than
200 highly prevalent or serious threats from computers. Because it is not a
real-time tool, the MSRT only detects and removes threats that are already
present on the computer; it does not block infection attempts as they
happen.
3Microsoft regularly reviews and refines its data collection methodology to improve its scope and accuracy.
For this reason, the statistics presented in this volume of the SIR may differ slightly from comparable statistics in
previous volumes.
6 KEY FINDINGS SUMMARYFigure 4 illustrates the difference between these two metrics.
Figure 4. Worldwide encounter and infection rates in 2013, by quarter
25% 250
Percent of all reporting computers (encounter rate)
Computers cleaned per 1,000 scanned (CCM)
20% 200
15% 150
10% 100
5% 50
0% 0
1Q13 2Q13 3Q13 4Q13
Encounter rate Infection rate (CCM)
As Figure 4 shows, and as one would expect, malware encounters are much
more common than malware infections. On average, about 21.2 percent of
reporting computers worldwide encountered malware each quarter in 2013. At
the same time, the MSRT removed malware from about 11.7 out of every 1,000
computers, or 1.17 percent. Together, encounter and infection rate information
can help provide a broader picture of the malware landscape by offering
different perspectives on how malware propagates and how computers get
infected.
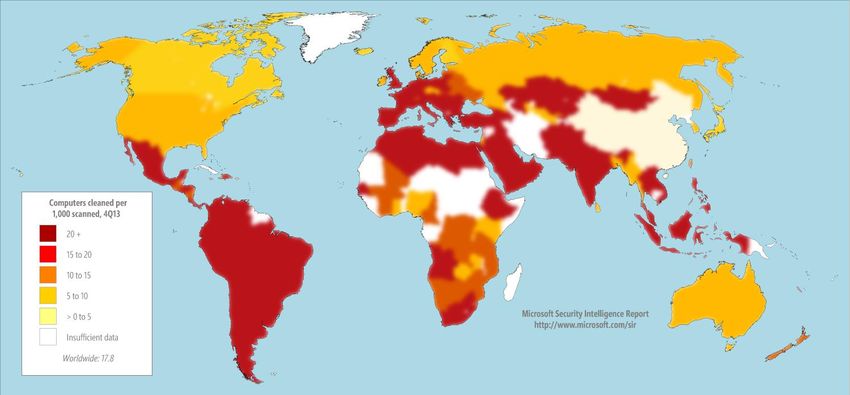
Malware prevalence worldwide
For a perspective on threat patterns worldwide, Figure 5 shows the infection and
encounter rates in locations around the world in 4Q13.
MICROSOFT SECURITY INTELLIGENCE REPORT, VOLUME 16, JULY–DECEMBER 2013 7Figure 5. Encounter rates (top) and infection rates (bottom) by country/region in 4Q13
Security software use
Recent releases of the MSRT collect and report details about the
About three- state of real-time antimalware software on the computer, if the
quarters of computer’s administrator has chosen to opt in to provide data to
Microsoft. This telemetry makes it possible to analyze security
computers world-
software usage patterns around the world and correlate them
wide consistently with infection rates. Figure 6 shows the percentage of computers
run real-time worldwide that the MSRT found to be protected or unprotected
by real-time security software each quarter in 2013.
security software.
8 KEY FINDINGS SUMMARYFigure 6. Percentage of computers worldwide protected by real-time security software in 2013
90%
80% Always
protected
Percent of computers running the MSRT
70%
60%
50%
40%
30%
20% Intermittently
protected
10%
Unprotected
0%
1Q13 2Q13 3Q13 4Q13
Infection rates by operating system
The features and updates that are available with different versions of the
Windows operating system and the differences in the way people and
organizations use each version affect the infection rates for the different
versions and service packs. Figure 7 shows the infection rate for each currently
supported Windows operating system/service pack combination.
MICROSOFT SECURITY INTELLIGENCE REPORT, VOLUME 16, JULY–DECEMBER 2013 9Figure 7. Infection rate (CCM) by operating system and service pack in 3Q13 and 4Q13
35.0
32.4
Computers cleaned per 1,000 scanned (CCM)
30.0
25.9
25.0 24.2
20.0
17.3
15.0
9.5
10.0
5.3 4.9
5.0 3.1 3.4 3.9
2.1 1.6 1.9 1.3 1.6
0.8 0.3 0.5 0.9
0.0
SP3 SP2 SP1 RTM RTM SP2 SP2 RTM SP1 RTM
Windows XP Windows Windows 7 Windows 8 Windows 8.1 Windows Windows Windows Server 2008 R2 Windows
Vista Server 2003 Server 2008 Server 2012
3Q13 4Q13
SP = Service Pack. RTM = Release to manufacturing. Support for Windows XP ended April 8, 2014, after the end of 4Q13. CCM
figures are expected to return to more typical levels in 2014.
This data is normalized; that is, the infection rate for
Infection rates on each version of Windows is calculated by comparing an
all platforms were equal number of computers per version (for example,
many times higher 1,000 Windows XP SP3 computers to 1,000 Windows 8
RTM computers).
in 4Q13 due to Infection rates in 4Q13 were many times higher on all
Rotbrow. supported Windows client platforms than they were in
3Q13, because of the influence of Win32/Rotbrow. CCM
figures are expected to return to more typical levels in 2014.
Threat families
Figure 8 shows the detection trends for a number of families that increased or
decreased significantly over the past four quarters.
10 KEY FINDINGS SUMMARYFigure 8. Detection trends for a number of notable malware families in 2013
7%
Percent of all reporting computers (encounter rate)
6% Win32/Rotbrow
5%
4%
Win32/Brantall
3%
Win32/Wysotot
2% Win32/Obfuscator
INF/Autorun
1% Win32/Gamarue
Win32/Sefnit
Win32/Sality
0%
1Q13 2Q13 3Q13 4Q13
Four of the most commonly encountered families in 2H13—
Win32/Rotbrow, Win32/Brantall, Win32/Wysotot, and Four of the top
Win32/Sefnit—were either new or reappeared after a families in 2H13
significant period of dormancy. See the entry “Rotbrow: The
were new or
Sefnit distributor” (December 10, 2013) on the MMPC blog
at blogs.technet.com/mmpc.
reappeared after a
Wysotot is a family of trojans that change the start page of significant period
the user’s web browser. It is usually installed by software of dormancy.
bundlers that advertise free software or games. Wysotot
was first detected in October 2013, and detection signatures were added to
the MSRT in March 2014. For more information about Wysotot, see the entry
“MSRT March 2014 – Wysotot” (March 11, 2014) in the MMPC blog at
blogs.technet.com/mmpc.
Home and enterprise threats
The usage patterns of home users and enterprise users tend to be very different.
Analyzing these differences can provide insights into the different ways attackers
target enterprise and home users and which threats are more likely to succeed
in each environment.
MICROSOFT SECURITY INTELLIGENCE REPORT, VOLUME 16, JULY–DECEMBER 2013 11Figure 9. Malware encounter rates for consumer and enterprise computers in 2013
25%
Consumer
Percent of all reporting computers (encounter rate)
20%
15%
10% Enterprise
5%
0%
1Q13 2Q13 3Q13 4Q13
Enterprise environments typically implement defense-in-depth measures,
such as enterprise firewalls, that prevent a certain amount of malware from
reaching users’ computers. Consequently, enterprise computers tend to
encounter malware at a lower rate than consumer computers. As Figure 9
shows, the encounter rate for consumer computers was about 2.2 times as
high as the rate for enterprise computers in both 3Q13 and 4Q13.
Figure 10 and Figure 11 list the top 10 families detected on domain-joined and
non-domain computers, respectively, in 2H13.
12 KEY FINDINGS SUMMARYFigure 10. Quarterly trends for the top 10 families detected on domain-joined computers in 2H13, by percentage of computers
encountering each family
1.6%
Percent of all reporting computers (encounter rate)
1.4%
1.2%
1.0%
3Q13
0.8%
0.6%
0.4%
4Q13
0.2%
0.0%
Win32/Gamarue
Win32/Sirefef
HTML/IframeRef
Win32/Brantall
Win32/Zbot
Java/CVE-2012-1723
Win32/Conficker
INF/Autorun
Win32/Obfuscator
Win32/Rotbrow
Worms Miscellaneous Trojans Trojan Downloaders & PW Stealers Exploits
Droppers & Mon.
Tools
Figure 11. Quarterly trends for the top 10 families detected on non-domain computers in 2H13, by percentage of computers
encountering each family
7%
Percent of all reporting computers (encounter rate)
6%
5%
4%
3Q13
3%
2%
4Q13
1%
0%
Win32/Gamarue
Win32/Wysotot
Win32/Sirefef
Win32/Brantall
Win32/Sefnit
Win32/Dorkbot
Win32/Rotbrow
INF/Autorun
Win32/Sality
Win32/Obfuscator
Miscellaneous Trojans Trojan Downloaders & Worms Viruses
Droppers
Five threats—INF/Autorun, Win32/Brantall, Win32/Gamarue,
Win32/Obfuscator, and Win32/Rotbrow—were common to both lists. All
were more frequently encountered on non-domain computers than on
MICROSOFT SECURITY INTELLIGENCE REPORT, VOLUME 16, JULY–DECEMBER 2013 13domain-joined computers. See “Threat families” on page 10 for more
information about these families.
Win32/Conficker, the most commonly encountered
The usage patterns family on domain-joined computers in 2H13, is a worm
that spreads by exploiting a vulnerability addressed by
of home users and
Security Bulletin MS08-067. It can also spread via
enterprise users network shares and removable drives, which are
tend to be very commonly used in domain environments.
different. Win32/Sefnit, the 6th most commonly encountered
famiy on non-domain computers in 2H13, became
significantly more active in 3Q13 after a long period of dormancy. Sefnit is a
bot that allows a remote attacker to use the computer to perform various
activities, using the Tor anonymity network to issue commands to the
botnet.
14 KEY FINDINGS SUMMARYEmail threats
More than 75 percent of the email messages sent over the
Internet are unwanted. Not only does all this unwanted email
tax recipients’ inboxes and the resources of email providers,
but it also creates an environment in which emailed malware
attacks and phishing attempts can proliferate.
Spam messages blocked
The information in this section of the Microsoft Security Intelligence Report is
compiled from telemetry data provided by Exchange Online Protection, which
provides spam, phishing, and malware filtering services. Exchange Online
Protection is used by tens of thousands of Microsoft enterprise customers that
process tens of billions of messages each month.
Figure 12. Messages blocked by Exchange Online Protection in 2013, by month
30
25
Spam messages blocked (in billions)
20
15
10
5
-
Jan Feb Mar Apr May Jun Jul Aug Sep Oct Nov Dec
Blocked mail volumes in 2H13 were consistent with 1H13, and remain well
below levels seen prior to the end of 2010, as shown in Figure 13. The
dramatic decline in spam observed since 2010 has occurred in the wake of
successful takedowns of a number of large spam-sending botnets, notably
MICROSOFT SECURITY INTELLIGENCE REPORT, VOLUME 16, JULY–DECEMBER 2013 15Figure 13. Messages blocked by Exchange Online Protection each half-year
period, 1H10–2H13 Cutwail (August 2010) and Rustock
500 (March 2011).4 In 2H13, Exchange
450 Online Protection determined that
Spam messages blocked (in billions)
400
about 1 in 4 email messages did
350
300 not require blocking or filtering,
250 compared to just 1 in 33 messages
200
150
in 2010.
100
50
-
1H10 2H10 1H11 2H11 1H12 2H12 1H13 2H13
Figure 14. Inbound messages blocked by Exchange Online Protection filters, July–October 2013, by category
Pharmacy
(non-sexual)
Other 43.1%
1.9%
Stock
1.3%
Dating/sexually
explicit material Image-only
1.4% 20.5%
Financial
2.5%
Phishing
4.1% Non-pharmacy
419 scams
product ads
14.0%
4.2% Malware
7.1%
4 For more information about the Cutwail takedown, see Microsoft Security Intelligence Report, Volume 10
(July-December 2010). For more information about the Rustock takedown, see “Battling the Rustock Threat,”
available from the Microsoft Download Center.
16 KEY FINDINGS SUMMARYMalicious websites
Attackers often use websites to conduct phishing attacks or
distribute malware. Malicious websites typically appear to be
completely legitimate, and provide no outward indicators of
their malicious nature even to experienced computer users.
Global distribution of phishing sites
Phishing sites are hosted all over the world on free hosting sites, on
compromised web servers, and in numerous other contexts. Performing
geographic lookups of IP addresses in the database of reported phishing sites
makes it possible to create maps that show the geographic distribution of sites
and to analyze patterns.
Figure 15. Phishing sites per 1,000 Internet hosts for locations around the world in 4Q13
SmartScreen Filter detected 5.5 phishing sites per 1,000 Internet hosts
worldwide in 4Q13.
Locations with higher than average concentrations of phishing sites include
Ukraine (14.2 per 1,000 Internet hosts in 4Q13), Indonesia (12.8), and South
Africa (12.5). Locations with low concentrations of phishing sites include
Taiwan (1.4), Japan (1.4), and Korea (1.6).
MICROSOFT SECURITY INTELLIGENCE REPORT, VOLUME 16, JULY–DECEMBER 2013 17Malware hosting sites
SmartScreen Filter in Internet Explorer helps provide protection against sites that
are known to host malware, in addition to phishing sites. SmartScreen Filter uses
file and URL reputation data and Microsoft antimalware technologies to
determine whether sites distribute unsafe content.
Global distribution of malware hosting sites
Figure 16. Malware distribution sites per 1,000 Internet hosts for locations around the world in 4Q13
Sites that host malware were significantly more common than phishing sites
in 2H13. SmartScreen Filter detected 18.4 malware hosting sites per 1,000
Internet hosts worldwide in 4Q13.
China, which had a lower than average concentration of phishing sites (2.3
phishing sites per 1,000 Internet hosts in 4Q13), also had a very high
concentration of malware hosting sites (35.8 malware hosting sites per 1,000
hosts in 4Q13). Other locations with large concentrations of malware hosting
sites included Ukraine (59.2), Romania (57.8), and Russia (41.0). Locations
with low concentrations of malware hosting sites included Japan (6.7), New
Zealand (7.6), and Finland (8.8).
Drive-by download sites
A drive-by download site is a website that hosts one or more exploits that target
vulnerabilities in web browsers and browser add-ons. Users with vulnerable
computers can be infected with malware simply by visiting such a website, even
without attempting to download anything.
18 KEY FINDINGS SUMMARYFigure 17. Drive-by download pages indexed by Bing at the end of 4Q13 per 1,000 URLs in each country/region
This document summarizes the key findings of the report. The SIR website also
includes deep analysis of trends found in more than 100 countries/regions
around the world and offers suggestions to help manage risks to your
organization, software, and people.
You can download SIRv16 from www.microsoft.com/sir.
MICROSOFT SECURITY INTELLIGENCE REPORT, VOLUME 16, JULY–DECEMBER 2013 19One Microsoft Way Redmond, WA 98052-6399 microsoft.com/security
You can also read