New type of CSO chamber responds to economic and ecological needs
←
→
Page content transcription
If your browser does not render page correctly, please read the page content below
11th International Conference on Urban Drainage, Edinburgh, Scotland, UK, 2008

                          New type of CSO chamber
                   responds to economic and ecological needs
                 Jaroslav Pollert1*, Petr Srníček2, Vojtěch Bareš3, Jaroslav Kunc4
 1
   Czech Technical University in Prague, Faculty of Civil Engineering Department of Sanitary and Ecological
                        engineering, Thákurova 7, Praha 6, 166 29, Czech Republic
 2
   Czech Technical University in Prague, Faculty of Civil Engineering Department of Sanitary and Ecological
                        engineering, Thákurova 7, Praha 6, 166 29, Czech Republic
 3
   Czech Technical University in Prague, Faculty of Civil Engineering Department of Sanitary and Ecological
                        engineering, Thákurova 7, Praha 6, 166 29, Czech Republic
            4
              HOBAS CZ spol. s r. o., Za Olšávkou 391, 686 01 Uherské Hradište, Czech Republic

                            *Corresponding author, e-mail pollertj@fsv.cvut.cz

ABSTRACT
In 2005 one of major Czech manufacturers of glass reinforced plastic pipes asked Department
of Sanitary and Ecological Engineering to develop a new type of CSO chamber that could
become part of their manufacturing programme. Main requirements were economy of
production, easy and fast installation on field and increased protection of receiving waters.
The authors deal with an evaluation of prefabricated CSO unit made of fibreglass tubes in the
presented study. Based on the methods of hydraulic and mathematical modelling, the unit
geometry was evaluated. Particularly, flow patterns in the plane of symmetry of the CSO were
measured on a hydraulic model using Ultrasonic Velocity Profiler (UVP). The mathematic k-ε
model was used for 3-D simulation of turbulent flow and suspended solids transport. Finally,
the optimal geometrical configurations with respect to the gravitational separation of
suspended solids content and separation of floatable solids as well were found.
First three specimen of this new CSO chamber (it was named “TOK”) were installed in towns
and several more are in plan not only in the Czech Republic. We also compare the TOK with
other types of CSO using a mathematical model. This type shows a very good separation
efficiency of suspended solids compared to common types.

KEYWORDS
CFD, combined sewer overflow, ecology, urban drainage

INTRODUCTION
The conception of ecological integrity (ecological condition) of streams is one of the subjects
of current European directive No. 2000/60/EC establishing a framework for Community
action in the field of water policy. Surface runoff, as well as outfalls of storm water drainage
channels (separate sewer system) and outfalls of CSO’s (combined sewer systems) have a
great impact on receiving waters during rainfall periods. CSO’s used to be designed solely on
the basis of their primary function – to distribute water in a certain ratio, discharging only
certain amounts to the underlying sewer network.
This view of the matter takes into account only the quantity, disregarding the quality of the
separated water. With the environmental aspects divided into several basic categories, it is
necessary to take an innovative approach to the manner of designing new CSO’s or modifying

Pollert et al.                                                                                            1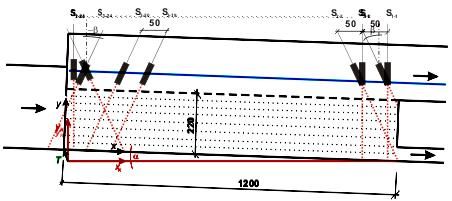
11th International Conference on Urban Drainage, Edinburgh, Scotland, UK, 2008

the current ones, aiming at improving the removal of non-dissolved substances with specific
pollutants (i.e. heavy metals) bound to them.
A tremendous number of CSO’s geometrical configurations were developed during last
decades worldwide. Often, the geometry of CSO is given by regional development routine
and varies in the wide range even in the individual countries. The CSO’s design itself should
take into account different criteria as hydraulic behaviour, discharge distribution, energy
losses, separation of floating solids, cost-effectiveness etc. In addition, the efficiency of
separation of suspended solids content can be increased using the optimal hydraulic condition
and flow pattern distribution.

DESIGN DESCRIPTION AND OPERATIONAL PRINCIPLE
As mentioned above, the combined sewer overflow should not only perform the function of
protecting the sewer system against overloading, but also serve as a point of rough wastewater
pre-treatment. Mathematical modelling indicates that such particles are washed out of the
sediments in common combined sewer overflows with side overflow lips and that they are
more likely to flow into receiving water. The efficiency of separating suspended solids should
be better with vortex separators.

When constructing new combined sewer overflows, the above-mentioned preconditions
should be applied to the maximum possible extent. The parameters to be met by the combined
sewer overflow should be reflected in its design. Obviously, it is not always possible to
comply exactly with all the requirements; nevertheless, good results may be obtained by
making appropriate compromises.

Cooperating with the HOBAS Company, our laboratory developed a new type of combined
sewer overflow (Figure 1). According to all the preliminary evaluations, this type meets the
above-described requirements in an optimal way. The name is “Tube” CSO – “TOK”.

The combined sewer overflow distinguishes itself by being based on a very simple principle;
in fact, it consists of two pipes positioned one above another (Figure 2). At the end of the
lower pipe (inlet), there is a constriction member or another outflow regulator. The upper pipe
(spillway) with a bottom slit along the whole connection of both pipes is used for water runoff
into receiving water. The height of the overflow lip is determined by embedding the upper
one. Its simple design provides for reducing the total construction costs. The convenient
placement of the overflow pipe (above the inlet one) facilitates ground work. The simple
construction of combined sewer overflow using standard pipes makes both the production and
laying simpler and less expensive.

This type is suitable for flat terrains providing for taking advantage of the inlet pipe retention.
The inlet pipe can be designed as pressure-type so as to improve the flow and increase its
retention capacity. Another advantage consists in catching the first flush in the retention area.
After the rain is over, the combined sewer overflow is rinsed automatically as the surface of
its walls is smooth, which contributes to a better runoff of sediments.

The inlet part of the combined sewer overflow is provided with a downflow baffle preventing
floating contaminants from flowing into the receiving water. The upper slit (upper overflow
lip) serves for a storm water outflow. Positioning the slit atop of the inlet pipe aims at
improving the transverse flow influencing the separation of suspended solids in a positive
way – to the outflow.

2                       New type of CSO chamber responds to economic and ecological needs
11th International Conference on Urban Drainage, Edinburgh, Scotland, UK, 2008

EXPERIMENT
Experimental model of CSO was made from Plexiglas (Figure 1). Two calibrated
electromagnetic flow meters (KROHNE DN 200, DN 50) were installed for continuous
discharge measurements on inflow and outflow pipe. Free surface in overflow pipe above
overflow silt was measured with needle gauge.

Figure 1. Hydraulic model of measured CSO

Five types of overflow slit were tested and simulated (Figure 2). Each type of overflow silt
was tested with three types of flow regimes (Qinflow = 6 l/s, Qoutflow = 0, 1, 2 l/s). Measurement
of the velocity was done in plane under overflow slit. This was compared with mathematical
model.

                                                                      4                      5
                               2               3
             1
                                                                                             6

                                               3
                                                                                             5
             1                                                                                   6
                                2
                                                                      4
                                                               1200
                        1 - inlet pipe
                                                   20

                                                                                R1 0
                                                                                         overflow slit ST1
                        2 - stilling chamber
                                                   100

                                                         600              600
                        3 - downflow baffle                                     R1 0
                                                                                         overflow slit ST 2
                        4 - overflow slit
                                                   100

                                                               1200
                        5 - overflow pipe                                           R1
                                                                                         overflow slit ST 3
                                                                                0

                        6 - throttle pipe                600              600

                                                                                R1 0
                                                                                         overflow slit ST 4
                                                   200

                                                               1200
                                                                                R1 0
                                                                                         overflow slit ST 5
                                                   200

Figure 2. Ground plan and sectional view of CSO. Five versions of the overflow slit
Flow patterns estimation

The instantaneous information regarding velocity and turbulence distribution was obtained
using UVP Monitor (Met-Flow, S.A.) connected to two US (ultrasonic) velocity transducers
S1 and S2 (Figure 1). The UVP Monitor operates on the principle of the Doppler shift and the
details of this method have been presented by Takeda (1999). This setup allows receiving the

Pollert et al.                                                                                                3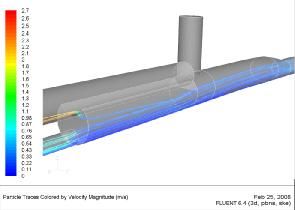
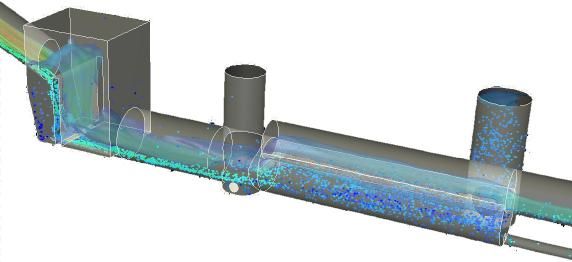
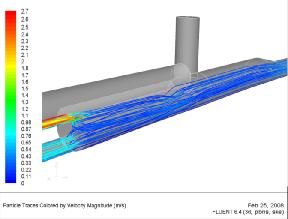
11th International Conference on Urban Drainage, Edinburgh, Scotland, UK, 2008

instantaneous information about both the longitudinal and the vertical velocity profile u(y),
v(y) (Figure 3). This measurement was used to calculate the 2D velocity field.

Figure 3. Position of the velocity transducers for measuring velocity profile under overflow slit

Mathematical modelling
For mathematical simulation of CSO behaviour, k-ε model was used due to its stability,
robustness and calculation time requirements. Calculation was done in FLUENT program
(Figure 4). Free surface was simulated as a wall without friction. Position of free surface was
taken from experiment. Tetrahedral mesh with varying density was used due to the necessity
of increasing the precision in overflow silt.

Basic design of the CSO chamber is quite simple, great attention was, however, paid to the
size and position of all parts, especially the overflow slit and downflow baffle. The main aim
was to achieve homogeneous distribution of flow inside the chamber, thus achieving the
lowest upflow velocities and the best separation of coarse particles.

Figure 4. Trajectories of particles in the CSO chamber

Several modifications (different sizes of downflow baffle and shapes of slit) were first
modelled on computer using computational fluid dynamics (Figure 4). Three different shapes
of slit were chosen based on preliminary studies and were examined in more detail. Three
different flow states were modelled for each of them and trajectories of particles of several
sizes and densities were determined. The efficiency of suspended particle elimination was
then estimated based on total number of particles in overflow and in outflow (throttle pipe).

RESEARCH RESULTS
Geometrical configuration of CSO

Main task of hydraulic modelling was the evaluation of influence of geometrical
configuration on velocity distribution. Moreover, its results should be used for calibration and
verification of mathematical model.

4                      New type of CSO chamber responds to economic and ecological needs
11th International Conference on Urban Drainage, Edinburgh, Scotland, UK, 2008

Particularly, the vertical velocity components were identified with respect to wash out of
suspended solids through CSO to the receiving water. In case of crest configuration ST1
(Figure 5.) the creating of wake (x ≈ 400 mm) is clearly visible. In case of ST1 and ST2 short
circuit flows are visible in area 200-400 mm. Vertical distribution of vertical velocity
components v(y) shows the worst behaviour in ST1. In downstream part of the chamber, the
velocity profiles reach almost the same values.
On the other side, the influence of scumboard on dead zone behind it is increasing with
extending of the overflow crest. Vertical distributions of horizontal velocity components u(y)
indicate on the size of the dead zones for geometrical configurations of the crest ST1-ST3.
Velocity profiles u(y) on coordinate x=600 are more or less identical. In case of ST3 the dead
zone between x = 0 – 600 mm is evident. However, this geometrical configuration provides
the best results in case of vertical velocity components v.

Figure 5. Velocity vectors U for geometrical configurations of overflow crest ST1-ST3 (Qinflow =
6 l/s, Qoutflow=2 l/s).

Verification of mathematical model

Results of measuring (h, Q, u, v) were used as verification parameters for 3D mathematical
modelling. Figure 6 shows comparison between mathematical model and UVP measuring for
one flow state of slit ST3. Mathematical model clearly undervalues the influence of scum
board on dead zone downstream. It can be explained by two reasons – the k- ε mathematical
model is isotropic and density of mesh is too low in the mentioned region. Vertical velocity
components v are higher along the overflow crest than UVP presents. In the middle of the
chamber the difference between velocities are negligible.

Pollert et al.                                                                               5
11th International Conference on Urban Drainage, Edinburgh, Scotland, UK, 2008

Figure 6. Comparison of velocity vectors measured by UVP and simulated in FLUENT for
geometrical configuration ST3 (Qinflow = 6 l/s, Qoutflow= 2 l/s).

INSTALLATION
First three specimen of this new CSO chamber “TOK” were installed in towns of Děčín (May
2007) Moravský Krumlov (April 2007) (Figure 7) and Teplice (February 2008).

                               Figure 7 TOK Moravský Krumlov

First installed “TOK” was in Moravský Krumlov (Figure 7). The inlet pipe DN 800 has a
large slope, so it is followed by a stilling chamber for dissipating kinetic energy. TOK itself

6                      New type of CSO chamber responds to economic and ecological needs
11th International Conference on Urban Drainage, Edinburgh, Scotland, UK, 2008
begins immediately after that chamber. This solution is not the best, due to swirling water
which egests the silt from sediment to overflowing water. The rest is standard solution with
temporary bypass, scum board which can be changed into temporary boards (Figure 8). This
TOK was also modelled with mathematical model (Figure 9) to avoid hydraulic problems. A
time-dependent mathematical model with free surface was used. The difference of this model
compared to the others was dynamic simulation of the suspended solids. Video from this
simulation shows dynamic behaviour of the suspended solids inside the TOK.
Figure 8 Scum board (left) which can be changed into temporary boards (right)
Figure 9 Mathematical model of TOK Moravský Krumlov (water level and particles of the
suspended solids)
The possibility to install the object in a very short
time proved very valuable especially in Děčín. The
object is located in a street with busy traffic
(Figure 10), so minimizing the time of enclosure
was very important. Installation of the CSO
chamber, with DN1000 inflow pipe was completed
overnight.
Design of this CSO also saved the installation
space and dig needs. In cities (streets) it is a very
good argument for this type.
Comparison of separation suspended solids with
other types of the CSO
Separation efficiencies of particles of six different
diameters (50, 100, 150, 200, 250, and 300 μm)
Figure 10 TOK Děčín
Pollert et al. 711th International Conference on Urban Drainage, Edinburgh, Scotland, UK, 2008
and a density of 1800 kg/m3 were simulated using 3d mathematical model in Fluent software
(Figure 11). Theoretical sedimentation velocities of these particles were calculated using the
formulae mentioned below (Tchobanoglous, Burton et al., 2003).
Figure 11 Simulation of separation efficiencies in TOK Děčín (path lines of particles d=150 and
50 μm, ρ=1800 kg/m3)
4g ρs − ρw
us = ( )d s
3C D ρw (1)
24 3
CD = + + 0,34
Re Re (2)
us ds
Re = (3)
ν
us .. sedimentation velocity [m/s] ds ..diameter of particles [m]
g ... gravitational acceleration [m/s2] Cd .drag coefficient
ρs .. density of particles [kg/m3] Re .particle Reynolds number
ρw . density of water [kg/m3] ν....kinematic viscosity [m2/s]
Particles were distributed uniformly on the inlet and their trajectories were simulated using
Lagrangian approach. Separation efficiencies were determined by comparing concentration of
particles on inlet and overflow boundaries. The following chart shows simulated separation
efficiencies of TOK in Děčín for three different flow rates (Figure 12). Flow rates are
expressed as multiples of critical flow rate. This facilitates comparison with other CSOs.
100%
80%
60%
Efficiency
40% 2xQcrit
5xQcrit
20%
7.5xQcrit
0%
0 20 40 60 80 100
Sedimentation velocity [m/h]
Figure 12 Particle separation efficiency of CSO TOK in Děčín for different flow rates
8 New type of CSO chamber responds to economic and ecological needs11th International Conference on Urban Drainage, Edinburgh, Scotland, UK, 2008
Similar simulations of particle separation efficiency were carried out for several CSOs located
in Prague municipal area. These CSOs include: Na Barikádách (side weir), Čakovice (vortex
separator) and Pod Táborem (transverse weir). As can be seen in Figure 13, CSO TOK
performs quite well compared to these CSOs. Only CSO Na barikádách has better simulated
separation efficiency, but this is due to it being overdimensioned and having very low surface
loading and flow velocity.
100%
80%
TOK
Efficiency
60%
Side weir CSO
40% Vortex separator
Transverse weir CSO
20%
0%
0 20 40 60 80 100
Sedimentation velocity [m/h]
Figure 13 Particle separation efficiency of different types of CSOs for 2xQcrit
Table 1 Comparison several types of the combined sewer overflow in mathematical model
Inflow 0utflow Ratio Separation efficiency
CSO [l/s] [l/s] F1 F2 F3 F4 Overall
400 200 2,00 3,7% 4,0% 98,3% 100,0% 27,5%
Side weir
1000 200 5,00 2,3% 2,3% 12,2% 100,0% 7,0%
Čakovice
1500 200 7,50 1,5% 1,9% 0,1% 100,0% 3,7%
Vortex 400 200 2,00 2,5% 4,1% 35,0% 100,0% 12,7%
separator 1000 200 5,00 -11,3% -11,2% 3,8% 100,0% -5,1%
Čakovice 1500 200 7,50 -6,1% -7,2% -3,6% 100,0% -3,2%
Side weir 2500 1926 1,30 24,0% 24,0% 34,6% 100,0% 28,3%
Sekaninova I 3000 2233 1,34 -0,9% -0,9% 10,4% 93,3% 4,0%
Side weir 2500 1626 1,54 15,3% 15,3% 26,0% 100,0% 19,8%
Sekaninova II 3000 2083 1,44 3,7% 3,7% 12,7% 94,6% 8,0%
270 135 2 0,6% 0,6% 78,3% 100,0% 20,5%
Děčín
675 135 5 3,2% 3,2% 29,4% 100,0% 11,5%
TOK
1012,5 135 7,5 -0,9% -0,9% 18,1% 100,0% 5,9%
Slavojova 344,2 239,92 1,43 87,1% 89,6% 97,1% 100,0% 90,3%
with leaping 1228 242,81 5,06 -5,4% -1,4% 4,2% 100,0% 0,4%
weir
From our previous research based on our evaluation methodology of CSO (Pollert, Stránský,
2003) we also compared this new type with other types (Table 1). For all these CSOs,
separation efficiency of “typical wastewater particles” was also calculated. Assumed “typical
wastewater particles” and their corresponding separation efficiencies in different CSOs are
shown in the following table. According to our methodology, we focused on these fractions of
suspended solids: F1 - 1,00E-06 m, 1300 kg/m3; F2 - 1,00E-05 m, 1800 kg/m3; F3 - 1,00E-04
Pollert et al. 911th International Conference on Urban Drainage, Edinburgh, Scotland, UK, 2008
m, 2600 kg/m3; F4 - 1,00E-03 m, 2600 kg/m3. Each fraction was simulated separately under
different flow conditions, which can be compared on flow ratio.
CONCLUSION
We hope this type of CSO will help to decrease the cost of construction of new sewers and
reconstruction of the old ones. Its higher efficiency of separation of suspended particles might
also contribute to improving the quality of receiving water bodies according to Water
Framework Directive 2000/60/EC.
In terms of construction and design, combined sewer overflows are the most complex parts of
the sewage system. The newly-developed type of combined sewer overflow tries to comply
with environmental and economical aspects.
Finally, the optimal geometrical setup of CSO could be defined. Influence of scum board was
found as negative and we recommend moving it upstream.
First three specimen of this new CSO chamber (it was named “TOK”) were successfully
installed in Czech Republic. Installation shows great potential due to short construction time
and easy setup on the field.
Mathematical model shows that the “TOK” has better separation efficiency than conservative
types especially in high flow rates.
Real function and improvement will be visible in the future…
ACKNOWLEDGEMENTS
This works was supported by the project of Ministry of Education, Youth and Sport of Czech
Republic No. MSM 211100002.
LIST OF REFERENCES
EuropeanCommunities. (2000) Directive 2000/60/EC of the European Parliament and of the Council of 23
October 2000 establishing a framework for Community action in the field of water policy. The
European Parliament and of the Council of the European Union.
Fluent Europe Inc. (2002). FLUENT User’s Guide
G. Tchobanoglous, L. Franklin, F. L. Burton (2003) Wastewater Engineering – Treatment and Reuse, McGraw-
Hill Professional
Takeda, Y. (1997). Ultrasonic Doppler Method for Fluid Flow Measurements – Principle and Its Apllications.
Bulletin of the Research Laboratory for Nuclear Reactors, special issue no. 2, 1-14
Pollert, J. - Stránský, D. (2003) Combination of Computational Techniques - Evaluation of CSO Efficiency for
Suspended Solids Separation Water Science & Technology. 2003, vol. 47, no. 04, s. 157-166. ISSN
0273-1223.
10 New type of CSO chamber responds to economic and ecological needsYou can also read