2017 State of U.S. High Tide Flooding with a 2018 Outlook
←
→
Page content transcription
If your browser does not render page correctly, please read the page content below
June 6, 2018

                    2017 State of U.S. High Tide Flooding with a 2018 Outlook

                  William V. Sweet1, Doug Marcy2, Gregory Dusek1, John J. Marra3, Matt Pendleton4
    National Oceanic and Atmospheric Administration (NOAA) Center for Operational Oceanographic Products and
    Services1, NOAA Office of Coastal Management2, NOAA National Centers for Environmental Information3, The
                                               Baldwin Group, Inc.4

Author’s Note
This report assesses the number of days with high tide flooding during 2017 and provides an outlook for
2018. It uses different flood elevation thresholds than in previous reports (Sweet and Marra, 2015; 2016;
Sweet et al., 2017a), which in many locations, now describe deeper and more‐severe flooding (e.g.,
Annapolis, MD, Charleston, SC and Miami, FL regions). The new coastal flood thresholds follow a
nationally consistent pattern inherent to the limited number of NOAA’s National Weather Service (NWS)
minor coastal flood thresholds1 as described in Sweet et al. (2018). The NWS coastal flood thresholds are
used to issue local ‘coastal flood advisories’ for potentially disruptive coastal flooding, whereas the new
thresholds are geared toward assessing national vulnerabilities to tidal flooding with similar impacts
(often disruptive and sometimes damaging). As such, the annual number of days with high tide flooding
(henceforth referred to as flood frequency) may be higher or lower than in previous reports since deeper
(shallower) floods happen less (more) often. Computation of 2017 flood frequencies using the NWS
minor flood thresholds can be readily estimated using verified data and analysis tools of NOAA’s Center
for Operational Oceanographic Products and Services2.

Summary
In 2017, the nation‐wide average annual frequency of high tide flooding as measured at 98 National
Oceanic and Atmospheric Administration (NOAA) tide gauge locations along U.S. coastlines hit an all‐
time record of 6 flood days. More than a quarter (27) of the locations (Alaska sites were not included in
this study) tied or broke their individual records for high tide flood days.

Regionally, high tide flooding in 2017 was most prevalent along the Northeast Atlantic and Western Gulf
of Mexico Coasts in response to active nor’easter and hurricane seasons. Yearly records include 22 days
in Boston, MA3 and Atlantic City, NJ4 and 23 days in Sabine Pass, TX and 18 days in Galveston, TX. Flood
frequencies were also at record levels along parts of the Southeast Atlantic and Eastern Gulf, including
14 days at Bay Waveland, MS and 6 days each in Fort Myers, FL, Cedar Key, FL and Dauphin Island, AL.
High tide flood frequencies were less in other U.S. regions, though San Diego, CA5 experienced a record‐
breaking 13 days.

1
  https://water.weather.gov/ahps/
2
  https://tidesandcurrents.noaa.gov/inundation/
3
  https://www.boston.com/news/local‐news/2017/12/05/the‐king‐tides‐are‐back‐and‐theyre‐causing‐some‐
flooding‐in‐boston‐and‐across‐new‐england
4
  http://www.pressofatlanticcity.com/pac/coastal‐flood‐alert‐upgraded‐road‐closures‐on‐
monday/article_9537c566‐1567‐5fdb‐8ef9‐130b27bca111.html
5
  http://fox5sandiego.com/2017/12/04/king‐tides‐flood‐parts‐of‐national‐city/
                                                       1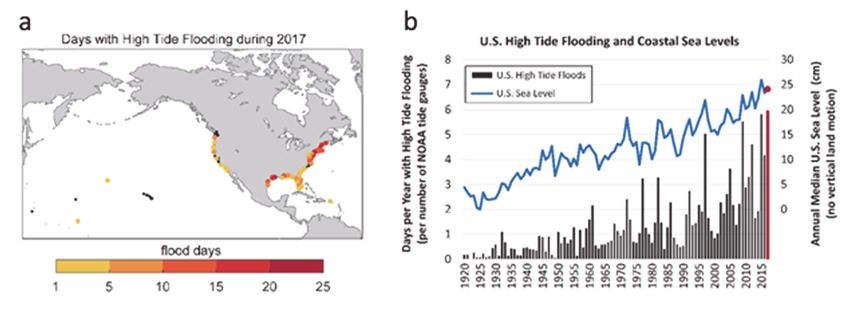
June 6, 2018

Mild El Niño conditions are predicted6 during late 2018 and into 2019, which may result in higher than
expected flood frequencies (e.g., above trend values) at about half (48) of the locations, primarily along
the West and East Coasts. As a whole, high tide flood frequencies during 2018 are predicted to be about
60% higher (median value) across U.S. coastlines as compared to trend values at the start of this century
(i.e., year 2000). Along the Northeast Atlantic and Northwest Pacific Coasts (where steeper topography
often buffers the extent of impacts), 5‐6 days (median values) are predicted or a 100% and 10% increase
since 2000, respectively. Along the flatter and more‐vulnerable Southeast Atlantic and Gulf Coasts,
about 2‐3 flood days are predicted in 2018 or a 160% and 50% increase since 2000, respectively. Along
the Southwest Pacific Coast about 2 days of high tide flooding are predicted (70% increase). Little or no
tidal flooding is expected (as in all cases, not considering wave or rainfall effects) within the Caribbean,
Hawaii or U.S. Pacific Islands (Kwajalein Island being an exception).

If high tide flooding in 2018 follows historical patterns, flooding will be most common during the winter
(Dec‐Feb) along the West Coast and the northern section of Northeast Atlantic Coast in response to
winter storms and more‐predictable monthly highest astronomical tides (predicted tides). Along the
Gulf and along much of the Atlantic Coasts, flood patterns are less predictable and occur usually in
response to weather effects. Flooding is, however, most common during the fall (Sep‐Nov) when the
mean sea level cycle peaks, and more often during monthly highest predicted tides in some Southeast
Atlantic locations.

Breaking of annual flood records is to be expected next year and for decades to come as sea levels rise,
and likely at an accelerated rate (Sweet et al., 2017b). Already, high tide flooding that occurs from a
combination of high astronomical tides, typical winter storms and episodic tropical storms has entered a
sustained period of rapidly increasing trends within about 2/3 of the coastal U.S. locations (Sweet et al.,
2018). Though year‐to‐year and regional variability exist, the underlying trend is quite clear: due to sea
level rise, the national average frequency of high tide flooding is double what it was 30 years ago.

Background and Objectives
This report updates high tide flood frequencies during 2017 (meteorological year: May 2017 – April
2018) at 98 NOAA tide gauges examined by Sweet et al. (2018) and provides a statistical ‘outlook’ for
2018 (May 2018 ‐ April 2019). It is the fourth in a series (Sweet and Marra, 2015; Sweet and Marra,
2016, Sweet et al., 2017a), but different in its expanded geographic coverage and that it does not
necessarily assess the exact coastal elevation thresholds for ‘minor flooding’ set by NOAA’s NWS for
response preparedness (NOAA, 2017a). As a result, the flood frequencies in previous reports will not
necessarily match. NWS flood thresholds are empirically calibrated from years of impact monitoring,
but often for a particular part of a city within a region with variable topography, urbanization and storm‐
proofing. As such, when comparing NWS flood thresholds there exist large differences between 1) flood
elevations (e.g., about a 0.6 m difference between Wilmington, NC and St. Petersburg, FL), 2) severity of
impacts (e.g., primarily storm‐water system infiltration in Wilmington, NC, Washington, D.C., Annapolis,
MD to breaching of major hurricane seawalls in St. Petersburg, FL and Galveston, TX) and 3) flood
frequencies (e.g., 84 days in Wilmington and 0 days in St. Petersburg during 2016).

6
    May 18, 2018 plume: https://iri.columbia.edu/our‐expertise/climate/forecasts/enso/current
                                                         2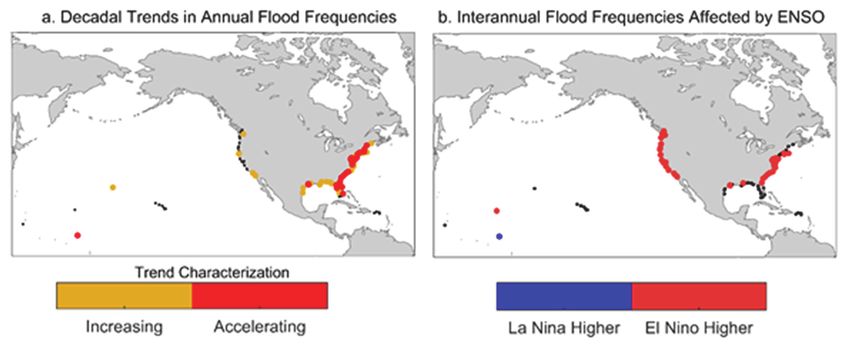
June 6, 2018

Following Sweet et al. (2018), high tide flooding is defined as a coastal water level reaching or exceeding
a median height of 0.54 m (spread of 0.50 – 0.64 m) above the long‐term average daily highest tide
(MHHW; Figure 1a, Appendix 1). Locally, the flood thresholds are higher where tide ranges are higher,
following a nationally consistent pattern inherent to the set of NWS coastal flood thresholds (Figure 1b).
With this consistent definition of high tide flooding, a national assessment of flood risk and vulnerability
to past flooding and planning for future‐anticipated flooding is possible. High tide flooding (aka
nuisance flooding) is typically disruptive and sometimes damaging (e.g., infiltration of storm‐ and waste‐
water systems, flooding of road ways and infrastructure). National patterns based upon tide range also
exist when analyzing existing NWS flood thresholds for moderate/damaging and major/often‐
destructive flooding, which occur at median values of 0.85 m and 1.2 m above MHHW, respectively
(Sweet et al., 2018). Together these thresholds broadly quantify flood‐height vulnerabilities of U.S.
coastal infrastructure in terms of the freeboard remaining above today’s high tide.

Figure 1: a) Elevation thresholds for high tide flooding at 98 NOAA tide gauges recently analyzed by Sweet et al.
(2018) based upon the regression relationship shown in b) as a scatter plot of a national set (about 60 locations) of
NOAA NWS flood thresholds for minor impacts (y‐axis) shown relative to the mean lower low water (MLLW) tidal
datum versus the local diurnal tide range (GT) on the x‐axis. Adapted from Sweet et al. (2018).

To provide a high tide flood outlook, we project into 2018 the expected flood frequencies based upon:
1) a multi‐decadal linear or quadratic regression model fit to the annual number of days with high tide
flooding through time (Figure 2a) or 2) a bivariate regression model that also considers the strength of
the El Niño Southern Oscillation (ENSO, Figure 2b) where applicable (Sweet and Park, 2014; Sweet et al.,
2018). Multi‐model ensemble predictions of ENSO strength for 2018/2019 were obtained from the
International Research Institute for Climate and Society7.

7
    May 18, 2018 plume: https://iri.columbia.edu/our‐expertise/climate/forecasts/enso/current
                                                          3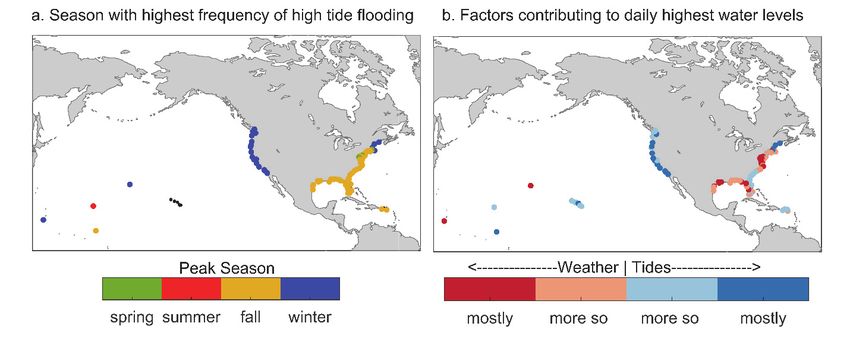
June 6, 2018
Figure 2: a) Characterization of increases in decadal annual high tide flood frequencies (significant above the 90%
significance level): accelerating (quadratic), linear increasing or no trend (black dot) and b) locations whose high
tide flood frequencies change on an inter‐annual basis due to phases of ENSO. Adapted from Sweet et al. (2018).
2017 Conditions
More than a quarter (27) of the 98 U.S. coastal locations examined tied or broke their individual records
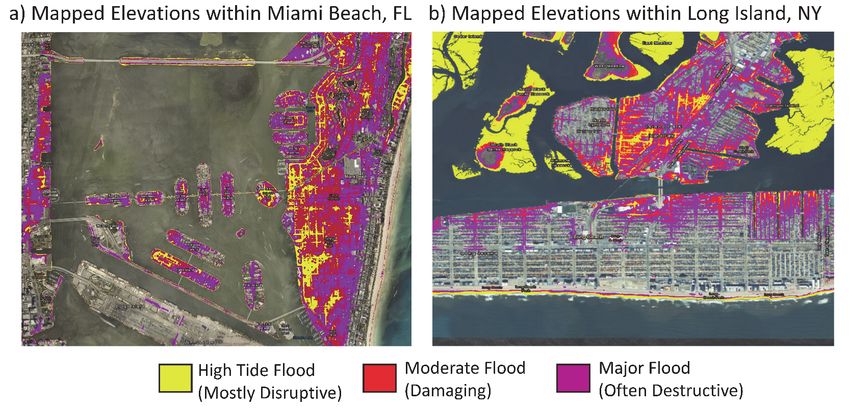
for high tide flooding in 2017 (Appendix 1). Annual frequencies (Figure 3a) were highest along the
Northeast Atlantic and Western Gulf of Mexico (median values of 11 and 12 days, respectively). Record
flood frequencies occurred along much of the coastline between Massachusetts to New Jersey and
along Texas, including 22 days in Boston, MA and Atlantic City, NJ, 23 days in Sabine Pass, TX and 18
days in Galveston, TX. Records were also broken along the Southeast Atlantic and Eastern Gulf,
including 14 days at Bay Waveland, MS, and 6 days each in Fort Myers, FL, Cedar Key, FL and Dauphin
Island, AL and 3 days each in Virginia Key, FL and Naples, FL. High tide flood frequencies were less in
other U.S. regions, though San Diego, CA experienced a record‐breaking 13 days.
When high tide flood frequencies along the entire U.S. coastline are averaged (Figure 3b), the 2017
national average of 6 days (per Appendix 1) is record breaking. Rising ocean levels along the U.S.
coastline (Figure 3b, blue line) of about 2 mm/year since 1920 are driving (along with local land
subsidence) a rapid increase in U.S. high tide flood frequencies. The U.S. average high tide flood
frequency is now 50% greater since 2000 and 100% greater than it was 30 years ago (based upon
quadratic fit of data in Figure 3b, not shown).
4June 6, 2018
Figure 3: a) Number of days with high tide flooding using the nationally consistent flood severity thresholds (Figure
1a) at 98 NOAA tide gauges. Black dots are locations without a flood during 2017. b) Average high tide floods per
year (black bars) through 2017 with 1920‐2016 data from Sweet et al. (2018)8 and the annual median coastal
ocean level (blue line) through 2017 with local vertical land motion removed using estimates from Sweet et al.
(2017b) for locations shown in a). 2017 sea level and flood frequency values in b) are shown in red. High (low) sea
level and flood frequency years in b) such as during 1997 (1988) often correspond to El Niño (La Niña) conditions.
In many regions, 2017 high tide flood frequencies included flooding in response to several strong storms
that produced deeper (and more widespread) flooding than would occur at the local high tide flood
height. During 2017, there were numerous tropical storms or hurricanes that impacted the Caribbean,
Gulf of Mexico, and Southeast Atlantic Coasts; extratropical storms or nor’easters also impacted
Northeast Atlantic coastlines. For example, a strong nor’easter in early January 2018 during a period of
seasonal highest astronomical tides pushed water levels in Boston, MA to a record‐setting 1.49 m above
MHHW9, which is about 0.85 m above the local high tide threshold (Appendix 1). Similarly, water levels
during Hurricane Irma broke 15 NOAA tide gauge records along the Caribbean and Southeast Atlantic
coasts (NOAA, 2017b). Flood depths in Virginia Key, FL (record of 1.12 m above MHHW) during
Hurricane Irma reached a height close to its nationally consistent level for major flooding (1.20 above
MHHW; Sweet et al., 2018) with undoubtedly greater flood extent and severity within the Miami region
than occurs at high tide flood threshold levels (0.53 above MHHW; Figure 4a)10. Near‐record water
levels were also experienced in Hawaii during August 2017 at peak high tide that occurred during
westward propagating and long‐lived high sea level anomalies11. Levels in Honolulu reached
approximately 0.4 m above MHHW, and though some inland flooding and wave over wash did occur and
was reported in media12, the tide gauge‐measured water level did not exceed the local high tide flood
level (0.52 m for Honolulu: Figure 1a, Appendix 1).
8
https://tidesandcurrents.noaa.gov/publications/techrpt86_PaP_of_HTFlooding.csv
9
https://www.bostonmagazine.com/news/2018/01/04/boston‐flooding‐bomb‐cyclone‐2018/
10
http://www.miamiherald.com/news/weather/hurricane/article172495761.html
11
https://uhslc.soest.hawaii.edu/pacific‐sea‐level‐monitoring/
12
https://www.theatlantic.com/science/archive/2017/05/the‐ghost‐of‐climate‐change‐future/528471/
5June 6, 2018
Figure 4: Mapping of elevations at or below the nationally consistent flood severity levels for high tide/disruptive
flooding (0.53 and 0.56 m above MHHW shaded yellow), moderate/damaging levels (0.82 and 0.85 m above
MHHW shaded in red) and major/often‐destructive flooding (1.20 and 1.23 m above MHHW shaded in purple) of
Sweet et al. (2018) for a) Miami Beach, FL and Long Island, NY. Elevations exposed to high tide flooding (and sea
level rise in general) are more extensive within the urbanized sections of Miami Beach than Long Island due to its
flatter and low‐lying topography, which is typical of coastal zones within the Southeast Atlantic.
2018 High Tide Flood Outlook
Mild El Niño conditions are predicted to form during late 2018 and into 2019 (0.5° C average Oceanic
Niño Index value)13. In response, higher than expected (e.g., above trend values) flood frequencies are
predicted at 48 West and East Coast locations (Figure 2) as is illustrated in Figure 5 for San Diego, CA and
Norfolk (Sewells Point), VA. In 2018 (Figure 6a), 5‐6 days (median values) are predicted along the
Northeast Atlantic and Northwest Pacific Coasts where steeper topography may help buffer the spatial
extent of impacts (e.g., Figure 4b). Along the flatter and more‐vulnerable Southeast Atlantic (e.g., Figure
4a) and Eastern and Western Gulf Coasts about 2‐3 days are predicted. About 2 days are predicted
along the Southwest Pacific Coast, with little or no flooding expected (not considering wave or rainfall
effects) within the Caribbean, Hawaii or U.S. Pacific Islands; Kwajalein Island is an exception.
13
May 18, 2018 plume: https://iri.columbia.edu/our‐expertise/climate/forecasts/enso/current
6June 6, 2018
Figure 5: Annual high tide flood frequencies from 1950 to 2017 (black dots) with regression‐based fits over 1950‐
2016 and projected through 2018 in a) San Diego, CA as a linear trend and as a quadratic trend in b) Norfolk, VA.
Also shown are bivariate regressions (red line‐dot) that include ENSO effects (ONI) in addition to the temporal
changes with 2018 Outlooks (yellow diamond) based on an 2018 ONI predicted value of 0.5° C (May 18, 2018:
https://iri.columbia.edu/our‐expertise/climate/forecasts/enso/current). Update to Sweet et al. (2018).
High tide flood frequencies continue to rapidly increase (Figure 2a); in 2018, they are predicted to be
about 60% higher (median value) across U.S. coastlines as compared to frequencies typical in 2000
under ENSO neutral conditions (Figure 6b, Appendix 1). Flood frequencies are rising the fastest along
the Southeast Atlantic Coast (median value of 160%). Rapid increases are also occurring along the
Northeast Atlantic (100%), the Eastern and Western Gulf Coasts (about 50%). The marked increase in
high tide flooding along the Southeast Atlantic versus the Northeast Atlantic Coast, for example, is
problematic as topography along the Southeast Atlantic is flatter and more low lying, which exposes
more infrastructure and populations to flooding (i.e., Figure 4). Along the Southwestern Pacific Coast,
flood frequencies are predicted to be about 70% higher in 2018 than in 2000 due to the predicted mild
El Niño.
Figure 6: a) Number of high tide flood days predicted for 2018 (May 2018 – April 2019) based upon the
combination of statistical models highlighted in Figure 2. In b) is the percent change since 2000 based upon similar
trend fits but for ENSO neutral conditions. Black dots denote locations where high tide flooding still occurs less
than once a year or in some cases has yet to occur.
7June 6, 2018
Seasonality of 2018 High Tide Flooding
Intra‐annual patterns of high tide flooding and the underlying drivers over the last couple of decades (as
in Sweet et al., 2018) are used to identify peak‐flood seasons during 2018. Accordingly, flooding is
expected to be most prevalent during the 2018 winter season (Dec‐Feb) along the West Coast and the
northern section of Northeast Atlantic Coast (Figure 7a). High water levels (that may or may not cause
flooding) in these regions routinely occur during monthly highest predicted tides (Figure 7b). Tide
heights peak during both the winter and summer solstices due to the position of the sun relative to the
earth’s equator. Winter storms, which are less predictable, are also an important factor, especially
when occurring during the days surrounding the highest tides.
Along most of the Northeast and Southeast Atlantic and the Gulf Coasts, high tide flooding is expected
to be most frequent during the fall (Sep‐Nov; Figure 7a) with predicted tides more of a factor along the
Southeast Atlantic (Figure 7b, light blue region) and weather (less predictable) more important
elsewhere (especially regions like the Chesapeake Bay shown as dark red in Figure 7b). Flooding is most
common during the fall from a combination of an annual peak in mean sea level (included in NOAA tide
predictions) and increased wind forcing. Changes in regional winds also influence the transport of
coastal boundary currents like the Gulf Stream, and thus coastal sea levels (Ezer et al., 2017).
In a few locations situated along major river systems (e.g., Washington D.C.) high tide flooding is
predicted to be most frequent during the spring season when river discharge peaks14. For Hawaii and
the U.S. Pacific Islands, and for the U.S. Caribbean Islands, high water levels typically occur during
periods of highest predicted tides, similar to the West and Southeast Atlantic coasts respectively.
However, as the high tide flood thresholds are still above the reach of most historical tide gauge‐
measured water levels, high tide flooding is not predicted to occur in these regions unless directly
impacted by storms or large waves.
Relatively few locations along U.S. coastlines will experience high tide flooding from predicted tides
alone under current sea levels, though in the coming decades predicted tides will routinely flood many
more locations if flood defenses are not enhanced (Sweet et al., 2018). In regions like the U.S. West
Coast and the U.S. Pacific Islands where predicted tides typically dictate the occurrence of high water
levels, seasonal outlooks of mean sea level (e.g., Widlansky et al., 2017)15 and predicted tides16 can help
identify dates with potential high tide flood impacts.
14
https://www.washingtonpost.com/news/capital‐weather‐gang/wp/2018/05/21/raging‐water‐at‐great‐falls‐
flooding‐at‐the‐tidal‐basin‐after‐last‐weeks‐deluge/?utm_term=.6b749f4f3daa
15
https://uhslc.soest.hawaii.edu/sea‐level‐forecasts/
16
https://oceanservice.noaa.gov/news/high‐tide‐bulletin/
8June 6, 2018
Figure 7: a) Season (spring: Mar‐May; summer: Jun‐Aug; fall: Sep‐Nov; winter: Dec‐Feb) with highest percentage of
high tide flood days experienced over 1998–2016 with b) four categories based upon the ratio between variances
of daily highest predicted tidal component of water level to observed water levels for 1998–2016 daily highest
water levels. Adapted from Sweet et al. (2018).
Acknowledgements
The authors acknowledge the NOAA Center for Operational Oceanographic Products and Services Data
Processing Team for verifying the hourly water level data for the stations presented in this report and
the NOAA Office of Coastal Management for mapping of the nationally consistent flood thresholds.
References
Ezer, T., L. P. Atkinson and R. Tuleya (2017). Observations and operational model simulations reveal the
impact of Hurricane Matthew (2016) on the Gulf Stream and coastal sea level. Dynamics of
Atmospheres and Oceans, 80, pp.124‐138.
NOAA (2017a). National Weather Service Instruction 10‐320. Surf Zone Forecast and Coastal/Lakeshore
Hazard Services. http://www.nws.noaa.gov/directives/sym/pd01003020curr.pdf
NOAA (2017b). Hurricane Irma. NOAA Water Level and Meteorological Data Report. National Oceanic
and Atmospheric Administration, National Ocean Service, Silver Spring, MD. 44pp.
https://tidesandcurrents.noaa.gov/publications/2017_Hurricane_Irma_Report_Final.pdf
Sweet, W.V. and J. Park (2014). From the extreme to the mean: Acceleration and tipping points of
coastal inundation from sea level rise. Earth's Future, 2, 579‐600.
http://dx.doi.org/10.1002/2014EF000272
Sweet, W.V. and J. Marra (2015). 2014 State of U.S. Nuisance Tidal Flooding. Supplement to State of the
Climate: National Overview for August 2015. National Oceanic and Atmospheric Administration,
National Centers for Environmental Information, 9 pp. https://www.ncdc.noaa.gov/monitoring‐
content/sotc/national/2015/aug/sweet‐marra‐nuisance‐flooding‐2015.pdf
9June 6, 2018
Sweet, W.V. and J.J. Marra (2016). 2015 State of U.S. Nuisance Tidal Flooding. Supplement to State of
the Climate: National Overview for May 2016. National Oceanic and Atmospheric Administration,
National Centers for Environmental Information, 5 pp. https://www.ncdc.noaa.gov/monitoring‐
content/sotc/national/2016/may/sweet‐marra‐nuisance‐flooding‐2015.pdf
Sweet, W.V., J. J. Marra and G. Dusek (2017a). 2016 State of U.S. High Tide Flooding and a 2017 Outlook.
Supplement to State of the Climate: National Overview for May 2017, published online June 2017,
https:/www.ncdc.noaa.gov/monitoring‐
content/sotc/national/2017/may/2016_StateofHighTideFlooding.pdf
Sweet, W.V., R.E. Kopp, C.P. Weaver, J. Obeysekera, R.M. Horton, E.R. Thieler, and C. Zervas (2017b).
Global and Regional Sea Level Rise Scenarios for the United States. NOAA Tech. Rep. NOS CO‐OPS
083. National Oceanic and Atmospheric Administration, National Ocean Service, Silver Spring, MD.
75pp. https://tidesandcurrents.noaa.gov/publications/techrpt83_Global_and_Regional_SLR_Scenari
os_for_the_US_final.pdf
Sweet, W.V., G. Dusek, J. Obeysekera, J. Marra (2018). Patterns and Projections of High Tide Flooding
Along the U.S. Coastline Using a Common Impact Threshold. NOAA Tech. Rep. NOS CO‐OPS 44p.
https://tidesandcurrents.noaa.gov/publications/techrpt86_PaP_of_HTFlooding.pdf
Widlansky, M. J., J. J. Marra, M. R. Chowdhury, S. A. Stephens, E. R. Miles, N. Fauchereau, C. M. Spillman,
G. Smith, G. Beard and J. Wells (2017). Multimodel Ensemble Sea Level Forecasts for Tropical Pacific
Islands. Journal of Applied Meteorology and Climatology, 56(4), pp.849‐862.
10June 6, 2018
Appendix 1: U.S. Regions, tide gauge location information and NOAA ID, high tide flood threshold (meters above
MHHW) based upon the national pattern of Sweet et al. (2018), annual high tide flood frequency record through
2016, high tide flood frequency typical of year 2000 based upon trend fits, high tide flood frequencies measured in
2017 (May 2017 – April 2018), the 2018 predicted outlook ± 1 standard deviation, the season when flooding has
historically peaked and main factors producing high water levels
11June 6, 2018 12
You can also read