Sullolk - Healthy Suffolk
←
→
Page content transcription
If your browser does not render page correctly, please read the page content below

Sullolk
 �

SBCJ
Date created: February 2021

Author: Tom Delaney, Senior Alliance JSNA Researcher

Contents
Introduction ............................................................................................................................................ 3

   Why do we need to tackle obesity? .................................................................................................... 4

Obesity in Suffolk .................................................................................................................................... 4

Obesity at a local level: looking at obesity by GP practice ..................................................................... 5

   Ipswich and East Suffolk Clinical Commissioning Group (IESSCG) ...................................................... 5

   West Suffolk Clinical Commissioning Group (WSCCG) ....................................................................... 7

   Norfolk and Waveney Clinical Commissioning Group (NWCCG) ........................................................ 8

Mapping obesity across Suffolk .............................................................................................................. 9

Obesity linked to deprivation................................................................................................................ 10

National Children's Measurement Programme .................................................................................... 11

   Childhood obesity linked to deprivation........................................................................................... 13

Mapping childhood obesity .................................................................................................................. 14

Linking obesity to environmental factors: fast food outlets................................................................. 16

An evidence-led approach to targeting obesity in Suffolk.................................................................... 18

   Summarising the literature ............................................................................................................... 18

   Priority groups: targeting through GP practices ............................................................................... 18

   Priority groups: targeting through geographies ............................................................................... 20

Appendix 1: IMD 2019 score and decile ............................................................................................... 24

References ............................................................................................................................................ 24

                                                                                                                                                         2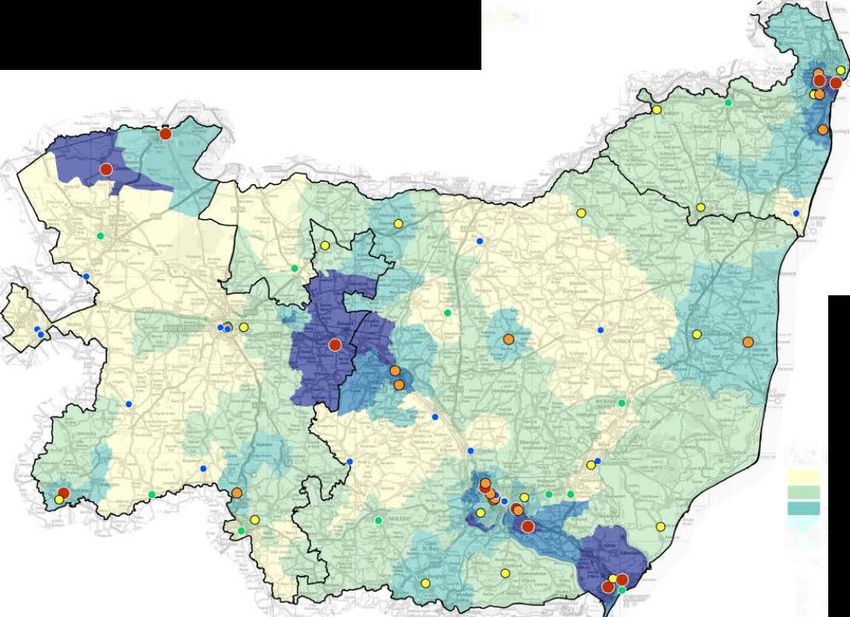
Introduction
Public Health England's (PHE's) Whole systems approach to obesity: a guide to support local
approaches to promoting a healthy weight is a professional resource that is designed to support
local action to address obesity. The guide describes a 'how to' process, which can enable local
authorities, and their partners, to start creating their own local whole systems approaches to
reducing obesity and promoting a healthy weight.

Suffolk adopted the whole system approach to childhood and adulthood weight management in
2017, and were also part of the PHE pilot to develop the now published guidance. The subsequent
Tackling Childhood Obesity in Suffolk 2019-2023 Strategy and whole system approach to childhood
and adulthood weight management have been endorsed by the Suffolk Health and Wellbeing Board.

This report revisits 'Phase 2: Building the local picture' of the PHE Whole System Approach. That is,
understanding the local picture of obesity, including its prevalence, the local impact, relevant
organisations and people, community assets and existing actions to address it.

The rationale for this report is:

    1. To collate key information about obesity locally.
    2. To establish a comprehensive overview of targeting approaches based on data.
    3. To aid in the conversations regarding identifying the departments, local organisations and
       individuals currently engaged in supporting work around obesity.

Figure 1: l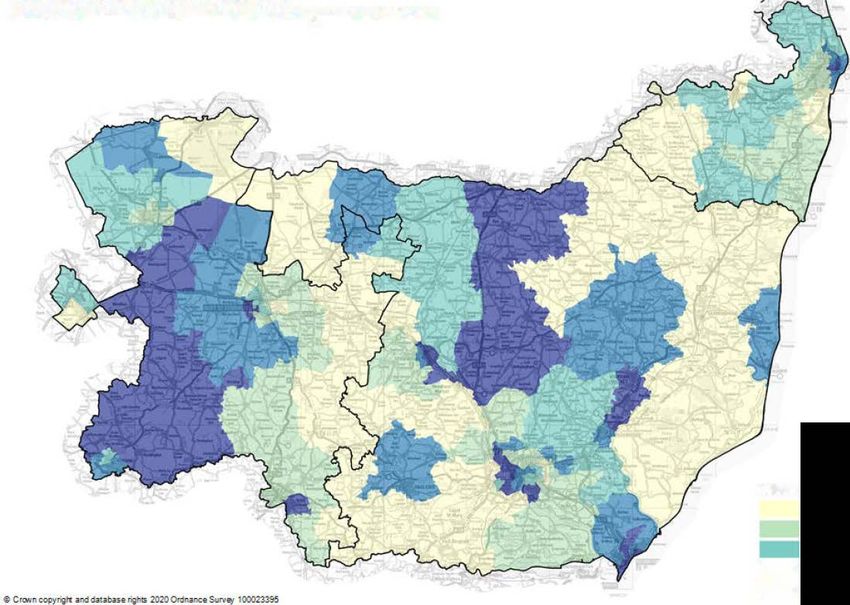
Why do we need to tackle obesity?
Tackling obesity is one of the greatest long-term health challenges this country faces. Today, around
two-thirds (62.3%) of adults in England are above a healthy weight. There are also 1 in 3 (35.2%)
children leaving primary school who are already overweight or obese, with 1 in 5 (21.0%) living with
obesity 1.

Obesity is associated with reduced life expectancy. It is a risk factor for a range of chronic diseases,
including cardiovascular disease, type 2 diabetes, at least 12 kinds of cancer, liver and respiratory
disease2, and obesity can impact on mental health. Additionally, obesity prevalence is highest
amongst the most deprived groups in society3 . Children in the most deprived parts of the country
are more than twice as likely to be obese as their peers living in the richest areas. This is sowing the
seeds of adult diseases and health inequalities in early childhood.

England's rates of obesity are storing up future problems for individuals and our NHS. But
worryingly, there is now consistent evidence that people who are overweight or living with obesity
who contract coronavirus (COVID-19) are more likely to be admitted to hospital, to an intensive care
unit and, sadly to die from COVID-19 compared to those of a healthy body weight status4 • One
study found that for people with a BMI of 35 to 40, risk of death from COVID-19 increases by
40.0% and with a BMI over 40 by 90.0%, compared to those not living with obesity. Other
data found that in intensive care units, 7.9% of critically ill patients with COVID-19 had
a BMI over 40 compared with 2.9% of the general population 5 • Therefore, obesity has become
an immediate concern for anyone who is overweight and for our health and care services.

Obesity in Suffolk
Suffolk has seen an increase in the proportion of adults (18+) registered to a GP practice recorded as
clinically obese over the last three years, rising from 10.4% in 2017 /18 to 11.5% in 2019/20. A similar
trend can be seen across England, where the prevalence of obesity has gone from 9.8% in 2017 /18
to 10.5% in 2019/20 (see figure 2).

The Norfolk and Waveney CCG (NWCCG) has continually shown a significantly higher prevalence of
obesity compared to England from 2017/18 (11.7% compared to 9.8%, respectively) through to
2019/20 (12.2% compared to 10.5%, respectively) 1 . The Suffolk-based GP practices in NWCCG have
had the highest prevalence of obesity from 2017 /18 to 2019/20 compared to other Suffolk CCGs (see
figure 2).

As with the NWCCG, the Ipswich and East Suffolk CCG (IESCCG) has also shown a significantly higher
prevalence of obesity compared to England from 2017 /18 (10.9% compared to 9.8%, respectively) to
2019/20 (11.6% compared to 10.5%).

The West Suffolk CCG (WSCCG) has historically had a significantly lower prevalence of obesity
compared to England; in 2017 /18 the WSCCG obesity prevalence was 9.1 % compared to 9.8% across
England, while in 2018/19 the WSCCG obesity prevalence was 9.4% compared 10.1%, respectively.
However, in 2019/20 the WSCCG presented a significantly higher prevalence of obesity compared to
England (10.8% compared to 10.5%, respectively).

1 Please note that the NWCCG data is based on Suffolk-based GP practices only. Norfolk-based GP practices
have been omitted from the data.

                                                                                                            4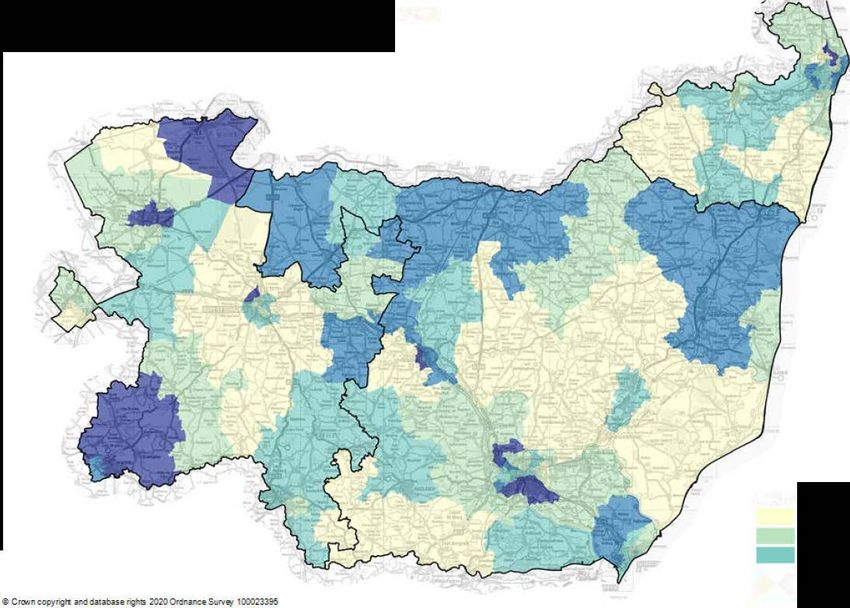
Figure 2: Percentage of patients aged 18 and over with a BMI greater than or equal to 30 in
the previous 12 months, England, Suffolk, CCGs, 2017 /18 to 2019/20

                                                       •
                                                           .
          13.0%

                              �- - · - · - - - ·--· -·- -·..- • --=O
          12.0%
          11.0%

                                                  --   ••••-:.�
                                                     ..�       .. .--·4
                              .....•....-..... - ....
                                           - ....
          10.0%
                                                           •
           9.0%
           8.0%
           7.0%
                            2017/18                     2018/19                      2019/20
   -• •IESCCG                10.9%                       11.5%                        11.6%
   ••••WSCCG                 9.1%                         9.4%                        10.8%
   �NWCCG                    11.7%                        12.3%                       12.2%
   �Suffolk                  10.4%                        11.0%                       11.5%
   �-England                 9.8%                        10.1%                        10.5%

                                               Source: NHS Digital, Quality Outcome Framework, 2020

Obesity at a local level: looking at obesity by GP practice
Looking at adult obesity by CCG and GP practice allows for local stakeholders to understand where
there is a need for intervention or collaboration in their area. The following section looks to identify
the significantly higher and lower prevalence of obesity by CCG and GP practice.

Ipswich and East Suffolk Clinical Commissioning Group (IESSCG}
Based on the 2019/20 QOF, there were 38,464 patients across IESCCG aged 18 and over with a BMI
greater than or equal to 30 in the previous 12 months. 13 GP practices in IESCCG presented a higher
proportion of patients aged 18 and over with a BMI greater than or equal to 30 in the previous 12
months compared to England (10.5%) and IESCCG (11.6%).

14 GP practices in IESCCG had a significantly lower prevalence of clinical obesity compared to
England and IESCCG (see figure 3).

                                                                                                           5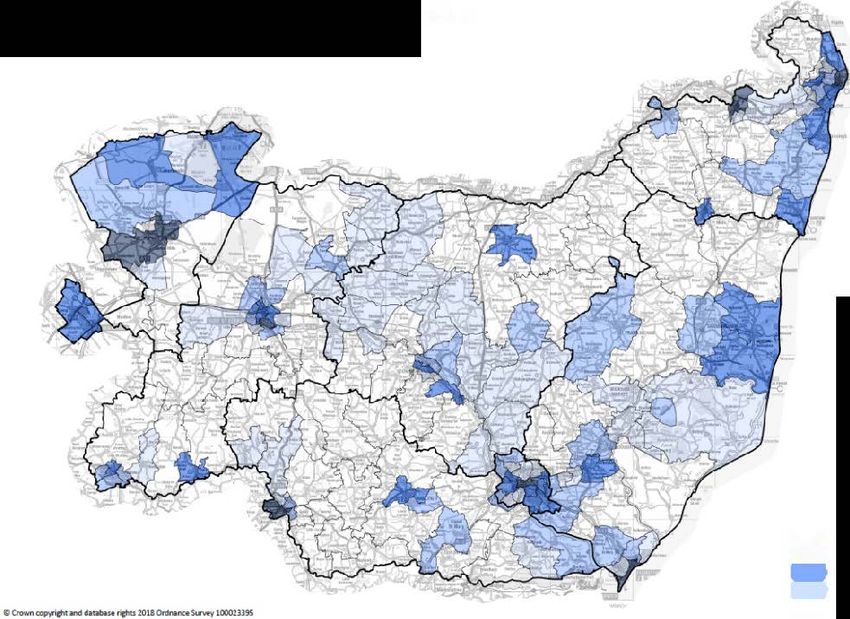
Figure 3: Percentage of patients aged 18 and over with a BMI greater than or equal to 30 in
the previous 12 months, GP practices with IESCCG, QOF 2019/20

                       Framlingham Surgery                                   • 6.9%
          Dr Salway & Dr Mallick Practice                                        • 7.9%
          The Barham & Claydon Surgery                                           I 8.0%
                          Eye Health Centre                                        ■ 8.4%
                    Bildeston Health Centre                                        • 8.5%
               lvry Street Medical Practice                                         • 8.6%
       Needham Market Country Practice                                               • 8.8%
               Little St John Street Surgery                                          • 9.2%
                            lxworth Surgery                                           • 9.3%
                        Martlesham Surgery                                             ■ 9.4%
                  Orchard Medical Practice                                             • 9.4%
                     Howard House Surgery                                               • 9.7%
               The Birches Medical Centre                                               • 9.7%
              Mendlesham Medical Group                                                  • 9.7%
        Wickham Market Medical Centre                                                      10.0%
         Hadleigh Boxford Group Practice                                                    10.1%
                             Walton Surgery                                                 10.2%
                   Framfield House Surgery                                                  10.3%
                                    England                                                I 10.5%
              Fressingfield Medical Centre                                                   10.6%
                Two Rivers Medical Centre                                                     10.6%
       The Holbrook and Shatley Practice                                                      10.7%
                     The Peninsula Practice                                                    10.8%
                    Hawthorn Drive Surgery                                                     • 11.4%
                                     IESCCG                                                    J 11.6%
              Saxmundham Health Centre                                                          • 11.7%
 Constable Country Rural Medical Practice                                                       • 11.7%
                 Debenham Group Practice                                                            12.2%
             Barrack Lane Medical Centre                                                             12.3%
                             Leiston Surgery                                                       I 12.4%
                   Burlington Road Surgery                                                           • 12.8%
                The Norwich Road Surgery                                                              • 13.0%
                                 Stowhealth                                                             13.1%
        Felixstowe Road Medical Practice                                                                13.2%
           The Chesterfield Drive Practice                                                               13.3%
                        Combs Ford Surgery                                                              • 13.7%
                        Deben Road Surgery                                                                 • 14.6%
            Ravenswood Medical Practice                                                                        • 15.7%
                   The Derby Road Practice                                                                      • 15.9%
                               Haven Health                                                                      ■ 16.1%
                      Grove Medical Centre                                                                          ■ 17.1%
                                            0.0%     2.0%      4.0%   6.0%     8.0% 10.0% 12.0% 14.0% 16.0% 18.0%

                                                             Source: NHS Digital, Quality Outcome Framework, 2020

                          Significantly lower than CCG
                          Significantly lower than CCG and England
                          Significantly lower than England
                          Significantly higher than England
                          Significantly higher than CCG and England
                          Significantly higher than CCG

                                                                                                                              6
West Suffolk Clinical Commissioning Group (WSCCG}
Based on the 2019/20 QOF, there were 22,494 patients across WSCCG aged 18 and over with a BMI
greater than or equal to 30 in the previous 12 months. 9 GP practices in WSCCG presented a higher
proportion of patients aged 18 and over with a BMI greater than or equal to 30 in the previous 12
months compared to England (10.5%) and WSCCG (10.8%).

14 GP practices in WSCCG had a significantly lower prevalence of clinical obesity compared to
England and WSCCG (see figure 4).

Figure 4: Percentage of patients aged 18 and over with a BMI greater than or equal to 30 in
the previous 12 months, GP practices with WSCCG, QOF 2019/20

                          Oakfield Surgery       6.3%           i
                         Angel Hill Surgery       6.6%           i
                           Victoria Surgery       6.7%           i
                      The Reynard Surgery          7.1%
             The Rookery Medical Centre
                 Brandon Medical Practice
                   Wickhambrook Surgery
                        Glemsford Surgery
                              Swan Surgery
                           lxworth Surgery
                    Clare Guildhall Surgery
                   Orchard House Surgery
         Hardwicke House Group Practice
                     Market Cross Surgery
                                   England              10.5%

                                           r:-----------..
                                           ____________ ..
                                    WSCCG                10.8%
                              Siam Surgery               10.8%
 Christmas Maltings and Clements Practice
                  Botesdale Health Centre
                      Mount Farm Surgery
                           Stanton Surgery
        The Guildhall and Barrow Surgery
                The Long Melford Practice                     12.7%
                  HaverhiII Family Practice                       14.1%
                       Lakenheath Surgery                             15.6%
                             Forest Surgery                           15.8%
                    Woolpit Health Centre --------------------- 21.9%

                                        0.0%             5.0%        10.0%     15.0%      20.0%     25.0%

                                                        Source: NHS Digital, Quality Outcome Framework, 2020

                     Significantly lower than CCG
                     Significantly lower than CCG and England
                     Significantly lower than England
                     Significantly higher than England
                     Significantly higher than CCG and England
                     Significantly higher than CCG

                                                                                                            7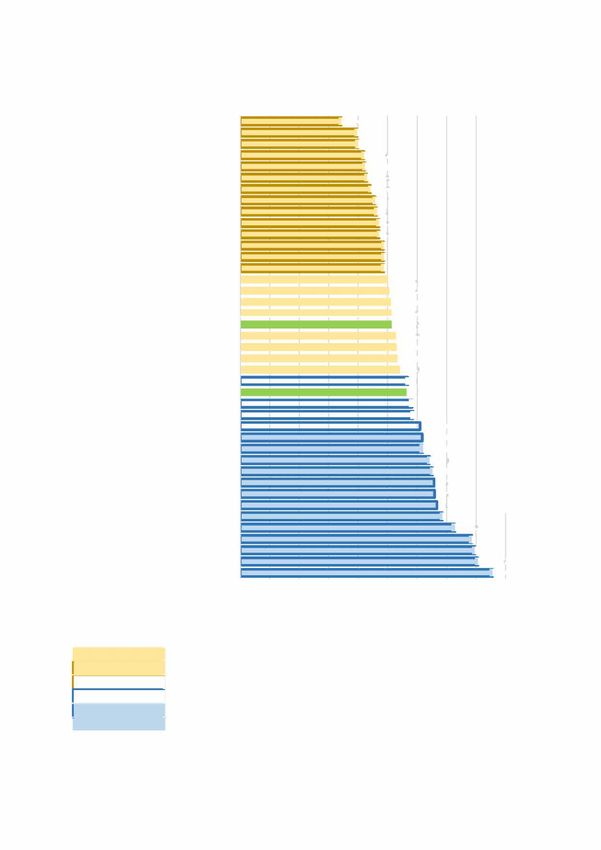
Norfolk and Waveney Clinical Commissioning Group (NWCCG)
For the purpose of this report, only Suffolk-based GP practices are included in the NWCCG figures
below.

Based on the 2019/20 QOF, there were 23,454 patients across Suffolk-based NWCCG GP practices
aged 18 and over with a BMI greater than or equal to 30 in the previous 12 months. 9 GP practices in
NWCCG presented a higher proportion of patients aged 18 and over with a BM I greater than or
equal to 30 in the previous 12 months compared to England (10.5%) and NWCCG (10.8%).

4 Suffolk-based GP practices in NWCCG had a significantly lower prevalence of clinical obesity
compared to England and NWCCG (see figure 5).

Figure 5: Percentage of patients aged 18 and over with a BMI greater than or equal to 30 in
the previous 12 months, GP practices with NWCCG, QOF 2019/20

              Fleggburgh Surgery                                                                                                           8.7%
                    Sole Bay H/C                                                                                                            8.8%
              High Street Surgery
         Beaches Medical Centre ��������������.. 10.0%
          Beccles Medical Centre                 10.1%
                        England                    10.5%
              Cutlers Hill Surgery                                                                                                                              10.6%
          Bungay Medical Centre                                                                                                                                  10.7%
                         NWCCG                                                                                                                                            11.4%
                                     ;;;;;;;;;;;;;;;;;;;;;;;;;;;;;;;;;;;;;;;;;;;;;;;;;;;;;;;;;;;;;;;;;;;;;;;;;;;;;;;;;;;;;;;;;;;;;;;;;;;;;;;;;;;;;;;;;;;;;;;;;;;;;;;;;_
                Rosedale Surgery                                                                                                                                          11.4%
 Alexandra & Crestview Surgeries                                                                                                                                          11.5%
       The Millwood Partnership                                                                                                                                                   12.9%
             Bridge Road Surgery
               and aman Surgery                                                                                                                                                      13.7%
    East Norfolk Medical Practice                                                                                                                                                    13.8%
             Longshore Surgeries                                                                                                                                                     13.9%
                The Park Surgery                                                                                                                                                     13.9%
         Coastal Villages Practice                                                                                                                                                    14.0%
           Victoria Road Surgery
       Kirkley Mill Health Centre _______________________.. 16.4%

                                 0.0%                2.0%                  4.0%                   6.0%                  8.0%                 10.0%                  12.0%         14.0%   16.0%   18.0%

                                                                                   Source: NHS Digital, Quality Outcome Framework, 2020

                         Significantly lower than CCG
                         Significantly lower than CCG and England
                         Significantly lower than England
                         Significantly higher than England
                         Significantly higher than CCG and England
                         Significantly higher than CCG

                                                                                                                                                                                                          8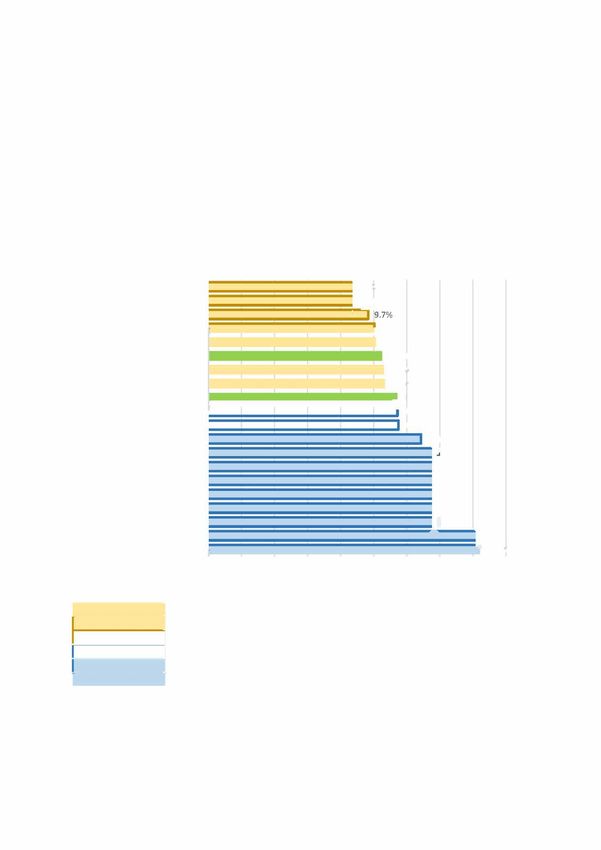
Mapping obesity across Suffolk
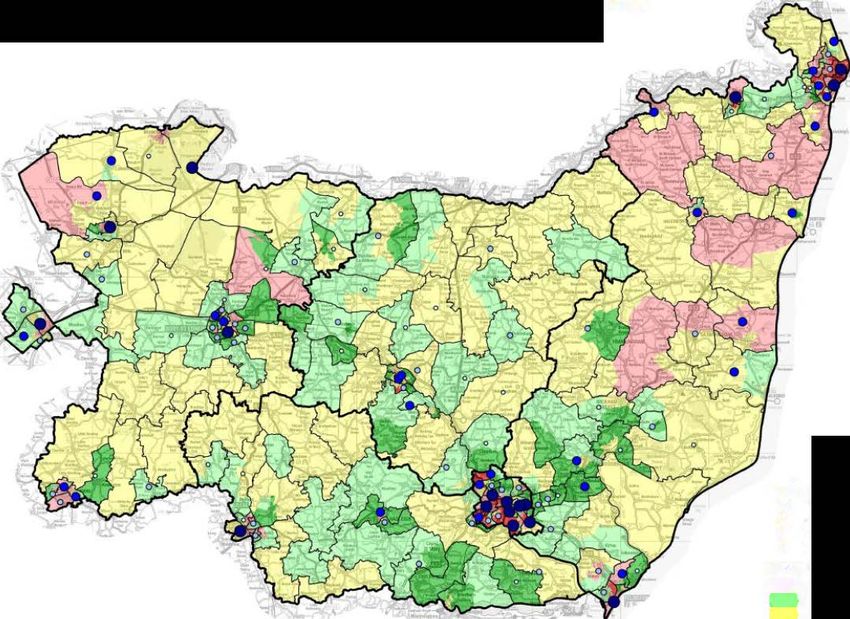
Obesity prevalence has been mapped across Suffolk's middle-layer super outputs areas (MSOAs)
using QOF obesity prevalence data seen above in conjunction with GP patients addresses.
Additionally, the obesity prevalence for all Suffolk-based GP practices has been overlayed to provide
a comparator between GP practices in Suffolk.
The map shows that there is a higher prevalence of clinically obese adults in Mildenhall, Bury St
Edmunds, areas of Ipswich, Felixstowe, and areas of Lowestoft (see figure 6).
Figure 6: Proportion of registered GP patients who are clinically obese, by Middle-layer
Super Output Area (MSOA) and GP practice location, QOF 2019-20
Proportion of registered patients who are obese by General
Practice location and apportioned to patient population distribution
Source: QOF 2019/20
Obesity by GP practice 1ppljtd lo
pabfflt popu&a!lon d�tribul»n
6.9% to
Obesity linked to deprivation
Findings from Public Health England published in December 2019 found that adult obesity in England
was associated with neighbourhood deprivation. In the least deprived areas 20% of adults were
obese compared to 36% of adults living in the most deprived areas3• A similar positive trend
between obesity and deprivation can be seen across Suffolk (see figure 7).

Figure 7 uses the Indices of Deprivation 2019, organised across seven distinct domains 2, to calculate
an overall measure of multiple deprivation experienced by patients registered to each GP practice in
Suffolk. The data presents a clear trend; higher relative deprivation is linked to a higher prevalence
of obesity.

GP practices such as the Martlesham Surgery (7.35, IMD decile 9) and the Birches Medical Centre
(7.21, IMD decile 9) have a significantly lower prevalence of obesity (9.4% and 9.7%, respectively)
compared to England (10.5%) and their respective CCG, IESCCG (11.6%). While GP practices that are
relatively more deprived such as The Park Surgery (44.29, IMD decile 1) and the Kirkley Mill Health
Centre (43.19, IMD decile 2) have a significantly higher prevalence of clinical obesity (13.9% and
16.4%, respectively) compared to England (10.5%) and their respective CCG, NWCCG (11.4%).

Figure 7: Percentage of patients aged 18 and over with a BMI greater than or equal to 30 in
the previous 12 months by GP practice (QOF,2019/20) and deprivation score (IMD 2019)

          25

                                •
                                 .'� . •.•...•..,. ..•.
    0
                                                                                                        y = 0.1077x + 9.1305
          20                                                                                                 R2 = 0.0943
    0

                                                                                                      •
    u..
    0

                                                                                                          •
    v,'
    z  15

                             •• ·� M            •      ••
    LU

                                       •
    a.

                                     •
                   - --.. •�:�rt•••�• • - - - ♦ - - - --
    LU
          10

                            •••
    LU

    0
    u..
    0
    z
    0     5
    et:
    0
    a.
    0
    et:
    a.    0
               0       5        10        15        20         25         30        35         40         45         so
                                                        DEPRIVATION 2019

                    ♦ Proportion of obese patients(%)            -- Linear(Proportion of obese patients(%))

Note: each scatter plot represents a GP practice in Suffolk. The deprivation score for each GP practice has been taken from
Public Health England's Fingertips dashboard (IMD, 2019). O represents the least deprived while SO represents the most
deprived relative to England.

                                               Source: PHE Fingertips and Quality Outcome Framework, 2020

2
 Income Deprivation, Employment Deprivation, Health Deprivation and Disability, Education, Skills
and Training Deprivation, Barriers to Housing and services, Living Environment Deprivation and
Crime.

                                                                                                                          10
National Children's Measurement Programme
The National Child Measurement Programme (NCMP) measures the height and weight of children in
Reception Year class (aged 4 to 5) and year 6 (aged 10 to 11), to assess overweight and obesity levels
in children within primary schools.
The data can be used nationally to support local public health initiatives, and locally to inform the
planning and delivery of services for children. The programme was set up in line with the
government's strategy to tackle obesity, and to:
• inform local planning and delivery of services for children;
• gather population-level data to allow analysis of trends in growth patterns and obesity;
• increase public and professional understanding of weight issues in children; and
• be a vehicle for engaging with children and families about healthy lifestyles and weight
issues.
Heights and weights are measured and used to calculate a Body Mass Index ( BMI) centile. The
measurement process is overseen by trained healthcare professionals in schools.
It must be noted that COVID-19 affected NCMP data collection for the 2019/20 reporting period.
Firstly, the Reception Year total for number children measured was 4,155 compared to the previous
year total of 7,489, a 22.2% reduction. While Year 6 data collection was not significantly affected due
to the majority of measurements completed by December 2019 (7,387 in 2018/19 compared to
7,250 in 2019/20 - a reduction of 4.2%).
Results from the 2019/20 academic year indicate that prevalence of overweight and obesity in
Reception Year children (aged 4 to 5) is lower in Suffolk (21.6%) than England (23.0%) and similar to
the East of England (21.8%) 6• Similarly, the prevalence of overweight and obesity in Year 6 children
(aged 10 to 11) is lower in Suffolk (31.7%) than England (35.2%) and similar to the East of England
(32.7%). Despite performing better than England it is important to note that nearly 1 in 3 (31.7%)
Year 6 students in Suffolk are above the recommended healthy weight (see figure 8).
Variation is seen in the prevalence of overweight and obesity between the districts/boroughs in
Suffolk, with lower prevalence in the less deprived areas and higher prevalence in the more deprived
areas (including Ipswich). Please note that the figures provided in figures 8, 9 and 10 will differ to
NHS Digital. This report has used pupils' postcodes to proportion the prevalence of overweight and
very overweight children rather than the NHS Digital methodology which uses the pupil's school
postcode.
11Figure 8: Prevalence of overweight or very overweight children among Reception Year and
Year 6 age children, Suffolk, districts, and boroughs, 2019/20
----------
40.0%
35.0%
30.0%
- - -...r'l....l""t - - ----
25.0%
20.0%
-
15.0%
10.0%
5.0%
27.6% 31.4%
0.0%
Babergh East Suffolk Ipswich Mid Suffolk West Suffolk
- Reception - Year 6 - - Suffolk R - - Suffolk Yr6
Source: National Childhood Measurement Programme (NCMP), 2020
Figure 9: Prevalence of overweight or very overweight children among Reception Year
children, Suffolk districts and boroughs, 2017/18 to 2019/20
30.0%
25.0%
20.0%
15.0%
10.0%
5.0%
0.0%
2017/18 2018/19 2019/20
■ Babergh 21.3% 20.8% 16.3%
■East Suffolk 20.0% 16.0% 19.7%
■ I pswich 20.2% 22.3% 24.9%
■ Mid Suffolk 21.2% 20.6% 19.7%
■ West Suffolk 20.6% 22.1% 23.5%
Source: National Childhood Measurement Programme (NCMP), 2020
12Figure 10: Prevalence of overweight or very overweight children among Year 6 children,
Suffolk districts an d boroughs, 2017/18 to 2019/20
40.0%
35.0%
30.0%
25.0%
20.0%
15.0%
10.0%
5.0%
0.0%
2017/18 2018/19 2019/20
■ Babergh 31.6% 29.8% 27.6%
■ East Suffolk 30.1% 28.7% 29.2%
■ Ipswich 34.8% 34.6% 37.4%
■ Mid Suffolk 30.9% 27.7% 31.4%
■ West Suffolk 30.5% 30.0% 31.4%
Source: National Childhood Measurement Programme (NCMP), 2020
Childhood obesity linked to deprivation
In 2016, the Government launched 'Childhood Obesity: A Plan for Action17, which set out a number
of actions primarily focused on reducing sugar consumption and increasing physical activity among
children. In June 2018, an update to the action plan was published, setting a national ambition to
"halve childhood obesity and reduce the gap in obesity between children from the most and least
deprived areas by 2030"8• Suffolk has a Childhood Obesity Action Plan that is currently being
refreshed at the time of writing this report.
There is a strong association between deprivation and obesity in children. In 2019/20, the
prevalence of obesity in children Reception Year class (aged 4 to 5) was almost twice as high in the
most deprived areas of Suffolk (16.2%) compared to the least deprived areas of Suffolk (8. 7%).
Similarly, the prevalence of obesity in Year 6 children (aged 10 to 11) was more than twice as high in
the most deprived areas (35.3%) of Suffolk compared to the least deprived areas of Suffolk (17.3%)
(see figure 11).
13Figure 11: Prevalence of overweight or very overweight children among Reception Year and
Year 6 age children by IMD decile, 2019/20
40.0%
35.3%
35.0%
�---
• • • a9.zy'll 28.7%
30.0% • ·--•...•• • • - 27.1%
,., • • • •
20.-� 24.6% 23.7%
25.0% ••• ••••
21.9%
;, ... ,. . ,... j"· j . ii . j· ' i"'-���.
19.6%
20.0% 18 1% •�
15.0%
10.0%
5.0%
0.0%
1 2 3 4 5 6 7 8 9 10
- Year 6 - Reception • • • • • Linear (Year 6) • • • • • Linear (Reception)
Note: figure 8 presents the I M D decile attributed to Suffolk-based students' home postcode. Students who reside outside
of Suffolk were omitted from the data presented in figure 8. 1 represents the most deprived decile while 10 represents the
least deprived decile.
Source: National Childhood Measurement Programme (NCMP), 2020
M a p p i n g c h i l d hood obesity
NCMP data has been used at MSOA level to map the prevalence of overweight or very overweight
children at Reception Year age (aged 4 to 5 - see figure 12) and year 6 (aged 10 to 11 - see figure
13).
In Reception Year age children (aged 5 to 6) the highest proportions of overweight or very
overweight children (18.0% toFigure 12: Prevalence of overweight or very overweight children among Reception Year age
children by MSOA, N C M P 2019/2020
Childhood obesity at reception year
Source: National Child Measurement Programme 201 9/20
Legend
0% loLinking obesity to envi ronm enta l factors: fast food outlets
Obesity is not a binary trade-off caused by excessive calorie intake, reduced physical activity and
increased sedentary lifestyle, it's often associated to - and exacerbated by - environmental factors.
These include psychological mediators (e.g. emotions, self-regulation, perceived environment),
socio-economic status (e.g. income, deprivation) and local/national settings (e.g. advertising, access
to food retailers/service outlets, food labelling, cultural setting and policy) 9. Poor health literacy (e.g.
education on health risks) can also be considered as a contributing factor. Together, these can create
and favour 'obesogenic' behaviours and an environment which promotes excessive weight gain10•
Nationally and locally, we know overweight and obesity levels are higher in children and adults from
neighbourhoods facing higher levels of relative deprivation, and it's concerning to see Public Health
England analysis which shows that there are more fast food outlets in many of these deprived areas
on average 11•
Mapping fast food outlets across Suffolk by ward and deprivation shows a similar trend to Public
Health England's national analysis 11 : areas of higher relative deprivation have a higher number of
fast food outlets (see figure 15).
The highest proportion of food outlets per 1,000 of the population across Suffolk wards were located
in and around Mildenhall, Bury St Edmunds, Sudbury, Ipswich, Felixstowe, Beccles, and Lowestoft (all
2 to 4.6 fast food outlets per 1,000 residents - see figure 14).
16Figure 14: Fast food outlets per 1,000 population in Suffolk by Ward, P H E 2017
Fast food outlets per 1,000 population in Suffolk by Ward
Source: rll[, accessed 29th June 201 O
-2 to «.6 (8)
- l toAn evid e n ce-led a p p roach to ta rget i n g obesity i n Suffo l k
Summarising the literatu re
The literature on obesity among children and adults suggests that:
1. Suffolk has seen an increase in the proportion of adults (18+) registered to a GP practice
recorded as clinically obese over the last three years, rising from 10.4% in 2017/18 to 11.5%
in 2019/20.
2. Findings from Public Health England published in December 2019 found that adult obesity in
England was associated with neighbourhood deprivation. In the least deprived areas 20% of
adults were obese compared to 36% of adults living in the most deprived areas3• A similar
positive trend between obesity and deprivation can be seen across Suffolk (see figure 7).
3. Results from the 2019/20 academic year indicate that prevalence of overweight and obesity
in Reception Year children (aged 4 to 5) in Suffolk is 21.6%, while the prevalence of
overweight and obesity in Year 6 children (aged 10 to 11) in Suffolk is 31.7%. Despite
performing better than England it is important to note that nearly 1 in 3 (31. 7%) Year 6
students in Suffolk are above the recommended healthy weight (see figure 8).
4. There is a strong association between deprivation and obesity in children. In 2019/20, the
prevalence of obesity in children Reception Year class (aged 4 to 5) was almost twice as high
in the most deprived areas of Suffolk (16.2%) compared to the least deprived areas of
Suffolk (8.7%). Similarly, the prevalence of obesity in Year 6 children (aged 10 to 11) was
more than twice as high in the most deprived areas (35.3%) of Suffolk compared to the least
deprived areas of Suffolk (17.3%) (see figure 11).
Priority groups: targeting through G P practices
Addressing point '1' above, targeting could be focused on the GP practices in Suffolk that present a
significantly higher prevalence of obesity compared to England and their respective CCG. There are
31 GP practices in Suffolk that meet this criterion (9 in WSCCG, 13 in IESCCG, and 9 in NWCCG). This
equates to 43,423 patients across Suffolk's GP practices.
Please see the full list of GP practices in the table below:
18Table 1: G P p ractices that present a significantly higher prevalence of obesity among adults
compared to England and their respective CCG .
GP practice Proportion of clinically Number of clinically CCG
obese patients obese patients
I I
Woo/pit Health Centre 21.9% 2532 WSCCG
Forest Surgery 15.8% 992 WSCCG
I I
Lakenheath Surgery 15.6% 671 WSCCG
Haverhill Family Practice 14.1% 1757 WSCCG
The Long Melford Practice 12.7% 997 WSCCG
The Guildhall and Barrow Surgery 12.1% I I
1254 WSCCG
11.7%
I
Stanton Surgery 512 WSCCG
Mount Farm Surgery 11.5% 1 1303 WSCCG
882 WSCCG
I I
Botesda/e Health Centre 11.5%
Grove Medical Centre 17.1% 2115 I ESCCG
I I
Haven Health 16.1% 1057 I ESCCG
The Derby Road Practice 15.9% 2165 I ESCCG
1874 I ESCCG
I I
Ravenswood Medical Practice 15.7%
Deben Road Surgery 14.6% 859 I ESCCG
I I
Combs Ford Surgery 13.7% 1029 I ESCCG
The Chesterfield Drive Practice 13.3% 1287 I ESCCG
I I
Felixstowe Road Medical Practice 13.2% 1171 I ESCCG
Stowhealth 13.1% 2133 I ESCCG
I I
The Norwich Road Surgery 13.0% 1045 I ESCCG
Burlington Road Surgery 12.8% 1699 I ESCCG
12.4%
I I
Leiston Surgery 765 I ESCCG
Barrack Lane Medical Centre 12.3% 1820 I ESCCG
I
831 NWCCG
I
Kirkley Mill Health Centre 16.4%
Victoria Road Surgery 16.1% 1450 NWCCG
I
Coastal Villages Practice 14.0% 2075 NWCCG
The Park Surgery 13.9% 1 1487 NWCCG
I I
Longshore Surgeries 13.9% 768 NWCCG
East Norfolk Medical Practice 13.8% 2800 NWCCG
I I
Andaman Surgery 13.7% 744 NWCCG
Bridge Road Surgery 13.4% 1354 NWCCG
The Millwood Partnership 12.9% 1995 NWCCG
Total number of patients recorded as clinically obese
I 43423
Source: QOF 2019/20
19Priority groups: targeting through geographies
Tackling points 2 to 4 above, it is clear that there is a strong association between deprivation and
obesity among children and adults in Suffolk. Moreover, this report has evidenced that the
prevalence of obesity for children through to adulthood can oftentimes be determined by
geography.
Using MSOA geographies and the prevalence of obesity within the MSOA, priority localities for
obesity outreach can be established. The top 20 MSOAs in Suffolk for the following can be seen in
table 2:
1) overweight or very overweight children at Reception Year (aged 4 to 5),
2) overweight or very overweight children at year 6 (aged 10 to 10), and
3) adults (aged 18+) recorded as clinically obese.
There are 90 MSOAs that cover Suffolk. 43 MSOAs appear in the 'top 20' list for the categories listed
above (see table 2).
Using the 'top 20' MSOAs to establish whether there are common geographies relating to obesity at
Reception Year, year 6, and adulthood will allow Public Health Suffolk, along with the wider health
system, to target obesity outreach in areas that have a higher prevalence of cross-generational
obesity. These priority groups are seen as:
A. Priority group 1: MSOAs that appear in the 'top 20' across all three subgroups 3 (see table 3);
B. Priority group 2: MSOAs that appear in the 'top 20' for 2 of the 3 subgroups (see table 4);
and
C. Priority group 3: MSOAs that appear in the 'top 20' for 1 of the 3 subgroups (see table 5).
3 The 3 subgroups refer to 1) children at Reception Year, 2) children at year 6, and 3) adults
20Table 2: Top 20 MSOAs in Suffolk based on the proportion of overweight or very overweight children in Reception Year {aged 4-S), year 6 {aged
10-11), and clinically obese adults {18+)
Racaption
Y•ar MSOA MSOAnam• Y...- 6 MSOA MSOAnama Adult MSOA MSOAname
Mid Suffolk
25.0% St Edmundsbury 007 Bury St Edmunds West 37.5% Ipswich 003 Whitehouse 19.5% 006 Elmswell South, Haughley, Beyton & Felsham
Mid Suffolk
23.9% Ipswich 006 Westgate 37.1% Ipswich 001 Whitton 17.1% 004 Thurston, Badwell Ash & Elmswell North
St Edmundsbury Forest Heath
23.8% Ipswich 015 Stoke Park 36.4% 003 Howard Estate & Northgate 15.0% 002 Lakenheath
St Edmundsbury Kedington, Hundon &
23.5% Suffolk Coastal 014 Felixstowe West 35.3% 011 Wit he rsfield 14.9% Waveney 007 Lowestoft Harbour & Kirkley
Suffolk
22.2% Suffolk Coastal 015 Felixstowe Seafront 35.1% Ipswich 012 Maiden hall, Stoke & Port 14.5% Coastal 012 Trimley & Kirton
Clare, Cavendish & Suffolk
21.3% St Edmundsbury 010 Wickham brook 35.1% Waveney 002 Gunton West 14.5% Coastal 014 Felixstowe West
Suffolk
20.5% Ipswich 003 Whitehouse 34.1% Ipswich 015 Stoke Park 14.5% Coastal 013 Felixstowe East
20.0% Ipswich 010 Gipping & Chantry Park 33.8% Forest Heath 001 Brandon 14.3% Waveney 008 Pakefield North
Stowmarket East &
19.5% Mid Suffolk 010 Needham Market North 33.6% Forest Heath 004 Mildenhall 14.3% Waveney 005 Normanston & Oulton Broad East
St Edmundsbury
19.4% Babergh 008 Great Cornard 32.9% 012 Haverhill North 14.2% Ipswich 014 Priory Heath
Debenham, Stonham &
19.4% Mid Suffolk 007 Coddenham 32.9% Mid Suffolk 008 Stowmarket West 14.2% Ipswich 016 Gainsborough, Greenwich & Orwell
Gainsborough, Greenwich &
19.2% Mid Suffolk 001 Eye, Palgrave & Occold 32.6% Ipswich 016 Orwell 13.5% Waveney 012 Pakefield South & Kessingland
Suffolk
19.2% Waveney 004 Lowestoft Central 32.3% Ipswich 014 Priory Heath 13.5% Coastal 015 Felixstowe Seafront
Gainsborough, Greenwich
19.0% Ipswich 016 & Orwell 32.2% Ipswich 011 Holywells 13.4% Waveney 006 Oulton Broad West
St Edmundsbury Mid Suffolk
18.8% Suffolk Coastal 005 Wickham Market & Melton 30.6% 013 Haverhill West 13.4% 008 Stowmarket West
Kedington, Hundon & Suffolk Coastal Yoxford, Wenhaston &
18.2% St Edmundsbury 011 Withersfield 30.2% 001 Walberswick 13.3% Babergh 005 Sproughton, Washbrook & Hintlesham
Red Lodge, lcklingham & Suffolk Coasta I Mid Suffolk
18.0% Forest Heath 005 Moulton 30.1% 012 Trimley & Kirton 13.3% 009 Stowmarket Outer, Fin borough & Battisford
17.7% St Edmundsbury 014 Haverhill East & South 29.9% Ipswich 013 Belstead Hills 13.1% Ipswich 011 Holywells
Stowmarket East & Needham
17.6% St Edmundsbury 001 Stanton & Barmingham 29.7% Mid Suffolk 010 Market North 13.1% Ipswich 013 Belstead Hills
17.6% Suffolk Coastal 013 Felixstowe East 29.6% Ipswich 006 Westgate 13.0% Ipswich 003 Whitehouse
Source: NCMP 2020, QOF 2019/20
21Table 3: MSOAs that appear in all three subgroups
MSOA MSOA Name LTLA
I
£02006247 Whitehouse Ipswich
£02006260 Gainsborough, Greenwich & Orwell Ipswich
Table 4: MSOAs that appear in 2 of the 3 subgroups
MSOA MSOA Name LTLA
I
£02006259 Stoke Park Ipswich
£02006300 Felixstowe West East Suffolk
£02006301
I
Felixstowe Seafront East Suffolk
£02006270 Stowmarket East & Needham Market North Mid Suffolk
I
£02006283 Kedington, Hundon & Withersfield West Suffolk
£02006299 Felixstowe East East Suffolk
I
£02006268 Stowmarket West Mid Suffolk
£02006258 Priory Heath Ipswich
I
£02006255 Holywells Ipswich
£02006250 Westgate Ipswich
I
£02006298 Trimley & Kirton East Suffolk
£02006257 Belstead Hills Ipswich
Table 5: MSOAs that appear in 1 of the 3 subgroups
MSOA MSOA Name LTLA
I
£02006231 Sproughton, Wash brook & Hintlesham Babergh
£02006234 Great Cornard Babergh
I
£02006238 Brandon West Suffolk
£02006239 Laken heath West Suffolk
£02006241 Mildenhall West Suffolk
£02006242 Red Lodge, lcklingham & Moulton I West Suffolk
£02006245 Whitton Ipswich
£02006254 Gipping & Chantry Park I Ipswich
I
£02006256 Maidenhall, Stoke & Port Ipswich
£02006261 Eye, Palgrave & Occold Mid Suffolk
I
£02006264 Thurston, Badwell Ash & Elmswell North Mid Suffolk
£02006266 Elmswell South, Haughley, Beyton & Felsham Mid Suffolk
I
£02006267 Debenham, Stonham & Coddenham Mid Suffolk
£02006269 Stowmarket Outer, Finborough & Battisford Mid Suffolk
I
£02006273 Stanton & Barmingham West Suffolk
£02006275 Howard Estate & Northgate West Suffolk
£02006282
I
Clare, Cavendish & Wickhambrook West Suffolk
£02006284 Haverhill North West Suffolk
I
£02006285 Haverhill West West Suffolk
£02006286 Haverhill East & South West Suffolk
I
£02006287 Yoxford, Wenhaston & Walberswick East Suffolk
£02006291 Wickham Market & Melton East Suffolk
22£02006303 G u nton West Waveney
£02006305 Lowestoft Centra l I Waveney
£02006306 Norma nston & Ou lton Broad East Waveney
£02006307 Ou lton Broad West I Waveney
£02006308 Lowestoft H a rbour & Kirkley Waveney
£02006309 Pa kefield N o rth I Waveney
£0200631 3 Pa kefield South & Kessi ngland Waveney
23Appe n d ix 1 : I M D 2 0 19 score a n d d e c i l e
Decile Score range
1 Above 44.572
2 33.877 to 44.572
3 26. 752 to 33.876
4 21.433 to 26.751
5 17.399 to 21.432
6 13.923 to 17.398
7 11.017 to 13.922
8 8.373 to 11.016
9 5.673 to 8.372
10 Below 5.673
Refe re n ces
1. NHS Digital. Statistics on Obesity, Physical Activity and Diet, England, 2020. Statistics on
Obesity, Physical Activity and Diet, England (2020). Available at: https://digital.nhs.uk/data
and-information/publications/statistical/statistics-on-obesity-physical-activity-and
diet/england-2020/part-3-adult-obesity-copy.
2. Beatrice Lauby-Secretan, Ph.D., Chiara Scoccianti, Ph.D., Dana Loomis, Ph.D., Yann Grosse,
Ph.D., Franca Bianchini, Ph.D., and Kurt Straif, M.P.H., M.D., P. . Body Fatness and Cancer -
Viewpoint of the IARC Working Group. N. Engl. J. Med. 375:794-79,
https://assets.publishing.service.gov.uk/governmen (2016).
3. Conolly, A. & Craig, S. Health Survey for England 2018: Overweight and obesity in adults and
children. NatCen Soc. Resrearch, Heal. Soc. Care lnf. Cent. London, UK. 23-26 (2019).
4. Public Health England. Excess Weight and COVID-19 Insights from new evidence About Public
Health England. 1-67 (2020).
5. Public Health England. Excess weight can increase risk of serious illness and death from
COVI D-19. Excess weight can increase risk of serious illness and death from COVJD-19 (2020).
Available at: https://www.gov.uk/government/news/excess-weight-ean-increase-risk-of
serious-illness-and-death-fro m-covid-19.
6. NHS Digital. National Child Measurement Programme, England 2019/20 School Year. National
Child Measurement Programme, England 2019/20 School Year (2020). Available at:
https: //digita I.nhs.uk/data-and-inform at ion/pubi icat ions/statistical/nationaI-ehiId-
me asurement-programme/2019-20-school-year.
7. Dean, E. Childhood obesity. Nurs. Stand. 31, 15 (2016).
8. Department of HM Government. Childhood Obesity: A Plan For Action. Child. obeisty a plan
action 41, 59 (2018).
9. Sugisawa, Hidehiro Harada, Ken Sugihara, Yoko Yanagisawa, S. & And Shinmei, M. Health,
psychological, social and environmental mediators between socio-economic inequalities and
participation in exercise among elderly Japanese. Aging Soc. 40, (2019).
2410. Public Health England. Obesity and the environment - the impact of fast food. Obesity and
the environment - the impact offast food (2016). Available at:
htt ps://pubi icheaIthmatters.blog.gov .uk/2016 /10/21/obesity-and-t he-e nviranme nt-t he
impact-of-fast-food/.
11. Burgoine, T. et al. Does neighborhood fast-food outlet exposure amplify inequalities in diet
and obesity? A cross-sectional study. Am. J. Clin. Nutr. 103, 1540-1547 (2016).
25You can also read